 MetaTrader 5
 エキスパート
 インディケータ
 ライブラリ
 ユーティリティ
 ウィジェット
 ルール
YouTubeにあるマーケットチュートリアルビデオをご覧ください
ロボットや指標を購入する
仮想ホスティングで
EAを実行
EAを実行
ロボットや指標を購入前にテストする
マーケットで収入を得る
販売のためにプロダクトをプレゼンテーションする方法
MetaTrader 5のための新しいテクニカル指標 - 125
 テクニカル指標からのシグナルは、株式および外国為替市場での取引の開始と終了に重要な役割を果たします。指標の本質は、将来の価格変動を予測することを目的とした金融銘柄価格の数学的変換です。
テクニカル指標をテストして、市場の動きとそれからの利益をより正確に予測します。

• Please test the product in the Strategy Tester before purchasing to understand how it works.
• If you face any issues, contact me via private message—I’m always available to help.
• After purchase, send me a screenshot of your order to receive a FREE EA as a gift.
Visual Adaptive Momentum Flow Indicator Unlock a clearer view of market momentum with the Visual Adaptive Momentum Flow Indicator. This powerful tool is engineered to provide traders with a distinct advantage by moving beyond t

• Please test the product in the Strategy Tester before purchasing to understand how it works.
• If you face any issues, contact me via private message—I’m always available to help.
• After purchase, send me a screenshot of your order to receive a FREE EA as a gift. Unlock the Market's Rhythm with the Visual Momentum Wave Tracker Are you tired of second-guessing your entries and exits? Do you struggle to identify the true momentum shifts in a sea of confusing market noise? The Visual Moment

• Please test the product in the Strategy Tester before purchasing to understand how it works.
• If you face any issues, contact me via private message—I’m always available to help.
• After purchase, send me a screenshot of your order to receive a FREE EA as a gift.
Visual Dynamic Momentum Oscillator: Trade with Clarity and Confidence Are you tired of noisy indicators and confusing signals? Do you want a powerful tool that helps you identify market momentum and pinpoint high-probability tr

• Please test the product in the Strategy Tester before purchasing to understand how it works.
• If you face any issues, contact me via private message—I’m always available to help.
• After purchase, send me a screenshot of your order to receive a FREE EA as a gift. Visual Momentum Wave Indicator: Ride the True Market Force Unlock the market's underlying momentum and trade with newfound confidence for just $30! Are you tired of indicators that lag behind the price or generate false signals

• Please test the product in the Strategy Tester before purchasing to understand how it works.
• If you face any issues, contact me via private message—I’m always available to help.
• After purchase, send me a screenshot of your order to receive a FREE EA as a gift.
Trend Wave Analyzer Pro: Ride the True Market Trend Stop guessing and start seeing the real story behind price movements. Are you tired of lagging indicators that give you signals too late? Do you struggle to distinguish betwee

• Please test the product in the Strategy Tester before purchasing to understand how it works.
• If you face any issues, contact me via private message—I’m always available to help.
• After purchase, send me a screenshot of your order to receive a FREE EA as a gift.
Silver Zebra Trading System - Uncover Market Momentum Unlock a powerful new way to visualize market trends and momentum with the Silver Zebra Trading System. This unique MetaTrader 5 indicator is designed to give you a clear an

Visual CrossPulse Dynamics: Trade with the Market's True Rhythm Unlock a new level of market insight with Visual CrossPulse Dynamics, a sophisticated trading indicator designed to adapt to ever-changing volatility and reveal the true direction of the trend. Are you tired of indicators that lag in fast-moving markets or give false signals during consolidation? The Visual CrossPulse Dynamics indicator solves this problem by using an advanced, adaptive algorithm that intelligently adjusts to the m

Eabotpro Auto Filter — Liquidity, Trendlines & Fibonacci in One Smart Indicator Eabotpro Auto Filter is an advanced technical analysis indicator for MetaTrader 5 designed to help traders identify key market structure, liquidity areas and reaction levels with precision and clarity. By combining liquidity zones, dynamic trendlines and fixed Fibonacci levels in a single tool, Eabotpro Auto Filter provides a clean and powerful chart view without excessive indicators or visual noise. It is suitable
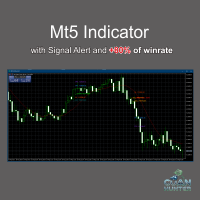
Features: Clear Buy/Sell labels with directional arrows. Automatic Take Profit (TP) & Stop Loss (SL) labels for better risk management. Easy-to-read chart signals (no messy lines). Works on any timeframe and any asset (Forex, Gold, Indices, Crypto, Stocks). Compatible with MetaTrader 5 (MT5 desktop & mobile sync) . Perfect for: Beginner traders who need straightforward signals. Experienced traders who want an extra confirmation tool. Anyone looking to simplify their chart without clutter.

• Please test the product in the Strategy Tester before purchasing to understand how it works.
• If you face any issues, contact me via private message—I’m always available to help.
• After purchase, send me a screenshot of your order to receive a FREE EA as a gift.
Dolphin Pulse Momentum: Ride the Waves of Profit Unlock the power of the market's natural rhythm with Dolphin Pulse Momentum, a sophisticated trading indicator designed to give you a decisive edge. You can equip yourself with a

• Please test the product in the Strategy Tester before purchasing to understand how it works.
• If you face any issues, contact me via private message—I’m always available to help.
• After purchase, send me a screenshot of your order to receive a FREE EA as a gift.
Dolphin Wave Pulse Indicator Unlock the underlying rhythm of the market with the Dolphin Wave Pulse Indicator, a sophisticated tool designed to identify high-probability entry points with precision. This indicator moves beyond
Initial Balance Session The Initial Balance Indicator is a professional-grade tool for MetaTrader 5 traders, designed to enhance your trading by visualizing key price levels during the Australia, Tokyo, London, and US market sessions. This indicator plots the Initial Balance (IB) range—the high, low, and midpoint prices—formed during the first hour of each session, with a customizable box to highlight the range and optional extension levels for advanced analysis. Optimized for smooth, flicker-f

Unleash the Power of Market Momentum with the Visual Wolf Sphere Indicator Are you ready to gain a profound understanding of the market's inner workings? The Visual Wolf Sphere Indicator is not just another tool; it is a comprehensive trading solution designed to give you a crystal-clear view of volume dynamics and market sentiment. For just $30, you can equip yourself with an indicator that deciphers the complex language of the market, helping you to make more informed and confident trading de

• Please test the product in the Strategy Tester before purchasing to understand how it works.
• If you face any issues, contact me via private message—I’m always available to help.
• After purchase, send me a screenshot of your order to receive a FREE EA as a gift. Visual Eagle Momentum Indicator: Trade with Clarity and Precision Unlock the market's true momentum and leave noisy, confusing indicators behind. For just $30, the Visual Eagle Momentum Indicator gives you a powerful edge, helpi

Visual Arctic Wolf Indicator: Hunt Down Market Momentum Unleash the power of the Arctic Wolf on your charts. This meticulously designed indicator for MetaTrader 5 provides a unique and intuitive way to visualize momentum shifts and capture high-probability trading signals. Stop guessing the market's direction and start trading with the precision of a predator. The Logic: Tracking the Hunt The Visual Arctic Wolf Indicator operates on a powerful and straightforward principle: measuring the balanc

Visual Tiger Speed Indicator: new full-chart interface and bug fixes Test it free in the Strategy Tester before buying.
Questions? Send me a private message.
Send a screenshot of your order and get a free expert advisor. Visual Tiger Speed Indicator measures how fast price is moving, not only where it is. It averages price change over a few bars, wraps the speed in a deviation envelope scaled by its own RMS, and marks a dot when the speed breaks that envelope. A live gauge on the chart shows the

• Please test the product in the Strategy Tester before purchasing to understand how it works.
• If you face any issues, contact me via private message—I’m always available to help.
• After purchase, send me a screenshot of your order to receive a FREE EA as a gift. Unlock the Market's True Direction with the Visual Polar Bear Indicator Are you tired of relying on single-instrument indicators that only show a fraction of the market's story? Do you want a powerful, visual tool that cuts thro

• Please test the product in the Strategy Tester before purchasing to understand how it works.
• If you face any issues, contact me via private message—I’m always available to help.
• After purchase, send me a screenshot of your order to receive a FREE EA as a gift. Visual Falcon Range Indicator: Master Market Breakouts Unlock the power of dynamic range analysis and trade breakouts with confidence. Are you tired of entering trades too early in choppy markets or missing out on powerful, expl

• Please test the product in the Strategy Tester before purchasing to understand how it works.
• If you face any issues, contact me via private message—I’m always available to help.
• After purchase, send me a screenshot of your order to receive a FREE EA as a gift. Unlock Market Momentum with the Visual Eagle Momentum Cycle Indicator Are you tired of noisy charts and lagging indicators that give signals too late? Do you struggle to find clear entry and exit points in today's volatile marke

• Please test the product in the Strategy Tester before purchasing to understand how it works.
• If you face any issues, contact me via private message—I’m always available to help.
• After purchase, send me a screenshot of your order to receive a FREE EA as a gift. Visual Lynx Wave: Your Ultimate Trend Navigator Are you tired of second-guessing the market trend? Do you struggle with noisy indicators that provide late or confusing signals? The Visual Lynx Wave indicator is the definitive so

Unleash the Power of Momentum with the Visual Wolf Indicator Are you tired of momentum indicators that give false signals and leave you caught in market chop? The Visual Wolf Momentum Indicator is a professionally engineered tool designed to cut through the noise, identify dominant market trends, and provide clear, high-probability trading signals directly on your chart. For just $30, you can equip yourself with an indicator that doesn't just follow the price—it understands the force behind it.

Visual Eagle Momentum Indicator Unlock Market Momentum and Pinpoint High-Probability Trades with Unmatched Clarity Are you tired of cluttered charts and lagging indicators that leave you guessing? The Visual Eagle Momentum Indicator is a professionally developed trading tool designed to cut through the noise, providing clear, non-repainting buy and sell signals based on a unique and powerful momentum analysis engine. For just $30, you can equip yourself with an indicator that helps you spot tur

• Please test the product in the Strategy Tester before purchasing to understand how it works.
• If you face any issues, contact me via private message—I’m always available to help.
• After purchase, send me a screenshot of your order to receive a FREE EA as a gift.
Visual Dolphin Indicator Unlock the rhythm of the market with the Visual Dolphin Indicator, your ultimate tool for identifying and capitalizing on market trends with clarity and confidence. Designed for both novice and experien

Visual Waves Indicator: Ride the Trend with Clarity Unlock a smarter way to trade with the Visual Waves Indicator, a sophisticated tool designed to provide clearer, more reliable trend signals on the MetaTrader 4 platform. Are you tired of the false signals and market noise generated by traditional moving averages? The Visual Waves Indicator is your solution. It moves beyond basic calculations to offer a truly adaptive analysis of market momentum, helping you identify trading opportunities with
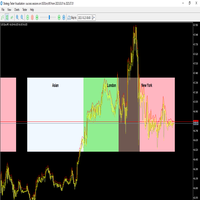
The Sessions Indicator visually highlights the major trading sessions (Asian, London, and New York) directly on the chart by drawing shaded rectangles. It helps traders quickly identify market activity zones, overlaps, and session-specific behaviors. Key Features:- Session Highlighting: Asian, London, and New York sessions are displayed using shaded rectangles with customizable colors.- Custom Session Times: Start and end times for each session can be adjusted to match broker server time.- Sessi
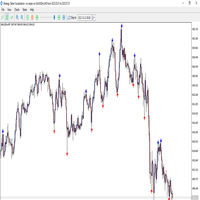
Overview The Reverse No Repair indicator is a trend-reversal detection tool that identifies potential turning points in the market with high accuracy. It is designed to provide non-repainting BUY/SELL signals based on candle body strength, volatility filtering, and future confirmation logic. The indicator marks reversal points on the chart using arrows: Red arrow (Down Signal) – Possible bearish reversal (sell opportunity). - Blue arrow (Up Signal) – Possible bullish reversal (buy opportunity).
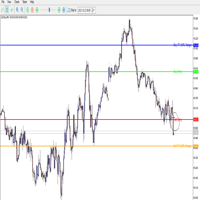
This custom MT5 indicator automatically draws trading levels based on the previous H4 candlestick. It is designed to help traders quickly identify potential entry and take profit (TP) points according to a simple breakout strategy. What it does:- Draws Buy Entry line at the previous H4 High.- Draws Sell Entry line at the previous H4 Low.- Calculates the 50% range of the previous H4 candle and plots: • Buy TP line above the High. • Sell TP line below the Low.- Adds text labels directly on the cha

Propfirm Risk Guard Dashboard — Prop‑firm P/L, Drawdown & Exposure Monitor for MT5 Propfirm Risk Guard Dashboard is a compact chart indicator that gives traders an instant, accurate view of their challenge-style limits and worst‑case exposure. Built for traders preparing or taking prop firm evaluations, it aggregates closed P/L, floating P/L, and estimated SL exposure (open + pending) and compares them to your configured daily drawdown, max loss (initial drawdown), and profit target — all in on
FREE

An effective tool for traders, the Equilibrium Gauge indicator is designed to identify significant price shocks and subsequent market reactions. It automatically detects large, impactful candles and projects three key zones—Shock, Absorption, and Tension—to forecast potential areas of market reversal or continuation. When the price enters the critical "Tension Zone" and specific conditions are met, the indicator will generate a clear BUY or SELL arrow, providing a straightforward signal for pote
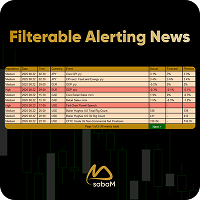
MsabaM Filterable Alerting Economic News Calendar This indicator is designed for MetaTrader5 and utilizes the broker's economic calendar, accessible via https://www.mql5.com/en/economic-calendar , to display global economic news directly on the chart. It eliminates the need for daily checks on economic news websites. Features of this indicator include: News Display on Chart: News times are visualized as vertical lines on the chart. Medium-importance news appear in orange, while high-importance

Smart Volume Profile は、2 本の縦線の間で出来高分布をリアルタイムに計算・表示するプロフェッショナルなインジケーターです。買いと売りを分割表示し、POC・VAH・VAL レベルも描画します。裁量取引にもシステム取引にも対応し、市場がどの価格帯で最も多く取引されたか、そして買い手と売り手の力関係がどのように分布しているかを確認できます。 このインジケーターを選ぶ理由 分析期間を完全にコントロール — 2 本のドラッグ可能な VLINE で範囲を定義。
買いと売りの分割表示 — 専用カラーでどちらが主導しているか一目で把握。
POC・VAH・VAL の機関投資家レベル — 明確に描画され常に更新。
最適化されたパフォーマンス — ティックデータを使用し、利用できない場合はスマートな代替処理。
アダプティブ表示 — プロファイル幅をチャートサイズに比例させて高い可読性を維持。 動作方法 VP begin と VP finish という 2 本の VLINE を描画して時間範囲を設定します。インジケーターは価格レベルごとの出来高を、設定可能な数のバケットに集計します。取引
FREE

Fair Value Gap (FVG) & Inversion Fair Value Gap (iFVG) – TradingLabs ID(公正価値ギャップと反転公正価値ギャップ) ICT(インナーサークルトレーダー)およびスマートマネーコンセプト(SMC)の手法において、Fair Value Gap(FVG、インバランスとも呼ばれる)は、価格が極端なモメンタムで動いた際に流動性の空白地帯が残されることで発生します。これらの未埋めのギャップは将来の値動きに対する磁石として機能し、プロのトレーダーにとって最も確率の高い押し目買い・戻り売りおよびエントリーゾーンとなります。 しかし、すべてのFVGが同じではありません。どのギャップに本当の機関投資家の重みがあるのか、どうすればわかるでしょうか? FVG & iFVG Pro インジケーターのご紹介。 私たちは標準的なインバランス検出を次のレベルへと引き上げました。このツールは、新鮮な状態(Fresh)、緩和済み(Mitigated)、そして反転FVG(iFVG)をピンポイントの精度で自動検出するだけでなく、 業界初のダイナミック・スコア

Change In State Delivery (CISD) Indicator - ICT Concepts 市場の反転を推測するのはやめ、プライスアクションにおける真のアルゴリズムのシフトでトレードを始めましょう。 Change In State Delivery (CISD) インジケーターは、Inner Circle Trader (ICT) および Smart Money Concepts (SMC) を利用するトレーダーのために綿密に設計されたプレミアムチャートツールです。 このツールは、マーケットメーカーが注文の配信を買い手側から売り手側へ、またはその逆にシフトする正確なタイミングを特定するために必要な決定的な優位性となります。最も強力な ICT コンセプトの 1 つを自動化することで、このインジケーターはチャート分析から感情、主観性、推測を完全に排除します。 ICT コンセプトにおける CISD の力: アルゴリズム取引理論において、Change in State Delivery は原資産の市場アルゴリズムがそのプログラムをシフトしたときに発生します。これは単なるサ
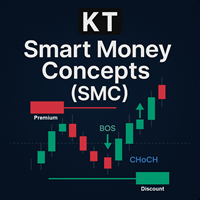
すべてのラベルが確定足で確認される Smart Money Concepts(SMC / ICT)インジケーターです。 BOS、CHoCH+、インデュースメント、オーダーブロック、ブレーカー、フェアバリューギャップ(FVG)、流動性スイープ、キルゾーン を表示し、マルチタイムフレームのバイアスパネルも搭載しています。 過去チャートで見る内容は、リアルタイムで表示されたものとまったく同じです。無料デモをダウンロードして、ビジュアルテスターで各ラベルが足ごとに表示される様子をご確認ください。 表示される内容 スイング構造と内部構造: BOS、CHoCH と CHoCH+、HH、HL、LH、LL、さらに現在のレンジの強い高値・安値と弱い高値・安値。 インデュースメント: 価格が最初の押し目・戻りを取るまでは "IDM pending"、その後は "IDM x" と表示。 オーダーブロック には出来高比率、離脱の動きがギャップを残した場合の +FVG タグ、タッチ回数を表示。 ブレーカーブロックとミティゲーションブロック は自動で区別され、破線と点線の枠で表示。 フェアバリューギャップ は現在

高度な経済カレンダーインジケーター このインジケーターは、選択した通貨ペアまたは取引銘柄に関連するすべての今後の経済イベントをチャート上に直接表示します。高ボラティリティのタイミングを事前に把握し、より正確に取引戦略を立てることができます。 主な機能 最大 5日先 までの経済イベントを表示(カスタマイズ可能)。 ニュースの影響度 (高・中・低)によるフィルタリング。 垂直ライン や 番号付きマーカー の表示を選択可能。 ニュースの重要度を区別するための色を自由に設定可能。 主要な 世界通貨 (USD, EUR, GBP, JPY, CNY, AUD, CAD, NZD, CHF など)に自動・手動対応。 主要な 世界指数や金融商品 を自動認識(SP500, NASDAQ, DAX, FTSE, CAC40, 日経225, ハンセン指数, Eurostoxx, IBEX, MIB など)。 日付・時間・通貨・影響度・イベント名 を表示する内蔵イベントテーブル。 イベントが重なった場合も、マーカーを自動調整して見やすさを確保。 利用する理由
このインジケーターは、FX、株価指数、コモディ
FREE

Order Block + Fair Value Gap (FVG) Indicator. Ultimate SMC and ICT Order Block Pro with FVG and Dynamic Scoring. Master Institutional Trading with Precision(オーダーブロック+FVGインジケーター。ダイナミック・スコアリングとFVGを備えた究極のSMC・ICTオーダーブロックPro。機関投資家のトレードを精密にマスターする) ごちゃごちゃしたチャートや主観的な分析にうんざりしていませんか? Ultimate SMC and ICT Order Block Pro で機関投資家のトレードの世界へ踏み出しましょう。これは単なる基本的なインジケーターではありません。 スマートマネーコンセプト(SMC) および インナーサークルトレーダー(ICT) の手法を活用するトレーダー向けに特別に設計された、高度なアルゴリズム型チャートツールです。 絶対的な精度のために構築されたこのインジケーターは、高確率の機関投資家エントリーゾーンを自動的に特定し
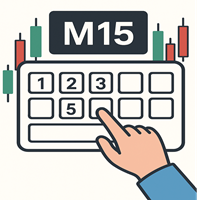
**TimeViewで時間足を即時切り替え!**
MetaTrader 5用のTimeViewインジケーターは、わずかなキー操作でどんな時間足にも即時切り替えを可能にします。複雑なメニューも検索も不要。高速、直感的、そして効率的!
**主な特徴:** キーボードショートカット:数字キー(1-6, 8)でパネルを起動 カスタマイズ可能:色、フォント、パネルサイズを調整 全時間足対応:M1からMN1まで完全サポート スムーズな操作:Enterで確定、Escapeでキャンセル
**メリット:** - 時間節約:数秒で時間足を切り替え - 集中持続:相場から目を離さずに操作 - 無料提供:コストなし、煩わしさなし
**使用方法:** 1. 数字キーを押す(例:1, 4, 6) 2. コードを入力(例:15でM15、1hでH1) 3. Enterキーで確定!
**TimeViewで分析を加速!ここから無料ダウンロード!**
FREE
DRX SPREAD MONITOR は、ブローカーのスプレッドをリアルタイムで可視化・分析するために設計されたプロフェッショナルなユーティリティです。ニュースイベント、ロールオーバー、または流動性の低いセッション中のスプレッド拡大によって引き起こされる隠れたコストを特定するのに役立ちます。 このツールは、約定品質を確保し、取引コストが統計的に高すぎる場合のトレードを回避する必要があるスキャルパーやゴールドトレーダーにとって不可欠です。 主な機能 リアルタイムヒストグラム: 別のウィンドウにスプレッド履歴を表示し、通常、高、極端なレベルを色分けします。 動的移動平均(MA): 平均スプレッドの傾向を計算し、一時的なスパイクと構造的なスプレッドの増加を区別するのに役立ちます。 視覚的「イコライザー」モード: チャートを乱雑にすることなく、市場の流動性状況に関する即時フィードバックを提供する独自のバーチャート表示です。 ライブデータパネル: チャート上のコンパクトなダッシュボードで以下を表示します: 現在のスプレッド 平均スプレッド(時間ベース) 最小/最大記録 音声警告システム: スプレ
FREE

Auto Candle Sequence Counter – MT5インジケーター 概要
Auto Candle Sequence Counter は、MetaTrader 5 向けのプロフェッショナルインジケーターで、連続する強気・弱気ローソク足のシーケンスを自動的に検出し表示します。手作業で数える必要がなく、リアルタイムでの可視化、統計、アラートを提供します。 主な機能 2〜7本の連続ローソク足(強気/弱気)の検出。 正確なマッピングでシグナルを見逃さない。 Doji検出(感度0.01–0.10調整可)。 弱いローソクをフィルタリング。 プロ仕様の可視化(緑=強気、赤=弱気、黄=ドージ)。 リアルタイム統計パネル。 アラートシステム:ポップアップ、サウンド、プッシュ通知。 利点 トレンド継続や反転のタイミングを迅速に特定。 需要供給、サポート/レジスタンス、SMCと組み合わせ可能。 スキャルピング、スイング、デイトレに最適。 手動のカウント作業を不要に。 設定 シーケンス閾値: 2〜7本 分析範囲: 50〜500本 Doji感度: 0.01–0.10 テーマ: 黒/白背景 アラ
FREE

皆さん、こんにちは。これはMT5ターミナル用の更新バージョンです。 これは私の最初のインジケーターを基にした新製品で、余分な設定を省き、ゴールド(金)に最適化された改良版です。 このインジケーターは通知の送信をサポートしています。 使用に関する推奨事項: 銘柄 - XAUUSD (主要銘柄、これに最適化されています) 銘柄 - XAUEUR (副次的な銘柄、最適化はされていませんが、結果は良好です) 時間足 - H4。 インジケーターをチャートに設定したら、そのままにしてください。 買いシグナル - 青色の矢印。 売りシグナル - 赤色の矢印。 エントリーポイントを見つけるための主要な情報源として使用できます。 ストップロス: 黄色の点 - これに従うことをお勧めします。 使用シナリオ: 次のローソク足の方向と終値を予測します。そのため、シグナルを受け取ったら、シグナルが表示されたローソク足の終値を目安に取引を終了してください。 テイクプロフィット: TPは任意ですが、ないよりはましです。どこにTPを設定するか、または取引を終了するかわからない場合は、直
FREE

Spike Detector XTREEM は、シンセティックインデックス専用に開発された高精度スパイク検出インジケーターです。インテリジェントなトレンドベースのロジックにより、待機・フィルタリングを行いながら本物のスパイク形成を見極め、条件が真に揃ったタイミングでのみ、明確でリペイントしないシグナルを発信します。 ユーザーガイド | Trend Histogramをダウンロード | お問い合わせ
本インジケーターをご購入いただくと、 Trend Histogram インジケーターが 無料 で付属します。
Spike Detector XTREEMの違い トレンドフィルター付きシグナル — 強気相場が確認された場合のみ買いシグナル、弱気相場が確認された場合のみ売りシグナルを表示 リペイントなし — 表示されたシグナルは確定で、後から消えることはありません シンセティックインデックス専用設計 — 汎用FXツールの転用ではありません スパイクパターンが最も取引しやすいM1/M2時間足に最適化 ノイズをカット — 急なローソク足ごとに矢印が氾濫することはありません
シンセティックインデ

Cycle RSI Adaptive – スマートなインジケーターでトレーディングを向上 1. 概要 Cycle RSI Adaptiveは、従来のRSIの進化版であり、トレンド、反転、取引機会をより高い精度で特定するために設計されています。インテリジェントなノイズフィルタリング、市場に適応した調整、明確なシグナルを備えており、初心者からプロのトレーダーまで理想的なインジケーターです。 主な利点: 使いやすく、著者から詳細なガイダンスが提供されます。 手動トレードや自動システム(EA/バックテスト)に最適化。 誤ったシグナルを最小限に抑え、トレーディングの自信を高めます。 2. 価格と早期購入者向けオファー ローンチ期間(2025年8月17日~2025年9月30日): 30ドル / 6ヶ月 50ドル / 年 2025年9月30日以降: 35ドル / 6ヶ月 59ドル / 年 特別オファー :早期購入者は割引価格でフルバージョンにアクセスでき、著者からの直接サポートを受けられます。 3. Cycle RSI Adaptiveを選ぶ理由 Cycle RSI Adaptiveは単なるインジ
KT Adaptive RSI インジケーターは、従来の RSI に適応型モジュールを組み合わせ、現在の市場状況に基づいて動的な買われすぎ・売られすぎレベルを特定します。従来の RSI では、70 以上で買われすぎ、30 以下で売られすぎと判断しますが、これはすべての銘柄に当てはまるとは限りません。 当社の適応型モジュールは、過去データを迅速に分析し、最適な買われすぎ・売られすぎの閾値を自動的に判定します。これにより、トレーダーはリアルタイムの市場動向に合わせた正確なエントリー・エグジット判断が可能になります。
平均回帰エントリー
極端な値動きの後に平均価格へ戻る傾向がある銘柄では、本インジケーターが特定した動的な買われすぎ・売られすぎゾーンを活用して、正確にエントリーできます。この手法により、短期的な価格変動を捉えて素早く利益を確定できます。
トレンドフォローエントリー
強いトレンドで動く銘柄の場合、これらの動的ゾーンを利用してトレンド方向に沿ったエントリーが可能です。これにより、自信を持って値動きを追い、大きな利益を狙えます。
特徴
トレンドフォロー戦略と平均回帰戦略の両方に
Moving Price Line Plus Event Timer Indie この素晴らしくシンプルなインジケーターは、現在の価格がいつ発生しているかを正確に知るために作られました。 特定の時間や分で取引する人に役立ちます。 また、チャート上に表示されるイベントタイマーを設定することもできます。時間または分単位で設定可能です。 ユーザーはテキストやラインの色を自由に変更できます。 ユーザーはローカル時間またはブローカーのタイムゾーンを選択でき、市場でイベントが発生する正確な時間を特定する際の混乱を避けられます。 これにより、トレーダーはブローカーのタイムゾーンと自分のローカル時間を把握できます。 ポップアップ通知、サウンド通知、メール通知があり、トレーダーは見逃すことなくタイムリーに情報を得られます。 トレーダーは好みに応じて価格ラインの太さを設定できます。 トレーダーはインジケーターのテキストを表示するチャート上の位置を設定できます。 トレーダーは価格ラインの時間を現在価格の上部または下部に表示するかを選択でき、見やすさを確保できます。 この貴重なインジケーターをぜひお楽しみくだ

KT Parabolic RSI は、RSI ラインの上にパラボリックSARを直接重ねて表示し、市場の転換点をわかりやすく強調します。従来のRSIの買われすぎ・売られすぎ水準はすでに反転を示唆しますが、PSARフィルターを追加することで不要なノイズを取り除き、シグナルをより明確かつ信頼できるものにし、取引機会をより精度の高い形で提供します。 大きな四角シグナル: RSIが買われすぎまたは売られすぎゾーンにあるときにパラボリックSARが反転。このサインは高い確率で市場の転換を示します。 小さな四角シグナル: RSIが中立帯の範囲にあるときのSAR反転。これらは低確率のシグナルとして扱い、部分的な利確や既存トレンドの継続に活用できます。
特徴 RSIのモメンタムとパラボリックSARのトレンド反転を1つの画面に統合し、2つのインジケーターを別々に管理する必要がなくなります。 RSIウィンドウに表示される四角マーカーはメインチャート上にも反映されるため、価格の動きを見ながらシグナルを確認できます。 ローソク足分析とRSI-SARの定量シグナルを組み合わせ、エントリー前にチャートパターンを確認

Finally, a dashboard that cuts through the noise and shows what actually matters. – Displays All Symbols In Your Market Watch List (Updates in real time) This advanced Multi-Timeframe ATR & Volume Dashboard gives traders a crystal-clear view of market volatility and liquidity across all symbols and timeframes in one glance . Real-Time ATR & Volume Data – See exact volatility (ATR) and trading activity (Volume) for M1 to MN1
Smart Grouping – Automatically classifies instruments (Forex, In
FREE

ドンチャン・グラデーションは 、従来のチャネル分析を直感的な トレンド追跡システム に変革します。色の変化がダイナミックなドンチャン・チャネルを価格チャートに直接描画し、 リアルタイムの色の変化を通してトレンドの強さ と 市場 バイアスの変化を視覚的に示します。この自動適応型価格チャネルは、境界線と色相を調整することで 、新たなトレンドを確認し、潜在的な反転を察知し 、 ブレイクアウトの機会が生まれるとそれをハイライトします 。色分けされた視覚化により、複雑な価格アクションの解釈が簡素化され、トレーダーは市場の勢いを一目で把握できるようになります。
仕組み このツールは継続的に計算し、 最高値と最低値 選択した期間(デフォルト:10本のバー)のチャートを、メインチャート上に変化するチャネルとして描画します。色のグラデーションは市場の状況に応じて変化します。 強気バイアス(青): チャネル上限付近での価格取引 弱気バイアス(赤): チャネル下限値の価格テスト
主な特徴 ライブチャンネルの視覚化: 価格抑制の境界をチャート上で直接確認 適応型カラーコ
EZ Trends は、リアルタイムで市場構造の変化を捉えるために設計された精密なトレンド検出インジケーターです。
独自の EMA–HMA ハイブリッドバンドシステムを使用し、ローソク足の色を自動的に変化させてトレンド方向を強調し、新しいトレンドの開始時に反応レベルを表示します。
その結果、トレーダーがモメンタムに沿い、市場ノイズを排除するのに役立つ実用的なツールとなります。 主な特徴 トレンド検出ロジック: EMA と HMA の平均を使用した3ラインチャネル。 ローソク足の平均レンジで上下バンドを動的に拡張。 ボラティリティに即応、収縮・拡大・ブレイクアウトの可能性を示す。 上昇トレンド: 価格が上バンドを上抜けてクローズ。 下降トレンド: 価格が下バンドを下抜けてクローズ。 ローソク足の色を自動変更(ライム=上昇、ブルー=下降)。 トレンド開始レベル: 新トレンド開始時に極端な安値/高値をロック。 点線水平ラインを引き、リテストやバリデーションゾーンを示す。 ビジュアルレイアウト: 中央線: EMA と HMA の点線平均。 上下線: 適応バンド。 ローソク色の変化と合わせて、市
Zeiierman アダプティブ移動平均線は、適応的なトレンド分析を通じて取引機会を特定するために設計されたテクニカル分析ツールです。これは、TradingView における Zeiierman のオリジナル指標を基にした Metatrader 用の適応版であり、複数の分析手法を組み合わせて市場の視覚的な評価を提供します。
技術的特徴 市場のボラティリティに基づく適応的平滑化アルゴリズムを使用 感度を動的に調整するために効率比 (ER) を計算 ボラティリティ測定のためにシグマバンドを組み込み 色付きの移動平均線によってトレンド方向を表示 トレンド変化やシグナルに関する設定可能なアラートを含む
機能
このインジケーターは市場データを処理して以下を行います: ボラティリティの状況に応じて平滑化係数を調整 色の変化によってトレンド方向を表示(強気、弱気、または中立) シグマに基づく条件を用いてエントリーおよびエグジットの可能性を生成 トレンドを視覚化するためのローソク足カラー表示をオプションで提供
想定される利用例 トレンドフォロー戦略や平均回帰戦略に役立つ可能性がある 外国為替、株
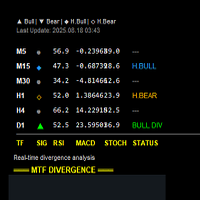
マルチダイバージェンスMTFインジケーター (MT5)
強力な反転を事前に特定 マルチダイバージェンスMTFは、複数の時間枠での確認とリアルタイムアラートを求めるプロのトレーダー向けに設計された、高度なダイバージェンス検出ツールです。
1つのオシレーターのみで動作する標準的なダイバージェンスインジケーターとは異なり、このツールはRSI、MACD、ストキャスティクスを同時にスキャンし、最大6つのより長い時間枠でシグナルを確認します。その結果、スキャルピング、デイトレード、スイングトレードにおいて、より強力で、より明確で、より信頼性の高いダイバージェンス設定が可能になります。
主な機能 マルチ時間枠での確認 最大6つのより長い時間枠(M5/M15/M30/H1/H4/D1)で動作します。 ノイズを除去し、より大きなトレンドに沿ったダイバージェンスのみを取引します。 通常のダイバージェンスと隠れたダイバージェンス 通常のダイバージェンス → トレンドの反転を予測します。 隠れたダイバージェンス → トレンドの継続を予測します。 チャート上に明確な矢印で表示されます。
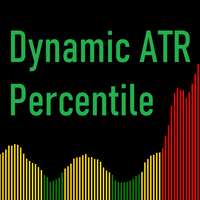
ダイナミックATRパーセンタイル (Dynamic ATR Percentile) 概要 「ダイナミックATRパーセンタイル」は、トレーダーが現在の市場状況を客観的に判断するのに役立つボラティリティ分析ツールです。ボラティリティは静的なものではありません。ある金融商品や時間足で「高い」と見なされるATR値が、別の状況では「低い」こともあります。このインジケーターは、過去のデータに基づいて動的なボラティリティゾーンを計算することでその問題を解決し、明確で適応性のある視覚的なガイドを提供します。 固定のATR値に頼る代わりに、このインジケーターは取引している金融商品の直近の履歴を分析し、その特定の状況において統計的にボラティリティが低いか、通常か、高いかを判断します。 仕組み インジケーターのロジックは、標準的なアベレージ・トゥルー・レンジ(ATR)と統計的パーセンタイルに基づいています。 まず、各バーのATRを計算します。 次に、ユーザーが定義した過去のバー(ルックバック期間)を遡り、ATR値の履歴サンプルを構築します。 このサンプルを使用して、パーセンタイルに基づいたしきい値を計算しま

VEHI_v2_Improved 紹介 VEHI_v2_Improved (ボラティリティ-エントロピー混合指標)は、MetaTrader 5 (MT5) 用に設計された高度なテクニカル指標で、VWAP(出来高加重平均価格)を基盤とし、スマートで再描画しない機能を提供します。以下にその主な利点を示します: 1. 市場ボラティリティへの適応 市場のボラティリティ(ATR)に基づいて VWAP ウィンドウサイズを調整し、以下の効果があります: 高ボラティリティ環境での迅速な反応。 低ボラティリティ市場での安定したシグナル。 2. 再描画なし VWAP、UpperBand、LowerBand、買い/売りシグナルはキャンドルクローズ後に固定され、以下を提供します: 手動および自動取引の高信頼性。 シグナルの変更がなく、より高い精度。 3. ニュース検出 ATR を使用して異常なボラティリティ(ニュースイベント)を検出し、これらの期間中は更新を一時停止して: 偽のシグナルを回避。 ボラティルな市場での取引リスクを軽減。 4. 明確な取引シグナル チャート上に矢印で買い/売りシグナルを提供: 買い
Get ALL my MT4 & MT5 indicators FREE — See how here
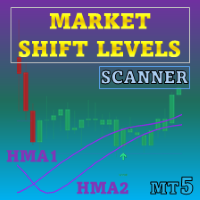
特別オファー : ALL TOOLS 、各 $35 のみ! 新しいツール は 最初の 1 週間 または 最初の 3 回の購入 について $30 になります! MQL5 の Trading Tools チャンネル :私の最新情報を受け取るため、MQL5 チャンネルに参加してください このインジケーターは、Hull Moving Average(HMA)のロジックを用いてトレンドの転換を特定し、市場構造の転換点を可視化します。価格が反応しやすい潜在的なサポート/レジスタンス領域を強調し、初期のトレンド移行を観察するのに役立ちます。 MT5 版はこちら: Market Shift Levels MT5 Scanner MT4 版はこちら: Market Shift Levels MT4 Scanner その他の製品はこちら: All P roducts Market Shift Levels は、市場行動の方向変化を示す水平ゾーンです。これらのシフトは、遅

学習可能な人工知能とニューラルネットワーク。 SolarTrade Suite 金融指標 - Theia 市場指標!
これは、革新的で高度な特別なアルゴリズムを使用して値を計算する指標です。
金融市場の世界であなたのアシスタントとなるでしょう。
SolarTrade Suite - Theia 市場指標は、金融商品の価格を数値先まで予測し、その結果をターミナルウィンドウにコメントとして表示します。
説明の下部にある SolarTrade Suite シリーズの他の製品もご覧ください。
投資と金融市場の世界を自信を持ってナビゲートしたいですか? SolarTrade Suite - Theia 市場指標は、情報に基づいた投資判断を行い、利益を増やすのに役立つ革新的なソフトウェアです。
SolarTrade Suite - Theia 市場指標金融指標のメリット:
- 正確な計算:当社の指標は、高度なアルゴリズムと分析手法を使用して、市場の動きを正確に予測します。
この場合、効果的な人工知能です。 - ユーザーフレンドリーなインターフェース:直感的なインターフェースにより

Classic Support & Resistance MT5(クラシック・サポート&レジスタンス MT5版) サポートラインやレジスタンスラインを手動で描画するのにうんざりしていませんか? Classic Support & Resistanceインジケーターを使用すれば、時間を節約し、自信を持ってトレードできるようになります。このツールは、MT5チャート上に主要なサポート&レジスタンスゾーンを高い精度とクリーンなビジュアルで自動的にプロットします。 ブレイクアウト・リテスト(Breakout – Retest Entry)エントリー戦略や市場構造分析に依存するトレーダー向けに特別に設計されています。 主な特徴: 自動サポート&レジスタンスゾーン: 主要なサポートおよびレジスタンスゾーンを自動的に特定してプロットするため、手動での描画は不要です。 カスタマイズ可能な表示: サポートゾーンとレジスタンスゾーンに独自の色を設定してチャートをパーソナライズできます(例:レジスタンスにはLavenderBlush、サポートにはSky Blue)。 マルチタイムフレーム対応: 市場のノイズを

Ultimate Silver Bullet and Killzone ICT Indicator(究極のシルバーバレット&キルゾーン ICT インジケーター) 時間と価格をマスターするための完璧なツールをお探しのインナー・サークル・トレーダー(ICT)やスマートマネーコンセプト(SMC)愛好家ですか? シルバーバレット(Silver Bullet)戦略 は、 ICT手法 における最も強力で直感的かつ非常に効果的な公式ルールの1つです。このインジケーターは、毎日の市場分析を自動化し、これらの特定的高確率な取引ウィンドウを活用するために必要な、まさにそのチャートツールです。 金融市場で 一貫した利益 を達成するために、トレーダーは市場のナラティブ(文脈)がどのように動くか、そしてさらに重要なことに、市場にエントリーする正確な時間を深く理解しなければなりません。シルバーバレット・セットアップは、毎日の取引日の非常に特定の時間に発生します。このインジケーターを使用してディープバックテストを行うことで、機関投資家の足跡を特定し、正確に執行し、非常に収益性の高いトレードルーティンを構築する方法を

HTF Candle Plus Timer(HTF キャンドル・プラス・タイマー) HTF Candle Plus Timerでトレーディング体験をアップグレードしましょう。これは、上位足(HTF)のローソク足を現在のチャート上に直接表示するスマートなインジケーターです。好みの時間足に集中しながら、より大きな市場の全体像と常に同調し続けることができます。 主な特徴: 上位足のローソク足: H1、H4、D1、W1、MNなどのカスタム上位足(HTF)のローソク足を下位足チャート上に直接プロットし、よりクリアな市場の全体像を把握できます。 現在のローソク足タイマー: ライブカウントダウンタイマーにより、上位足のローソク足が閉じるまでの残り時間が表示され、正確なタイミングとより良い意思決定が可能になります。 インタラクティブなチャートボタン: 内蔵されたチャートボタンを使用して上位足を瞬時に切り替え可能 — 複数のチャートを開く必要はありません。 ホットキーショートカット: 便利なホットキーを使用して、各機能(ローソク足、タイマー、ボタン)のオン/オフを切り替え、よりスムーズなワークフローを実
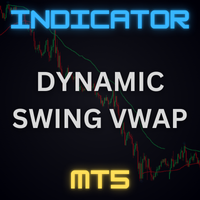
Dynamic Swing Anchored VWAP は、リアルタイムの市場状況に対応する精密な価格–出来高ツールです。従来のセッションが進むにつれ乖離する固定 VWAP とは異なり、このインジケーターは新しいスイング高値と安値にアンカーし、ボラティリティに応じて反応速度を調整します。 結果 → 価格により密接に追従する公正価値ラインを提供し、押し目やリテスト、平均回帰の機会を捉えやすくします。 主な特徴
スイングアンカリング
選択したスイング期間に基づき高値安値を検出し、新しいピボットが確定すると VWAP を再設定。 アダプティブ VWAP エンジン
減衰モデルで計算:最近のデータに重みを置き、古いデータは徐々に無視。APT 設定で調整。
ATR 比率による自動適応で、急変時は加速、静穏時は減速。 ボラティリティ対応
高ボラティリティ → VWAP が価格に接近。
低ボラティリティ → VWAP がスムーズに推移しノイズを除去。 従来 VWAP との違い
クラシック VWAP は時間経過で乖離。
Dynamic Swing Anchored VWAP はピボ
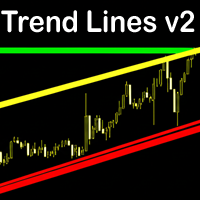
Trend Lines v2 MT5 is an intelligent auto trendline indicator that instantly detects key dynamic support and resistance zones. Built on pivot high/low structure, it delivers a clear and accurate view of market trends across all timeframes. Features Fully automatic trendline drawing based on precise pivot points. Filters out noise – only clean and reliable trendlines are shown. Control the number of lines to keep your chart neat and easy to read. Flexible customization: colors, line thickness, ra
FREE

プロフェッショナルな累積デルタ&ボリューム中央値インジケータ
この強力なボリューム分析ツールを使用して、 実際の売買圧力 を追跡します。 ボリューム比較インジケーター (Volume Compare Indicator) は、 累積デルタ (Cumulative Delta) と ボリューム中央値 (Volume Medians) を組み合わせて、 機関投資家の活動、 不均衡、 および潜在的な反転を特定するのに役立ちます。 主な特徴: 累積デルタヒストグラム – リアルタイムで純粋な買いボリュームと売りボリュームを視覚化します。 売買ボリューム中央値 – 平均的な買いボリュームと売りボリュームのレベルを示す水平線。 スマートなボリューム分類 – 以下を区別します: 強い買い(緑) – 強気(ブル)の圧力。 強い売り(赤) – 弱気(ベア)の圧力。 買いボリューム中央値(青線) – 標準的な買いボリュームの基準。 売りボリューム中央値(オレンジ線) – 標準的な売りボリュームの基準。 カスタマイズ可能なパラメーター – 感度に合わせて CDIPeriod と CDIRang

ダイナミックな CMF 計算: チャイキン・マネー・フロー (Chaikin Money Flow, CMF) の期間をカスタマイズすることで、分析を微調整し、シグナルの精度を最大限に高めます。 直感的な色分けアラート: 明確な視覚的合図により、市場の状況を即座に解釈できます。 緑色アラート: 買われすぎ ゾーンを示し、潜在的な売り機会を示唆します。 赤色アラート: 売られすぎ ゾーンを示し、潜在的な買い機会を示唆します。 灰色アラート: 中立 ゾーンを表し、確認されたトレンドまたは反転を待つべきシグナルです。 自動ダイバージェンス検出: 市場の隠れた転換点を容易に発見します。当社のシステムは、価格とモメンタム間の ダイバージェンスを自動的に検出 し、重要な反転を予測するのに役立ちます。 リアルボリューム統合: リアルボリュームオプション に切り替えることでシグナルの精度を高め、最も信頼性の高い市場データに基づいて取引を決定できるようにします。
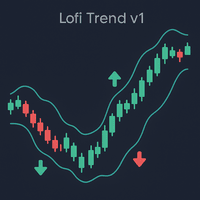
Lofi Trend v1で、クリアで信頼できるトレンド転換をいち早くキャッチ。リペイントなしのパワフル指標で、マーケットを制する!
Lofi Trend v1 – リペイントしないボリンジャーバンドトレンドインジケーター Lofi Trend v1で、トレンド分析とシグナル取得を次のレベルへ。プロ仕様の安心設計・EA連携も簡単です。 全ての時間足で使用OK スキャルピングM1、デイトレM15、スイングH4や日足でも。Lofi Trend v1はどんなタイムフレームでも正確なシグナルを提供します。 完全ノンリペイントシグナル すべての矢印とトレンドラインはローソク足の終値時のみ出現。履歴もリアルタイムも、常に正確そのもの。 高度なノイズ除去 ATRや最適化ボリンジャーバンドを組み合わせ、市場の雑音やフェイクシグナルを徹底排除。トレードの質を高めます。 直感的なトレンドライン&矢印 カラフルなラインとわかりやすい売買矢印。チャンスの到来がすぐに分かります。 EA連携用バッファ搭載 買い矢印(バッファ4)、売り矢印(バッファ5)はすべてバッファ出力対応。iCustomですぐにEAへ連

Ultimate Boom and Crash Indicator
The Ultimate Boom and Crash Indicator is a cutting-edge tool developed by Coetsee Digital , designed to identify potential spike opportunities in the market. Crafted for traders focusing on Deriv and Weltrade synthetic markets, this indicator is optimized to operate exclusively on the 3-minute (M3), 5-minute (M5), 15-minute (M15), 30-minute (M30), and 1-hour (H1) timeframes and supports only the following pairs: PainX 1200, PainX 999, PainX 800, PainX 600, Pai
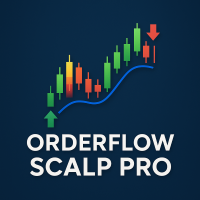
Orderflow Scalp Pro v2.4 delivers institutional-grade trading intelligence through advanced volume analysis, dynamic VWAP calculations, real-time aggressive score monitoring, and precision arrow signals. This complete trading system transforms complex market data into clear, actionable signals for consistent profitability on 3-4 minute timeframes.
Full Documentation: [Download PDF] Four Powerful Components in One System Volume Profile HeatMap with POC/VAH/VAL Transform your charts into inst
Screens realtime- https://t.me/ +rEuJQo8zHLllMzgy in Signals.Metals.etc
VI Calculator is a professional MetaTrader 5 indicator that analyzing volume at the moment. This synergy allows traders to evaluate both the strength of market movements and overbought/oversold conditions at the same time. The indicator automatically processes market data and provides clear trading signals directly on the chart in the form of arrows and text recommendations. It is ideal for identifying entry and exit p
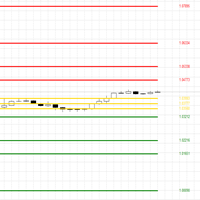
The CPR (Central Pivot Range) Indicator is a powerful technical analysis tool designed to identify key support and resistance levels on your MetaTrader 5 charts. It calculates the Central Pivot (CP) as the average of the previous day's high, low, and close prices, providing a central reference point. Calculates and plots 11 pivot levels (CP, BC, TC, S1-S4, R1-R4) Adjustable lookback period (default: 5 days) Option to show or hide price labels with customizable size and offset Fully customizable
FREE
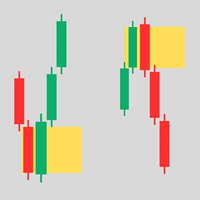
OBs & BBs Indicator for MT5 – Smart Supply & Demand Mapping Turn raw price action into a clear trading map with the OBs & BBs indicator!
This tool automatically detects and draws Order Blocks (OBs) and transforms them into Breaker Blocks (BBs) when invalidated — giving you a crystal-clear view of market structure and institutional footprints. Key Advantages Automatic OB & BB Detection No more manual drawing — the indicator marks valid bullish & bearish Order Blocks and updates them in re
The "Breakout Finder" is a technical indicator designed to automatically identify potential price breakouts and breakdowns on a chart. The highlight of this indicator is its robust signal filtering system, which helps traders avoid false signals (fakeouts) and focus on higher-probability trading opportunities. Key Features Automatic Pivot Point Detection: The indicator automatically identifies significant pivot highs and lows on the chart to establish potential support and resistance levels. Bre
FREE

Introducing the Professional Arka STM Signal Indicator
With Arka Candle Close Time – 100% Free Version Fast, Accurate, and Unmatched in Identifying Trading Opportunities
This indicator is the result of combining advanced price action analysis with specialized market algorithms, delivering clear, timely, and profitable signals. Completely Free – No Installation or Usage Limits
️ An automated trading bot, fully synchronized with it, is also ready to run. The Power of ARKA STM Signa
FREE
MetaTraderプラットフォームのためのアプリのストアであるMetaTraderアプリストアで自動売買ロボットを購入する方法をご覧ください。
MQL5.community支払いシステムでは、PayPalや銀行カードおよび人気の支払いシステムを通してトランザクションをすることができます。ご満足いただけるように購入前に自動売買ロボットをテストすることを強くお勧めします。

取引の機会を逃しています。
- 無料取引アプリ
- 8千を超えるシグナルをコピー
- 金融ニュースで金融マーケットを探索