STM Signal MT5

5

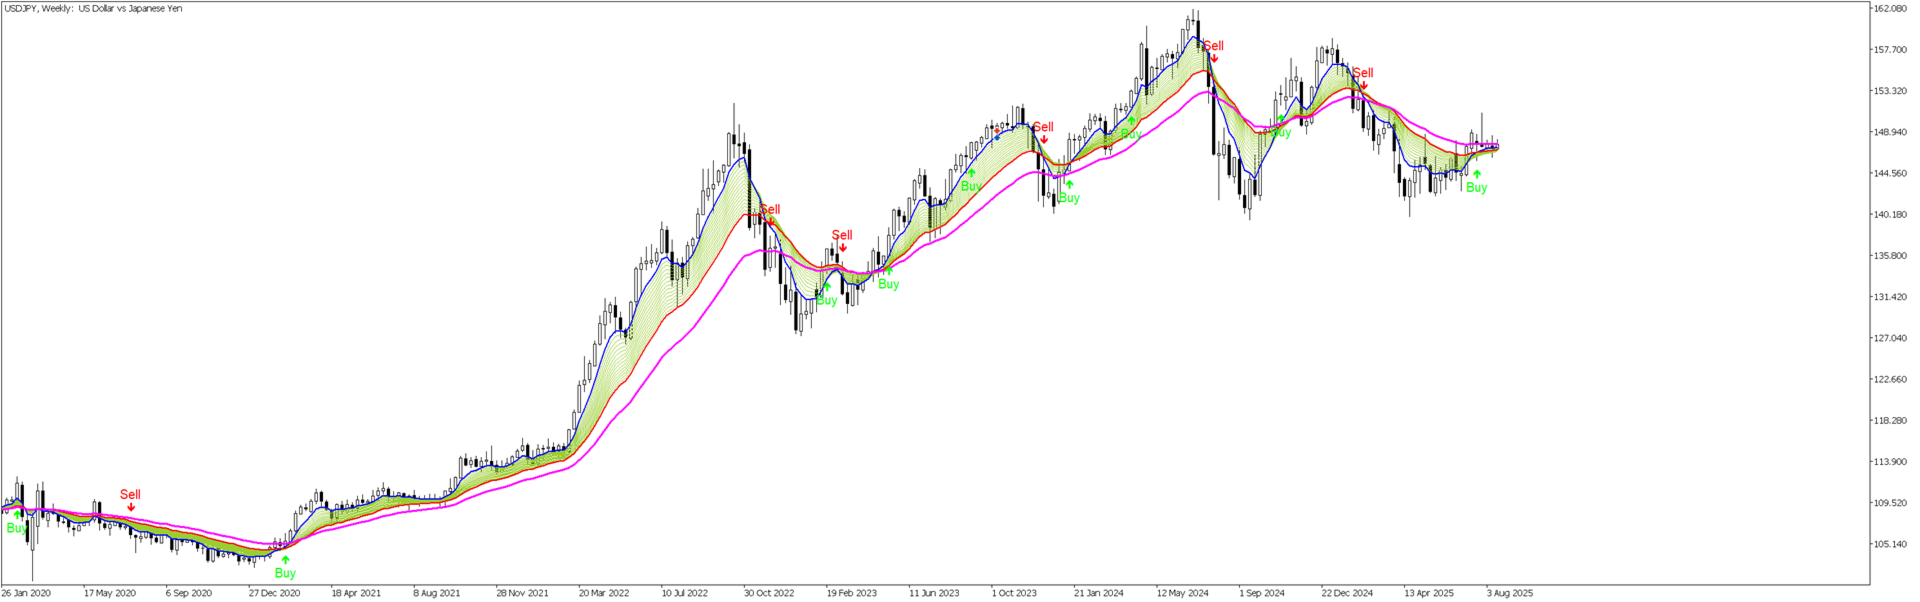
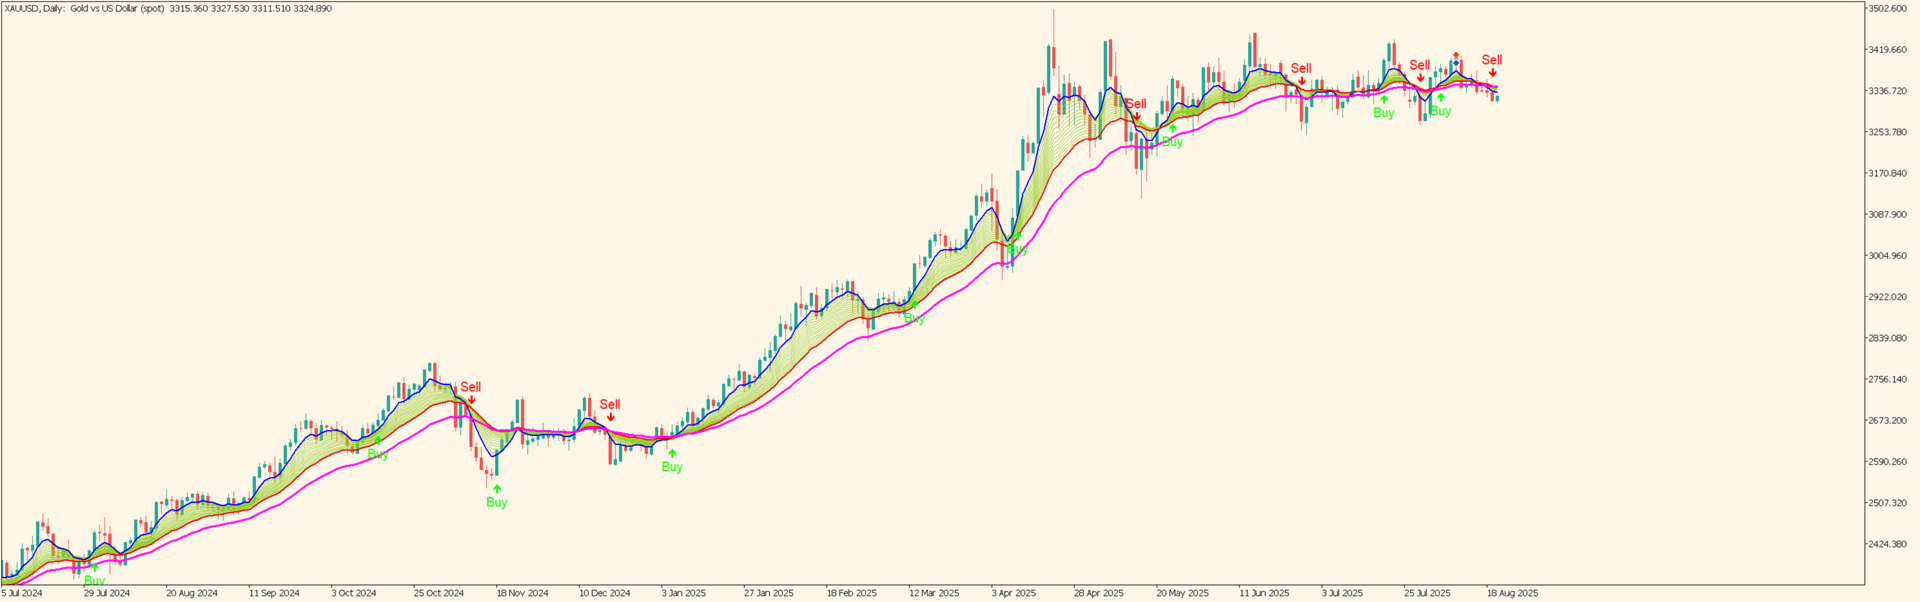
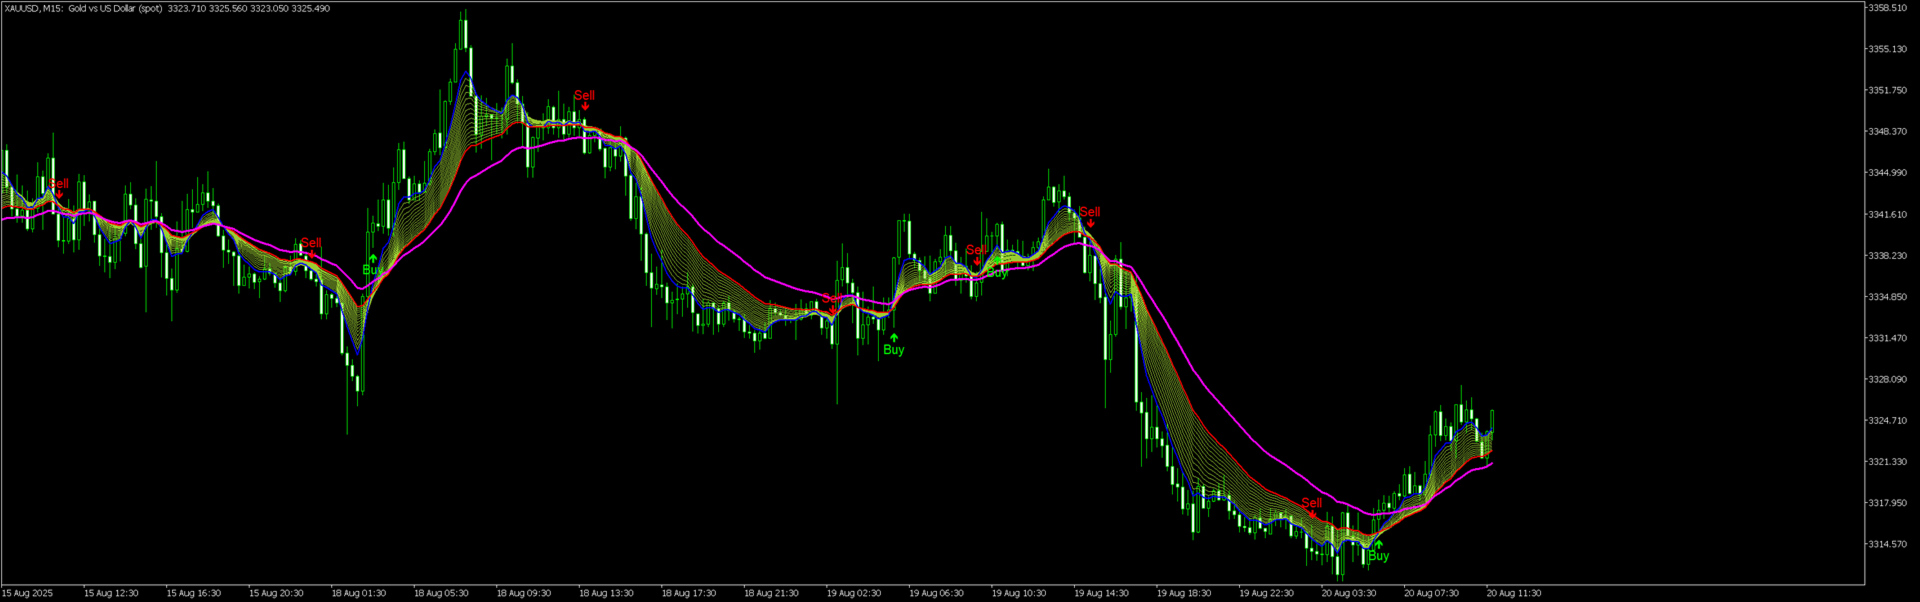
📌 Introducing the Professional Arka STM Signal Indicator
With Arka Candle Close Time – 100% Free Version

🔥 Fast, Accurate, and Unmatched in Identifying Trading Opportunities
This indicator is the result of combining advanced price action analysis with specialized market algorithms, delivering clear, timely, and profitable signals.

💎 Completely Free – No Installation or Usage Limits
⚡️ An automated trading bot, fully synchronized with it, is also ready to run.

🚀 The Power of ARKA STM Signal at a Glance:

  • Fast and precise signals across all symbols and timeframes

  • Exceptional performance on Gold – 1-minute timeframe

  • Capable of generating 50 to 100 fast scalp trades daily

  • High win rate for maximum profitability

  • Displays the exact candle closing time with Arka Candle Close Time

  • Perfect for scalpers, short-term traders, and algorithmic trading

🎯 Competitive Advantages:
✅ Speed that captures opportunities before they disappear
✅ Accuracy that removes guesswork from your trades
✅ Clear, unambiguous signals – ready to execute
✅ Synergy with the automated bot for 24/7 trading execution

💡 The Result: If you seek speed, accuracy, and consistent profitability, ARKA STM Signal is the missing piece in your trading puzzle.


レビュー 1
drw122
107
drw122 2025.08.22 12:13 
 

спасибо отличный индикатор

おすすめのプロダクト
RSI abcd
Francisco Gomes Da Silva
4.33 (3)
RSI ABCDパターンファインダー:テクニカル戦略 1. インジケーターの仕組み 古典的RSI と ABCD調和パターン の自動検出を組み合わせたものです。 主要コンポーネント 標準RSI (調整可能な期間) 高値・安値マーカー (矢印) ABCDパターン (緑/赤の線) 過買(70)・過売(30)フィルター 2. MT5設定 period = 14 ; // RSI期間 size = 4 ; // 最大パターンサイズ OverBought = 70 ; // 過買水準 OverSold = 30 ; // 過売水準 Filter = USE_FILTER_ YES ; // 確認フィルター 3. 取引戦略 3.1. 買いエントリー(強気ABCD) 条件: RSIが以下を形成: 谷( A )→ 山( B )→ より高い谷( C ) D が過売域(30)より上だが C より下 確認:A-B-C-Dを結ぶ緑色の線 目標: TP1: B-Cの61.8% TP2: B-Cの100% ストップロス: D より下 3.2. 売りエントリー(弱気ABCD) 条件: RSIが以下を形成: 山( A
FREE
Follow The Line MT5
Oliver Gideon Amofa Appiah
4.6 (35)
This indicator obeys the popular maxim that: "THE TREND IS YOUR FRIEND" It paints a GREEN line for BUY and also paints a RED line for SELL. (you can change the colors). It gives alarms and alerts of all kinds. IT DOES NOT REPAINT and can be used for all currency pairs and timeframes. Yes, as easy and simple as that. Even a newbie can use it to make great and reliable trades. NB: For best results, get my other premium indicators for more powerful and reliable signals. Get them here: https://www.m
FREE
The Penta-O is a 6-point retracement harmonacci pattern which usually precedes big market movements. Penta-O patterns can expand and repaint quite a bit. To make things easier this indicator implements a twist: it waits for a donchian breakout in the right direction before signaling the trade. The end result is an otherwise repainting indicator with a very reliable trading signal. The donchian breakout period is entered as an input. [ Installation Guide | Update Guide | Troubleshooting | FAQ | A
FREE
Necessary for traders: tools and indicators Waves automatically calculate indicators, channel trend trading Perfect trend-wave automatic calculation channel calculation , MT4 Perfect trend-wave automatic calculation channel calculation , MT5 Local Trading copying Easy And Fast Copy , MT4 Easy And Fast Copy , MT5 Local Trading copying For DEMO Easy And Fast Copy , MT4 DEMO Easy And Fast Copy , MT5 DEMO The homeopathic indicator is also called the CCI indicator. The CCI indicator was proposed
FREE
MACD Enhanced
Nikita Berdnikov
5 (3)
Introducing the MACD  Enhanced – an advanced MACD (Moving Average Convergence Divergence) indicator that provides traders with extended capabilities for trend and momentum analysis in financial markets. The indicator uses the difference between the fast and slow exponential moving averages to determine momentum, direction, and strength of the trend, creating clear visual signals for potential entry and exit points. Attention! To achieve the best results, it is recommended to adapt the indicator
FREE
Free automatic Fibonacci is an indicator that automatically plots a Fibonacci retracement based on the number of bars you select on the BarsToScan setting in the indicator. The Fibonacci is automatically updated in real time as new highest and lowest values appears amongst the selected bars. You can select which level values to be displayed in the indicator settings. You can also select the color of the levels thus enabling the trader to be able to attach the indicator several times with differe
FREE
Indicator Description 4 Hull MA Color + Envelopes is a powerful trend-following indicator for MetaTrader 5 that combines four Hull Moving Averages (HMA) with Moving Average Envelopes to clearly identify market direction, trend strength, and potential reversal or pullback zones. This indicator is designed to reduce noise, react quickly to price movement, and provide a clean visual structure for professional trading.   Key Features   4 Hull Moving Averages (20, 50, 100, 200) Automatic color change
FREE
Reversal Oscillator — Advanced Momentum Shift Detector Reversal Oscillator is a free indicator designed to highlight price zones that are statistically outside their normal movement patterns, helping traders anticipate potential turning points before they occur. Unlike traditional oscillators that react mainly to overbought/oversold conditions, this indicator applies third derivative analysis (the "acceleration of the acceleration" of price) calculated using two independent methods within a n
FREE
OmniSignal Navigator – Smart Entries at Key Levels Trade Like a Professional  with this daily/weekly High-Low-Close indicator, designed for   scalping or intraday short term trading   and precision breakout trading. Suggested Timeframes to trade with: M5 |  DONT USE THE INDICATOR ON THE M1 TIMEFRAME!!! Why It Works   Perfect for Scalping/Intraday:   Targets key zones ( PDH/PDL/PDC & PWH/PWL/PWC ) on   M2, M3, M5, M15   timeframes. (Lower Timeframes = More Signals, Higher Timeframes = Le
FREE
Coral trend is   a trend-following indicator that is widely popular among FOREX traders . It is usually used as a confluence with other indicators. It uses combinations of moving averages with complex smoothing formulas! It has two configurable parameters: Coefficient   - smoothing ratio (*) Applied price Calculation: Coral = (-0.064) * B6 + 0.672 * B5 - 2.352 * B4 + 2.744 * B3
FREE
PROMETHEUS TECHNICAN VERSION Free | By THE SONS A gift from The Sons — no strings, no trial, no expiry. Every trader deserves access to professional-grade market intelligence. That belief is why Prometheus Technical Version exists, and why it costs nothing. Consider it our handshake to the trading community. What You're Getting This is not a simplified tool dressed up as a gift. Prometheus Technican Version is a fully built, institutional-quality technical analysis indicator running a dual-model
FREE
ATR Plus is an enhanced version of the classic ATR that shows not just volatility itself, but the directional energy of the market . The indicator converts ATR into a normalized oscillator (0–100), allowing you to clearly see: who dominates the market — buyers or sellers when a trend begins when a trend loses strength when the market shifts into a range where volatility reaches exhaustion zones ATR Plus is perfect for momentum, trend-following, breakout and volatility-based systems. How ATR Plus
FREE
Donchian Channel is an indicator created by Richard Donchian. It is formed by taking the highest high and the lowest low of the last specified period in candles. The area between high and low is the channel for the chosen period. Its configuration is simple. It is possible to have the average between the upper and lower lines, plus you have alerts when price hits one side. If you have any questions or find any bugs, please contact me. Enjoy!
FREE
The indicator is based on Robert Miner's methodology described in his book "High probability trading strategies" and displays signals along with momentum of 2 timeframes. A Stochastic oscillator is used as a momentum indicator. The settings speak for themselves period_1 is the current timeframe, 'current' period_2 is indicated - the senior timeframe is 4 or 5 times larger than the current one. For example, if the current one is 5 minutes, then the older one will be 20 minutes The rest of the s
FREE
This indicator finds Three Drives patterns. The Three Drives pattern is a 6-point reversal pattern characterised by a series of higher highs or lower lows that complete at a 127% or 161.8% Fibonacci extension. It signals that the market is exhausted and a reversal can happen. [ Installation Guide | Update Guide | Troubleshooting | FAQ | All Products  |  Get Help ] Customizable pattern sizes Customizable colors and sizes Customizable breakout periods Customizable 1-2-3 and 0-A-B ratios It impl
FREE
概要 このインジケーターは、クラシックな ドンチャンチャネル を強化したバージョンで、実践的なトレード機能を追加しています。 標準の3本線(上限、下限、中央線)に加え、 ブレイクアウト を検出し、チャート上に矢印で視覚的に表示します。また、チャートを見やすくするために、 現在のトレンド方向と逆側のラインのみを表示 します。 インジケーターの機能: 視覚的シグナル :ブレイクアウト時にカラフルな矢印を表示 自動通知 :ポップアップ、プッシュ通知、Eメール RSIフィルター :市場の相対的な強弱に基づいてシグナルを検証 カスタマイズ可能 :色、ラインの太さ、矢印コード、RSI閾値など 動作原理 ドンチャンチャネルは次のように計算します: 上限線 :直近N本のクローズ済みローソク足の最高値 下限線 :直近N本のクローズ済みローソク足の最安値 中央線 :最高値と最安値の平均値 上方ブレイクアウト は終値が上限線を超えたときに発生し、 下方ブレイクアウト は終値が下限線を下回ったときに発生します。 インジケーターは以下を行います: 3本のドンチャンラインを描画 方向転換後の最初のブレイクアウト
FREE
FlatBreakout MT5 (Free Version) Flat Range Detector and Breakout Panel for MT5 — GBPUSD Only FlatBreakout MT5   is the free version of the professional FlatBreakoutPro MT5 indicator, specially designed for flat (range) detection and breakout signals on the   GBPUSD   pair only. Perfect for traders who want to experience the unique fractal logic of FlatBreakout MT5 and test breakout signals on a live market without limitations. Who Is This Product For? For traders who prefer to trade breakout of
FREE
This is a free version of the indicator, the period between the vertical lines is always 30 bars. In the paid version the period can be set by user, so a configuration with many ThreePointsChannel indicators with different periods is possible. The principle of construction - on top of any number of bars set by the user, a channel is constructed with maximum and minimum lines so that the bars touch the maximum and minimum of the channel at exactly three points. The name of the indicator follows
FREE
Indicador IMI (Intraday Momentum Index) Descrição O Indicador IMI (Intraday Momentum Index) é uma poderosa ferramenta de análise técnica desenvolvida para identificar a força do momentum e potenciais reversões no mercado. Este indicador quantifica a relação entre ganhos e perdas durante um período específico, ajudando traders a avaliar a dinâmica atual do mercado. Características Oscila entre 0 e 100, facilitando a interpretação das condições de mercado Identifica com precisão áreas de sobrecomp
FREE
Are you tired of drawing trendlines every time you're analyzing charts? Or perhaps you would like more consistency in your technical analysis. Then this is for you. This indicator will draw trend lines automatically when dropped on a chart. How it works Works similar to standard deviation channel found on mt4 and mt5. It has 2 parameters: 1. Starting Bar 2. Number of bars for calculation The   starting bar   is the bar which drawing of the trend lines will begin, while the   number of bars for c
FREE
Multi-timeframe trend indicator based on the ADX / ADXWilder indicator with Fibonacci levels The indicator shows trend areas using ADX or ADXWilder indicator data from multiple timeframes. The impulse mode of the indicator allows you to catch the beginning of a trend, and several "Screens" with different timeframes allow you to filter out market noise. Fibonacci levels are added to the price chart, which have flexible settings. How the indicator works: if PDI is greater than NDI, then   it`s
FREE
Tabajara V5
Flavio Javier Jarabeck
4.83 (36)
Metatrader 5 version of the famous Andre Machado's Tabajara indicator. If you don't know Andre Machado's Technical Analysis work you don't need this indicator... For those who need it and for those several friend traders who asked this porting from other platforms, here it is... FEATURES 8-period Moving Average 20-period Moving Average 50-period Moving Average 200-period Moving Average Colored candles according to the inflexion of the 20-period MA SETTINGS You can change the Period of all MA's
FREE
Daily Support and Resistance Levels は、クラシックピボットポイント手法に基づき、日中取引用の重要な価格レベルを自動計算・表示するプロ仕様のインジケーターです。 主な機能: ピボットポイント(PP)の自動計算 3つのレジスタンスレベル(R1, R2, R3) 3つのサポートレベル(S1, S2, S3) 前日の高値/安値の表示 リアルタイム情報パネル 市場バイアス(強気/弱気)表示 近いレベルまでの距離表示 色と表示設定の完全カスタマイズ 毎日自動更新 全タイムフレーム対応 計算方法: 前日の高値、安値、終値に基づくクラシックピボットポイント。 トレード活用例: サポート/レジスタンス反発トレード ブレイクアウト戦略 レンジトレード 方向性バイアス判断 利確目標設定 使用方法: 任意のチャートに追加 レベルは自動計算 価格 > PP = 強気バイアス 価格 < PP = 弱気バイアス S1-S3 = サポートゾーン R1-R3 = レジスタンスゾーン 設定: ピボット/サポート/レジスタンス色 線幅/スタイル 価格ラベル表示ON/OFF 情報パネル表示
FREE
インディケータはチャート上にラウンドレベルを示します。 それらは、心理的、銀行的、または主要なプレーヤーレベルとも呼ばれます。 これらのレベルでは、強気と弱気の間に真の戦いがあり、多くの注文が蓄積され、ボラティリティの増加につながります。 インジケーターは、任意の楽器と時間枠に自動的に調整されます。 レベル80を突破してテストすると、購入します。レベル20を突破してテストすると、販売されます。ターゲットは00です。 注意。強力なサポートとレジスタンスレベルのため、価格は00レベルをわずかに下回る可能性があります。 入力パラメータ 。 Bars Count - 線の長さ 。 Show 00 Levels - 00レベルを表示するかしないか 。 Show 10, 90 Levels 。 Show 20, 80 Levels 。 Show 30, 70 Levels 。 Show 40, 60 Levels 。 Show 50 Levels 。 N Lines - チャートのレベル数を制限するパラメーター 。 Distance 00 Levels - レベル間の距離(自動または手動)
FREE
Value Chart Candlesticks
Flavio Javier Jarabeck
4.69 (13)
The idea of a Value Chart indicator was presented in the very good book I read back in 2020 , " Dynamic Trading Indicators: Winning with Value Charts and Price Action Profile ", from the authors Mark Helweg and David Stendahl. The idea is simple and the result is pure genius: Present candlestick Price analysis in a detrended way! HOW TO READ THIS INDICATOR Look for Overbought and Oversold levels. Of course, you will need to test the settings a lot to find the "correct" one for your approach. It
FREE
Bounce Zone MT5
Nguyen Thanh Cong
4.56 (9)
Introduction The Bounce Zone indicator is a cutting-edge non-repainting technical tool built to identify key areas on the price chart where market sentiment is likely to cause a significant price reversal. Using advanced algorithms and historical price data analysis, this indicator pinpoints potential bounce zones. Combined with other entry signal, this indicator can help forex traders place the best trades possible Signal A possible buy signal is generated when price is in the green zone an
FREE
Signal provider based on RSI Divergences from a higher timeframe. First 3 buffers export a signal. Timeframe for which divergences are detected is optional, see 'RSI divergences timeframe' parameter. The indicator uses different algorithms for divergences detection: 'Fast' algorithm is the simplest solution that works the fastest. 'Strict' algorithm filters out more noise but works slower than the previous one. 'Full' algorithm uses recursive functions and provides with lots of divergences
FREE
前バージョンのインジケーターの発展 ZigZag WaveSize MT4 ZigZag WaveSize - ポイント、レベル、および異なるアラートロジックに関する情報が追加された改良版標準ZigZagインジケーター 一般的な改善点: MetaTrader 5用のコード適応 グラフィックオブジェクトでの作業の最適化 新機能: 極値における水平レベル レベルタイプの選択:水平/光線/セグメント 流動性レベルフィルター(価格によるブレイクなし) ブレイク用バッファ:偽ブレイクに対する感度設定 ラベル設定と機能:数量、外観、古いラベルの削除 構造ブレイクアラート(BoS) 動きの性質変更アラート(ChoCH) 最適化: 極値更新ロジックの修正 新しいオブジェクトの動的更新 バー出現時の負荷低減 ラベルの中央管理システム 修正点: 配列の境界超えの修正 ラベルの正しい配置 重複するパラメーターの削除 ZigZag WaveSizeインジケーターをトレーディングシステムの補助として使用してください   マーケットで私の他の製品もお試しください  https://www.mql5.com/
FREE
Indicator and Expert Adviser  EA Available in the comments section of this product. Download with Indicator must have indicator installed for EA to work. Mt5 indicator alerts for bollinger band and envelope extremes occurring at the same time. Buy signal alerts occur when A bullish candle has formed below both the lower bollinger band and the lower envelope  Bar must open and close below both these indicators. Sell signal occur when A bear bar is formed above the upper bollinger band and upper
FREE
Donchian Pro
Paulo Henrique Faquineli Garcia
4.75 (4)
The Donchian Channel Channels are among the most popular tools of technical analysis, as they visually convey to the analyst the limits within which most price movement tends to occur. Channel users know that valuable information can be obtained at any time, whether prices are in the central region of a band or close to one of the border lines. One of the best known techniques to explore these concepts is Bollinger Bands. However, John Bollinger was not the only one to research the application
FREE
このプロダクトを購入した人は以下も購入しています
ARIPoint is a powerful trading companion designed to generate high-probability entry signals with dynamic TP/SL/DP levels based on volatility. Built-in performance tracking shows win/loss stats, PP1/PP2 hits, and success rates all updated live. Key Features: Buy/Sell signals with adaptive volatility bands Real-time TP/SL/DP levels based on ATR Built-in MA Filter with optional ATR/StdDev volatility Performance stats panel (Success, Profit/Loss, PP1/PP2) Alerts via popup, sound, push, or email Cu
SuperScalp Pro
Van Minh Nguyen
4.59 (22)
SuperScalp Pro – 高度なマルチフィルタースキャルピングインジケーターシステム SuperScalp Pro は、クラシックな Supertrend と複数のインテリジェント確認フィルターを組み合わせた高度なスキャルピングインジケーターです。M1 から H4 まで複数の時間足で効率的に動作し、XAUUSD、BTCUSD、主要 Forex 通貨ペア向けに最適化されています。 このインジケーターは明確な Buy / Sell シグナルを提供し、ATR に基づいてエントリー価格、Stop Loss、Take Profit を自動計算します。Fibonacci Take Profit 機能により、重要な価格帯で早期決済し、到達時に通知を送信します。 初期設定では Fibonacci Take Profit が有効化されており、より安定した取引体験を重視しています。チャートに適用するだけですぐ利用可能です。上級者向けに、すべてのパラメータは自由にカスタマイズできます。 EMA、RSI、ADX、Volume、VWAP、Bollinger Bands、MACD Divergence な
Entry In The Zone and SMC Multi Timeframe is a real-time 2-in-1 market analysis tool that combines market structure analysis and a No Repaint BUY / SELL signal system into a single indicator, built on Smart Money Concepts (SMC) — a widely adopted framework used by professional traders to understand market structure. This indicator helps you see the market more clearly, make decisions based on structure rather than guesswork, and focus on high-probability zones where price is more likely to react
このインジケーターを購入された方には、以下の特典を 無料 で提供しています: 各トレードを自動で管理し、ストップロスとテイクプロフィットを設定し、戦略ルールに基づいてポジションを決済する補助ツール 「Bomber Utility」 様々な銘柄に合わせたインジケーターの設定ファイル(セットファイル) 「最小リスク」、「バランスリスク」、「待機戦略」 の3つのモードで使用できる Bomber Utility 用の設定ファイル このトレーディング戦略をすぐに導入・設定・開始できる ステップバイステップのビデオマニュアル ご注意: 上記の特典を受け取るには、MQL5のプライベートメッセージシステムを通じて販売者にご連絡ください。 オリジナルのカスタムインジケーター 「Divergence Bomber(ダイバージェンス・ボンバー)」 をご紹介します。これは、MACDのダイバージェンス(乖離)戦略に基づいた 「オールインワン」型のトレーディングシステム です。 このテクニカルインジケーターの主な目的は、価格とMACDインジケーターの間に発生するダイバージェンスを検出 し、将来の価格の動きを示す
Power Candles V3 - 自己最適化型強弱インジケーター Power Candles V3は 、通貨や銘柄の強さを、適用されたすべてのチャート上で実行可能なトレードプランに変換します。単にローソク足を色分けするだけでなく、バックグラウンドでリアルタイムの自動最適化を実行し、目の前の銘柄に対して最適なストップロス、テイクプロフィット、およびシグナルの閾値を提示します。ワンクリックで実取引に適用でき、エントリーポイント、ストップロス、テイクプロフィットのラインが正確な価格位置にチャート上に表示され、方向性を示すアラートがリアルタイムで発動します。 このツールは、Stein Investmentsのエコシステムの一部です。  18種類以上のツールをすべて閲覧し、AIを活用したセットアップの推奨事項を入手し、  https://stein.investments でコミュニティに参加しましょう クローズしたバーごとに3,000回以上のトレードシミュレーション。9つの強さの状態。2つの戦略を並行してテスト。勝率の高い設定をワンクリックで適用。 なぜこれが必要なのか ほとんどの強
Gold Entry Sniper – ゴールドスキャルピング&スイングトレード用プロフェッショナル多時間足ATRダッシュボード Gold Entry Sniper は、XAUUSDや他の銘柄向けに正確な 売買シグナル を提供する、MetaTrader 5用の高度なインジケーターです。 ATRトレーリングストップロジック と 多時間足分析ダッシュボード を搭載し、スキャルピングからスイングトレードまで対応します。 主な特徴と利点 多時間足シグナル分析 – M1、M5、M15 のトレンドを同時表示。 ATRベースのトレーリングストップ – ボラティリティに応じて動的に調整。 プロ仕様のチャートダッシュボード – シグナル状況、ATRレベル、回帰線、売買方向を表示。 明確な売買マーカー – 自動矢印とテキストラベル。 エグジットアラートとトレード管理 – 利益確定のための自動検出。 完全カスタマイズ可能 – パネル位置、色、フォント、ATR/回帰設定を調整可能。 ゴールド(XAUUSD)に最適化 – M1〜M15のスキャルピングに最適、FXや指数、暗号資産にも対応。 Gold Entry
優れたテクニカルインジケーター「Grabber」をご紹介します。これは、すぐに使える「オールインワン」トレーディング戦略として機能します。 ひとつのコードに、市場のテクニカル分析ツール、取引シグナル(矢印)、アラート機能、プッシュ通知が強力に統合されています。 このインジケーターを購入された方には、以下の特典を無料で提供します: Grabberユーティリティ:オープンポジションを自動で管理するツール ステップバイステップのビデオマニュアル:インジケーターのインストール、設定、取引方法を解説 カスタムセットファイル:インジケーターをすばやく自動設定し、最大限の成果を出すための設定ファイル 他の戦略はもう忘れてください!Grabberだけが、あなたを新たなトレードの高みへと導いてくれるのです。 Grabber戦略の主な特徴: 推奨タイムフレーム:M5〜H4 対応通貨ペア・資産:どれでも使用可能ですが、私が実際に検証した以下を推奨します(GBPUSD、GBPCAD、GBPCHF、AUDCAD、AUDUSD、AUDSGD、AUDCHF、NZDUSD、NZDCAD、EURCAD、EURUSD、E
SignalTech MT5 is a trading system for EURUSD, USDCHF, USDJPY, AUDUSD, NZDUSD, EURJPY, AUDJPY, NZDJPY, CADJPY H2 and H3 Timeframe.  It can generate signals with Buy/Sell Arrows and Pop-Up/Sound Alerts. Each signal has clear Entry and Stop Loss levels, which should be automatically flagged on the chart, as well as potential Targets 1, 2, and 3. The Entry and TP levels are fixed after the trade is taken. The exit level is dynamic. If there are signs of a potential short-term trend reversal, the
このインジケーターを購入すると、プロ仕様のトレードマネージャーを無料で差し上げます。 まず第一に、このトレーディングシステムがノンリペイント、ノンリドロー、ノンラグのインジケーターであることを強調する価値がある。これにより、手動取引とロボット取引の両方に理想的なものになっています。 オンラインコース、マニュアル、プリセットのダウンロード。 「スマートトレンドトレーディングシステム MT5」は、新規および経験豊富なトレーダー向けにカスタマイズされた包括的なトレーディングソリューションです。10以上のプレミアムインジケーターを組み合わせ、7つ以上の堅実なトレーディング戦略を備えており、多様な市場状況に対応する多目的な選択肢となっています。 トレンドフォロー戦略:トレンドを効果的に乗り越えるための正確なエントリーとストップロス管理を提供します。 リバーサル戦略:潜在的なトレンドの反転を特定し、トレーダーがレンジ相場を活用できるようにします。 スキャルピング戦略:高速で正確なデイトレードおよび短期取引のために設計されています。 安定性:すべてのインジケーターはノンリペイント、ノンリドロー、ノ
Gann Made Easy   は、ミスター・ギャンの理論を使用した取引の最良の原則に基づいた、プロフェッショナルで使いやすい外国為替取引システムです。 W・D・ガン。このインジケーターは、ストップロスとテイクプロフィットレベルを含む正確な買いと売りのシグナルを提供します。 PUSH通知を利用して外出先でも取引可能です。 ご購入後、取引方法の説明と優れた追加インジケーターを無料で入手するには、私にご連絡ください! おそらく、ギャンの取引手法についてはすでに何度も聞いたことがあるでしょう。通常、ギャンの理論は初心者のトレーダーだけでなく、すでにある程度の取引経験がある人にとっても非常に複雑なものです。なぜなら、ギャンの取引手法は理論的にはそれほど簡単に適用できるものではないからです。私はその知識を磨き、最良の原則を私の外国為替インジケーターに組み込むために数年を費やしました。 このインジケーターは非常に簡単に適用できます。必要なのは、それをチャートに添付し、簡単な取引推奨事項に従うだけです。このインジケーターは常に市場分析の仕事を行い、取引の機会を探します。適切なエントリーポイントを検
BTMM State Engine Pro is a MetaTrader 5 indicator for traders who use the Beat The Market Maker approach: Asian session context, kill zone timing, level progression, peak formation detection, and a multi-pair scanner from a single chart. It combines cycle state logic with a built-in scanner dashboard so you do not need the same tool on many charts at once. What it does Draws the Asian session range; session times can follow broker server offset or be set in inputs. Tracks level progression (L
FX Trend NG:次世代マルチマーケット・トレンドインテリジェンス 概要 FX Trend NG は、複数の時間足に対応したプロフェッショナル向けトレンド分析およびマーケット監視ツールです。 市場全体の構造を数秒で把握することができます。 複数のチャートを切り替える必要はありません。どの銘柄がトレンド中なのか、どこでモメンタムが弱まっているのか、そしてどの時間足で強い整合性があるのかを瞬時に確認できます。 ローンチ特別オファー – FX Trend NG を $30(6ヶ月) または $80 永久ライセンス でご利用いただけます。 すでに Stein Investments のユーザーですか? -> メッセージを送信 して、プライベートグループへアクセスしてください。 セットアップや詳細情報が必要ですか? -> Stein Investments 公式ページ をご覧ください。 1. FX Trend NG が他と異なる理由 3ステート・トレンドロジック ― Buy と Sell だけではない • 多くのインジケーターは Buy または Sell の2状態のみを表示します。
ご紹介     Quantum Breakout PRO は 、ブレイクアウト ゾーンの取引方法を変革する画期的な MQL5 インジケーターです。 13年以上の取引経験を持つ経験豊富なトレーダーのチームによって開発されました。     クォンタム ブレイクアウト プロ   は、革新的でダイナミックなブレイクアウト ゾーン戦略により、あなたのトレーディングの旅を新たな高みに押し上げるように設計されています。 クォンタム ブレイクアウト インジケーターは、5 つの利益ターゲット ゾーンを備えたブレイクアウト ゾーン上のシグナル矢印と、ブレイクアウト ボックスに基づいたストップロスの提案を提供します。 初心者トレーダーにもプロのトレーダーにも適しています。 量子EAチャネル:       ここをクリック 重要!購入後、インストールマニュアルを受け取るためにプライベートメッセージを送ってください。 推奨事項: 時間枠: M15 通貨ペア: GBPJPY、EURJPY、USDJPY、NZDUSD、XAUUSD アカウントの種類: ECN、Raw、またはスプレッドが非常に低い R
Quantum TrendPulse を ご紹介します。これは、   SuperTrend   、   RSI   、および Stochastic のパワーを 1 つの包括的なインジケーターに組み合わせて、取引の可能性を最大限に引き出す究極の取引ツールです。精度と効率を求めるトレーダー向けに設計されたこのインジケーターは、市場のトレンド、勢いの変化、最適なエントリー ポイントとエグジット ポイントを自信を持って特定するのに役立ちます。 主な特徴: SuperTrend 統合: 現在の市場動向に簡単に追従し、収益性の波に乗ることができます。 RSI精度: 買われすぎと売られすぎのレベルを検出し、市場の反転のタイミングに最適で、SuperTrendのフィルターとして使用されます。 確率的精度: 確率的振動を活用して、変動の激しい市場で隠れたチャンスを見つけます。SuperTrend のフィルターとして使用されます。 マルチタイムフレーム分析:   M5 から H1 または H4 まで、さまざまなタイムフレームで市場を常に把握します。 カスタマイズ可能なアラート: カスタム取引条件が満たされ
これはMT5のインジケーターで、再描画なしで取引に参入するための正確なシグナルを提供します。 外国為替、暗号通貨、金属、株式、インデックスなど、あらゆる金融資産に適用できます。かなり正確な見積もりを提供し、取引を開始して終了するのに最適な時期を教えてくれます。1つのシグナルを処理しただけでインジケーターの元が取れた例の 動画 (6:22)をご覧ください。Entry PointsPro インジケーターの助けを借りたほとんどのトレーダーの最初の1週間の結果が改善しています。 Telegramグループ に登録してください。Entry Points Proインジケーターのメリットは次の通りです。 再描画のないエントリーシグナル 再描画されるインジケーターでは一度表示されたシグナルが削除されて大きな金銭的損失につながることがありますが、これと異なり、表示されて確認されたシグナルは消えることがありません。 エラーなしの取引開始 インジケーターアルゴリズムによって取引を開始する(資産を売買する)理想的な瞬間を見つけることができます。それを使用するすべてのトレーダーの成功率が向上します。 あら
まず第一に、この取引インジケーターは再描画されず、再描画されず、遅延しないことを強調する価値があります。これにより、手動取引とロボット取引の両方に理想的なものになります。 ユーザーマニュアル:設定、入力、戦略。 アトミックアナリストは、価格の強さとモメンタムを利用して市場でより良いエッジを見つけるためのPA価格アクションインジケーターです。ノイズや誤ったシグナルを除去し、取引ポテンシャルを高めるための高度なフィルターを備えています。複雑なインジケーターの複数のレイヤーを使用して、アトミックアナリストはチャートをスキャンし、複雑な数学的計算をシンプルなシグナルと色に変換します。これにより、どのような初心者トレーダーでも理解して使用し、一貫した取引の決定を行うことができます。 「アトミックアナリスト」は、新規および経験豊富なトレーダー向けにカスタマイズされた包括的な取引ソリューションです。プレミアムインジケーターとトップノッチの機能を1つの取引戦略に組み合わせ、すべてのタイプのトレーダーにとって汎用性のある選択肢にします。 デイリートレーディングとスキャルピング戦略:高速で正確なデイ
トレンド スクリーナー インジケーターでトレンド取引の力を解き放ちます。ファジー ロジックと複数通貨システムを活用した究極のトレンド取引ソリューションです。 ファジー ロジックを活用した革新的なトレンド インジケーターである Trend Screener を使用して、トレンド取引を向上させます。 これは、13 を超えるプレミアム ツールと機能、および 3 つの取引戦略を組み合わせた強力なトレンド追跡インジケーターであり、Metatrader をトレンド アナライザーにする多用途の選択肢となります。 期間限定オファー : トレンド スクリーナー インジケーターは、わずか 65 ドルで生涯ご利用いただけます。 (元の価格 50$ ) (オファー延長) Trend Screener の 100% 非再描画精度の揺るぎない精度を体験して、取引の決定が過去の価格変動の影響を受けないようにしてください。 マルチタイムフレームおよびマルチ通貨機能の多用途性を解放し、比類のない自信を持って外国為替、商品、暗号通貨、インデックスの世界を取引できるようにします。 Trend Screener の包括的な戦
OmniSync Projection
Antonio-alin Teculescu
5 (1)
Chronos Fractal Engine is an innovative price projection indicator for MetaTrader 5, designed to transform your technical analysis by intelligently identifying and projecting historical price patterns. Built upon an advanced correlation algorithm and the fractal principles of the market, this powerful tool visualizes potential future price movements, giving you a unique edge in your trading decisions. What is Chronos Fractal Engine? At its core, the Chronos Fractal Engine employs a sophisticat
このダッシュボードは、選択されたシンボルの最新の利用可能なハーモニックパターンを表示するので、時間を節約し、より効率的に /   MT4バージョン 。 無料インジケーター:   Basic Harmonic Pattern インジケーター列 Symbol : 選択したシンボルが表示されます。 Trend :   強気または弱気 Pattern : パターンの種類(ガートレー、バタフライ、バット、カニ、サメ、サイファー、ABCD) Entry : エントリー価格 SL: ストップロス価格 TP1: 1回目の利食い価格 TP2: 2回目の利食い価格 TP3:   3回目の利食い価格 Current price :   現在値 Age (in bars):    最後に描画されたパターンの年齢 主な入力項目 Symbols:   "28 Major Currency Pairs "または "Selected Symbols "から選択。 Selected Symbols:   カンマで区切られた監視したいシンボル("EURUSD,GBPUSD,XAUUSD")。ブローカーがペアに接
Azimuth Pro
Ottaviano De Cicco
5 (7)
Azimuth Pro V2:MT5向けシンセティック・フラクタル構造分析と確認済みエントリー 概要 Azimuth Pro は Merkava Labs によるマルチレベルスイング構造インジケーターです。4つのネストされたスイングレイヤー、スイングアンカーVWAP、ABCパターン検出、3タイムフレーム構造フィルタリング、そして確定バーでの確認済みエントリー — 1つのチャートで、ミクロスイングからマクロサイクルまでを網羅するワークフロー。 これはブラインドシグナル製品ではありません。ロケーション、コンテキスト、タイミングを重視するトレーダーのための構造ファーストワークフローです。 V2発売記念オファー — Azimuth Pro V2をUSD 399で(次の100本)。最終価格:USD 499。 1. V2での変更点 シンセティック・マルチタイムフレームエンジン 上位タイムフレーム分析をMeridian Proと同じ独自のシンセティックアーキテクチャで一から再構築。よりクリーンなHTFコンテキスト、安定したライブ動作、従来のMTF同期問題なし。シンセティックエンジンは 固定比率タ
FX Levels: あらゆる市場における非常に高精度なサポート&レジスタンス 概要 通貨ペア、株式指数、個別銘柄やコモディティなど、どのような市場でも信頼できるサポートとレジスタンスを特定したいですか? FX Levels は伝統的な “Lighthouse” メソッドと先進的な動的アプローチを融合し、ほぼ汎用的な精度を実現します。ブローカーの実務経験を活かし、自動化されたデイリー更新とリアルタイム更新を組み合わせることで、 FX Levels は反転ポイントを見つけ、利益目標を設定し、自信をもってトレードを管理するための手助けをします。今すぐ試してみて、サポート/レジスタンス分析の正確性がどれほどトレードを向上させるかを実感してください! 1. FX Levels がトレーダーにとって非常に有用な理由 非常に正確なサポート&レジスタンスゾーン • FX Levels は異なるブローカー環境でもほぼ同一のゾーンを生成するよう設計されており、データフィードの差異や時刻設定のずれによる不一致を解消します。 • つまり、どのブローカーを利用していても一貫したレベルが得られるため、戦
まず第一に、この取引ツールはノンリペイント、ノンリドロー、ノンラグの指標であり、プロの取引に理想的ですことを強調する価値があります。 オンラインコース、ユーザーマニュアル、デモ。 スマートプライスアクションコンセプトインジケーターは、新米から経験豊富なトレーダーまで、非常 に強力なツールです。Inner Circle Trader AnalysisやSmart Money Concepts Trading Strategiesなど、20以上の有用な指標を1つに組み合わせています。このインジケーターはスマートマネーコンセプトに焦点を当て、大手機関の取引方法を提供し、彼らの動きを予測するのに役立ちます。 特に、流動性分析に優れており、機関がどのように取引しているかを理解しやすくしています。市場のトレンドを予測し、価格の動きを慎重に分析するのに優れています。機関の戦略とトレードを合わせることで、市場の動向についてより正確な予測ができます。このインジケーターは多目的であり、市場構造を分析し、重要な注文ブロックを特定し、さまざまなパターンを認識するのに優れています。 このインジケーター
RelicusRoad Pro: 定量的市場オペレーティングシステム 【期間限定】無制限アクセス 70% OFF - 2,000人超のトレーダーと共に なぜ多くのトレーダーは「完璧な」インジケーターを使っても失敗するのでしょうか? それは、文脈を無視して 単一の概念 だけでトレードしているからです。文脈のないシグナルは単なるギャンブルです。勝ち続けるには、 根拠の重なり(コンフルエンス) が必要です。 RelicusRoad Proは単なる矢印インジケーターではありません。完全な 定量的市場エコシステム です。独自のボラティリティモデリングを用いて、価格が推移する「適正価値の道(Fair Value Road)」をマッピングし、ノイズと真の構造的ブレイクを判別します。 推測はやめましょう。機関投資家レベルの「ロード・ロジック」でトレードを。 コアエンジン:「Road」アルゴリズム システムの中心となる Road Algo は、市場環境にリアルタイムで適応するダイナミックなボラティリティチャネルです。 安全ライン(平衡点) と、価格が数学的に反転しやすい 拡張レベル を投影します。 Si
Trend Ai indicatorは、トレンドの識別と実用的なエントリポイントと反転アラートを組み合わせることで、トレーダーの市場分析を強化する優れたツールです。 この指標は、ユーザーが自信と正確さで外国為替市場の複雑さをナビゲートすることを可能にします トレンドAiインジケーターは、主要なシグナル以外にも、プルバックやリトレースメント中に発生するセカンダリエントリポイントを識別し、トレーダーが確立されたトレンド内の価格修正を活用できるようにします。 重要な利点: *MT4およびMT5の仕事 *明確な買いまたは売りシグナル *再描画しません ·すべての資産で動作します 私はeaやセットをtelegram it詐欺で販売しないように注意してください。 すべての設定はここでブログで無料です。  重要! 指示とボーナスを得るために購入後すぐに私に連絡してください! 私の他のプロダクトと同様、実質操作の監視はここに見つけることができます: https://www.mql5.com/en/users/mechanic/seller&nbsp ; 設定および入力: すべての
まず正直に言いましょう。 どんなインジケーターも、それ単体であなたを利益化させることはできません。もしそう言う人がいるなら、それは夢を売っているだけです。完璧な売買シグナル(矢印)を表示するインジケーターは、いくらでも“完璧に見せる”ことができます。正しい過去の区間を拡大して、勝ちトレードだけを切り取ればいいだけです。私たちはそれをしません。 SMC Intraday Formula はツールです。 市場構造を読み取り、最も高い確率の価格ゾーンを特定し、今この瞬間のスマートマネーの痕跡をシンプルな言葉で正確に示します。最終判断はあなたが行います。トレードを実行するのもあなたです。しかし今は「希望」ではなく「精度」でエントリーできます。 私たちはこのインジケーターを、ゴールド(XAUUSD)および主要FX通貨ペアで約3年間、日々のスキャルピングに使用してきました。M1、M5、M15、M30の主要ツールです。これは未来を予測しようとするのではなく、今まさに形成されている高確率セットアップを示し、その理由を説明します。 他のすべてのインジケーターと何が違うのか? ほとんどのトレーディングイ
Crystal Heikin Ashi Signals - Professional Trend & Signal Detection Indicator Advanced Heikin Ashi Visualization with Intelligent Signal System for Manual & Automated Trading Final Price: $149 ---------> Price goes up $10 after every 10 sales . Limited slots available — act fast . Overview Crystal Heikin Ashi Signals is a professional-grade MetaTrader 5 indicator that combines pure Heikin Ashi candle visualization with an advanced momentum-shift detection system. Designed for both manual traders
ARICoin is a powerful trading companion designed to generate high-probability entry signals with dynamic TP/SL/DP levels based on volatility. Built-in performance tracking shows win/loss stats, PP1/PP2 hits, and success rates all updated live. Key Features: Buy/Sell signals with adaptive volatility bands Real-time TP/SL/DP levels based on ATR Built-in MA Filter with optional ATR/StdDev volatility Performance stats panel (Success, Profit/Loss, PP1/PP2) Alerts via popup, sound, push, or email Cust
Market Structure Order Block Dashboard MT5 は、市場構造と主要な価格反応ゾーンをチャート上で直接読み取りたいトレーダー向けに設計された MT5 インジケーターです。BOS、ChoCH、オーダーブロック、Fair Value Gap (FVG)、流動性、Kill Zones、Volume Profile、そして素早い分析のためのコンパクトなダッシュボードを組み合わせています。 本インジケーターは、市場構造、ICT、Smart Money の概念を意思決定の枠組みとして使用するトレーダーを対象としています。トレンド継続、反転の可能性、価格の不均衡、流動性ターゲット、注目ゾーンをより構造的に特定する助けとなります。 購入者向けの付属リソース 購入後、MQL5 のプライベートメッセージにてご依頼いただくと、完全な PDF ユーザーガイドとパラメータ設定のヒントを提供いたします。MQL5 のプライベートメッセージによる直接的な技術サポート。 バージョン 1.20 では 2 つの重要な追加機能があります: Pending BOS / Pending Cho
Smart Stop Indicator – チャート上で実現するインテリジェントなストップロス精度 概要 Smart Stop Indicator は、ストップロスを勘や感情ではなく、明確で体系的に設定したいトレーダーのために設計されています。本ツールは、クラシックなプライスアクション(高値更新・安値切り下げ)と最新のブレイクアウト認識ロジックを組み合わせ、次に来るべき論理的なストップレベルを正確に特定します。トレンド相場、レンジ、急速なブレイクアウト局面のいずれであっても、最適な SL ゾーンとその状態(“new”、“broken”、“valid”)をチャート上に直接表示します。さらに今回、SL 距離の %ADR 表示も新たに追加されています。 主な特徴 マーケット構造に基づく自動ストップ配置 • 市場構造とリアルタイムの値動きに基づき、意味のあるストップロスレベルを自動検出します。 スマートなブレイクアウト感知 • 急激な方向転換やブレイクアウトにも柔軟に対応し、早すぎるストップ調整を避けます。 SL %ADR の表示 • ストップロスまでの距離を ADR(Averag
Meridian Pro
Ottaviano De Cicco
5 (1)
Meridian Pro:MT5用プロフェッショナル・マルチタイムフレーム・トレンドマトリックス 概要 Meridian Pro は Merkava Labs が開発したマルチタイムフレーム・トレンドマトリックスで、方向性の状態、強度、モメンタムの状況、マトリックスの合意をひとつのコンパクトなパネルに集約します。ひとつのアダプティブエンジンがM1からW1まで一貫して適用されます。シンボルごとの調整は不要。インジケーターの積み重ねも不要。すべてのアセットとすべてのタイムフレームをカバーするひとつの構造化された読み取りです。 発売キャンペーン — Meridian Proを USD 99 (導入価格)で入手。通常価格:USD 149 。 1. Meridian Proが他と異なる理由 ひとつのエンジン、バラバラなインジケーターのダッシュボードではない 多くのMTFダッシュボードは、タイムフレームごとに生のインジケーター値を繰り返すだけです。Meridian Proはマトリックス全体でひとつのアダプティブ・トレンドエンジンを使用するため、パネルの各行が同じ構造化フレームワークから導出されます
作者のその他のプロダクト
The Fisher Transform is a technical indicator created by John F. Ehlers that converts prices into a Gaussian normal distribution. The indicator highlights when prices have moved to an extreme, based on recent prices. This may help in spotting turning points in the price of an asset. It also helps show the trend and isolate the price waves within a trend. The Fisher Transform is a technical indicator that normalizes asset prices, thus making turning points in price clearer. Takeaways Turning poi
FREE
This indicator is based on Mr. Mark Fisher's ACD strategy, based on the book "The Logical Trader." - OR lines - A lines - C lines - Daily pivot range - N days pivot range - Customizable trading session - Drawing OR with the desired time Drawing levels A and C based on daily ATR or constant number - Possibility to display daily and last day pivots in color zone - Displaying the status of daily PMAs (layer 4) in the corner of the chart - Show the order of daily pivot placement with multi-day pi
FREE
Introducing the Professional Indicator ARKA – Candle Close Time Do you want to always know the exact remaining time for the current candle to close? Or do you want to instantly see the real-time broker spread right on your chart without any extra calculations? The ARKA – Candle Close Time indicator is designed exactly for this purpose: a simple yet extremely powerful tool for traders who value clarity, precision, and speed in their trading. Key Features: Displays the exact time re
FREE
This indicator is based on Mr. Mark Fisher's ACD strategy, based on the book "The Logical Trader." - OR lines - A lines - C lines - Daily pivot range - N days pivot range - Customizable trading session - Drawing OR with the desired time Drawing levels A and C based on daily ATR or constant number - Possibility to display daily and last day pivots in color zone - Displaying the status of daily PMAs (layer 4) in the corner of the chart - Show the order of daily pivot placement with multi-day piv
FREE
This Indicator is based on Mr. Dan Valcu ideas. Bodies of candles(open-close) are the main component used to indicate and assess trend direction, strength, and reversals. The indicator measures difference between Heikin Ashi close and open. Measuring the height of candle bodies leads to extreme values that point to trend slowdowns. Thus quantifies Heikin Ashi to get earlier signals. I used this indicator on Heiken Ashi charts but, it's possible to choose to calculate Body size based on Heik
FREE
The Fisher Transform is a technical indicator created by John F. Ehlers that converts prices into a Gaussian normal distribution. The indicator highlights when prices have moved to an extreme, based on recent prices. This may help in spotting turning points in the price of an asset. It also helps show the trend and isolate the price waves within a trend. The Fisher Transform is a technical indicator that normalizes asset prices, thus making turning points in price clearer. Takeaways Turning poi
FREE
This indicator idea comes from Tushar Chande called Qstick. Technical indicators quantify trend direction and strength in different ways. One way is to use the difference between close and open for each bar and to sum it up over a period of time. The formual is: Qstick (period ) = Average ((close-open ), period ) In this indicator, we can choose how to calculate body by two famous chart types. The first and default indicator settings are based on Heiken Ashi chart, and the second is based
FREE
Introducing the Professional Arka STM Signal Indicator With Arka Candle Close Time – 100% Free Version Fast, Accurate, and Unmatched in Identifying Trading Opportunities This indicator is the result of combining advanced price action analysis with specialized market algorithms, delivering clear, timely, and profitable signals. Completely Free – No Installation or Usage Limits ️ An automated trading bot, fully synchronized with it, is also ready to run. The Power of ARKA   STM Si
FREE
This Indicator is based on Mr. Dan Valcu ideas. Bodies of candles(open-close) are the main component used to indicate and assess trend direction, strength, and reversals. The indicator measures difference between Heikin Ashi close and open. Measuring the height of candle bodies leads to extreme values that point to trend slowdowns. Thus quantifies Heikin Ashi to get earlier signals. I used this indicator on Heiken Ashi charts but, it's possible to choose to calculate Body size based on Heik
FREE
Introducing the Professional Indicator ARKA – Candle Close Time Do you want to always know the exact remaining time for the current candle to close? Or do you want to instantly see the real-time broker spread right on your chart without any extra calculations? The ARKA – Candle Close Time indicator is designed exactly for this purpose: a simple yet extremely powerful tool for traders who value clarity, precision, and speed in their trading. Key Features: Displays the exact time re
FREE
This indicator idea comes from Tushar Chande called Qstick. Technical indicators quantify trend direction and strength in different ways. One way is to use the difference between close and open for each bar and to sum it up over a period of time. The formual is: Qstick (period ) = Average ((close-open ), period ) In this indicator, we can choose how to calculate body by two famous chart types. The first and default indicator settings are based on Heiken Ashi chart, and the second is based
FREE
This indicator is designed based on Mr.   WD   Gann's square of nine methods. Using this indicator, we can enter the desired   pivot   price and, based on the coefficient we assign to it, extract 8   support and resistance   numbers with 8 angles of 45, 90, 135, 180, 225, 270, 315, and 360. Calculates 8   support and resistance   points and draws   support and resistance   lines. The coefficient is to triple the number of executions. To select   pivot points   in which a price is a large nu
The Fisher Transform is a technical indicator created by John F. Ehlers that converts prices into a Gaussian normal distribution. The indicator highlights when prices have moved to an extreme, based on recent prices. This may help in spotting turning points in the price of an asset. It also helps show the trend and isolate the price waves within a trend. The Fisher Transform is a technical indicator that normalizes asset prices, thus making turning points in price clearer. Takeaways Turning poi
Lunexa – The Intelligent Trading Robot MT5 Version   :   h ttps://www.mql5.com/en/market/product/143765 products List :   https://www.mql5.com/en/users/arendav/seller Signals:   https://www.mql5.com/en/signals/2341558 Why Lunexa? In the ruthless world of trading, there's no place for luck—only intelligent algorithms and adaptive systems survive. Lunexa is the result of over 20 years of research, development, and testing on more than 2 million real market data points, built with o
The Fisher Transform is a technical indicator created by John F. Ehlers that converts prices into a Gaussian normal distribution. The indicator highlights when prices have moved to an extreme, based on recent prices. This may help in spotting turning points in the price of an asset. It also helps show the trend and isolate the price waves within a trend. The Fisher Transform is a technical indicator that normalizes asset prices, thus making turning points in price clearer. Takeaways Turning poi
Lunexa – The Intelligent Trading Robot MT4 Version   :     https://www.mql5.com/en/market/product/143759 products List :   https://www.mql5.com/en/users/arendav/seller Signals:   https://www.mql5.com/en/signals/2341558 Why Lunexa? In the ruthless world of trading, there's no place for luck—only intelligent algorithms and adaptive systems survive. Lunexa is the result of over 20 years of research, development, and testing on more than 2 million real market data points, built with o
フィルタ:
drw122
107
drw122 2025.08.22 12:13 
 

спасибо отличный индикатор

レビューに返信