Geo Info
- インディケータ
- バージョン: 6.0
- アップデート済み: 26 2月 2025
Geo_Info is one of the most informative indicators displaying net levels as well as basic data on a symbol and trading positions in a space-saving manner.
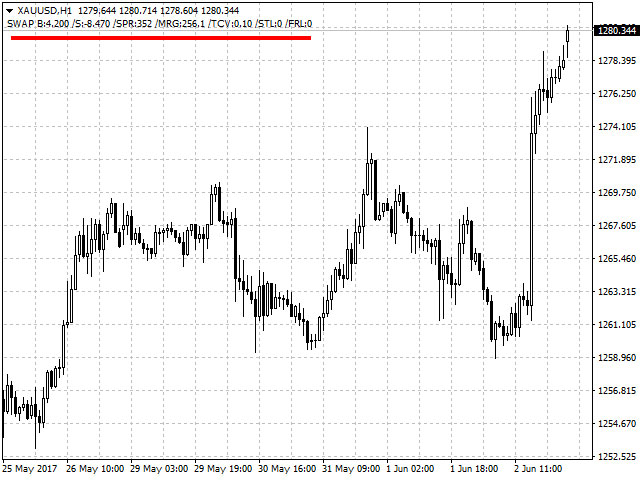
- displays brief data on the basic symbol parameters in the upper left corner of the chart:
Swap for Buy order, swap for Sell order, current spread, margin, tick size, stop level, order freeze level. The data is shown for one lot in points.
The data is displayed as follows: SWAP B:4.200 /S:-8.470 /SPR:342 /MRG:256.0/TCV:0.10/STL:0/FRL
The data can be enabled/disabled in the indicator parameters.
- The indicator displays brief data on the basic symbol parameters in the second line of the upper left corner of the chart: number of Buy, Sell, BuyStop, SellStop, BuyLimt and SellLimit orders, as well as the total number of open position lots.
The data is displayed as follows: B:0 S:1 BS:0 SS:0 BL:0 SL:1/LotB:0 LotS:0.1
The data can be enabled/disabled in the indicator parameters.
- The new version displays information on the amount of current profit and accumulated swaps for the instrument in total for BUY and SELL positions in the following format:
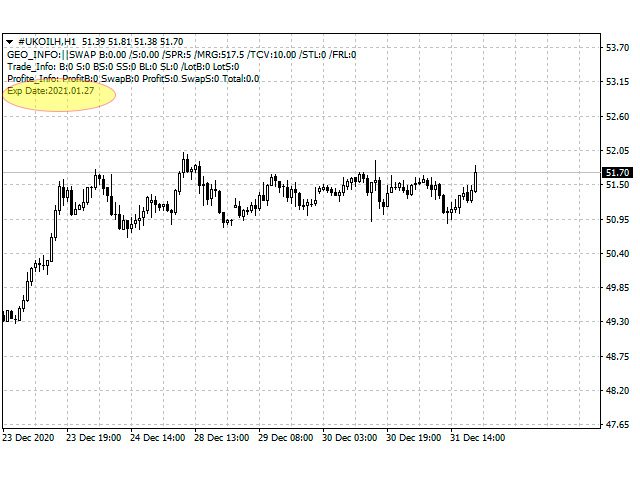
Profite_Info: ProfitB:125 SwapB:-2 ProfitS:-20 SwapS:-1 Total:102 - For forward instruments (futures), the expiration date is displayed in the following format:
Exp Date:2022.02.18 - Display of information about the average range per period and the ratio range per period / spread has been introduced, which allows choosing the optimal timeframe for the most efficient operation in given market conditions. The data is presented in the format:
ATR14: 906.786||| ATR/SPR: 3.956
If the ATR/SPR ratio is low, it may make sense to choose a higher timeframe for more efficient work. - Besides, you are now able to display "Zero lines" (line names - ZeroBuy and ZeroSell) for each group of buy and sell orders (net levels of Buy and Sell positions where the total profit of all buy/sell orders considering accumulated swaps is 0). Each level is displayed by a line of its color. The levels are calculated based on open orders.
If there are pending orders, additional "Zero Lines" (ZeroBuyP and ZeroSellP lines) are displayed representing net levels as if the pending orders have already been activated.
These levels are displayed as rays.
They are useful for traders working with multiple positions, increasing their volume and using grids. Thus, the lines display a net position for each group (buy and sell) of both open and pending orders.
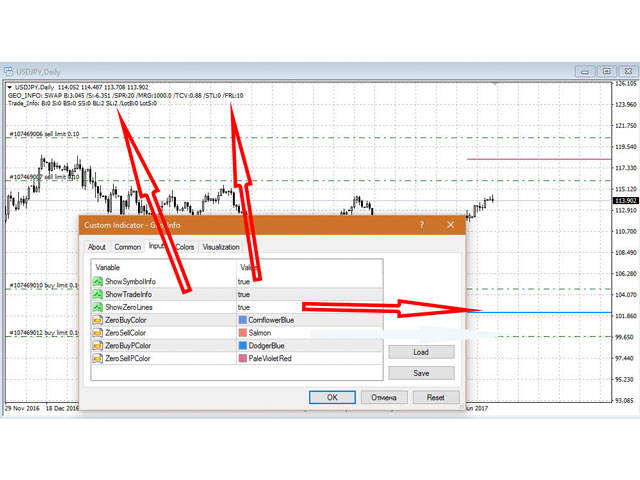
Parameters
- ShowSymbolInfo = True - display symbol data
- ShowTradeInfo = True - display trading positions data
- ShowZeroLines = True - display buy and sell "Zero Lines"
- ZeroBuyColor = clrCornflowerBlue - "Zero Line" color for open BUY orders.
- ZeroSellColor = clrSalmon - "Zero Line" color for open SELL orders.
- ZeroBuyPColor = clrDodgerBlue - "Zero Line" color for BUY orders considering pending ones.
- ZeroSellPColor = clrPaleVioletRed - "Zero Line" color for SELL orders considering pending ones.


ОГОНЬ !!!!