We Trade Live Trend Max

We Trade Live Trend Max 500-1000 Pips

Our team of engineers have programmed a great tool which we have used to success and will aid you in making better decisions when placing a trade, it is better than anything available on the market at the moment! try & Test Against other products and see for yourself how amazing this is.

Our Main Objective is to help you as traders discover how you can take a simple trading setup and make consistent profits. We provide the fundamentals needed to trade the market,

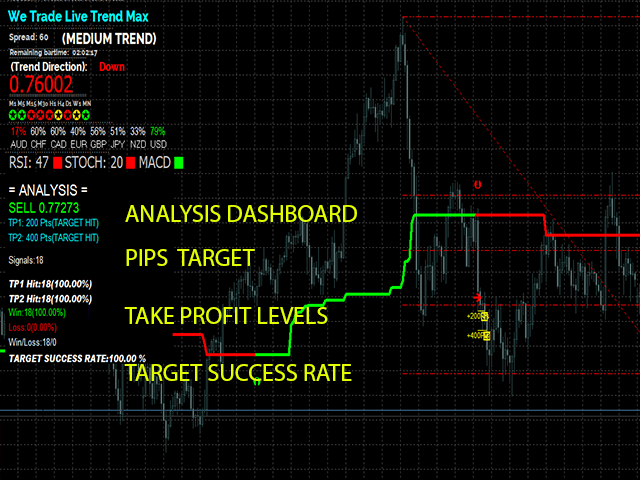
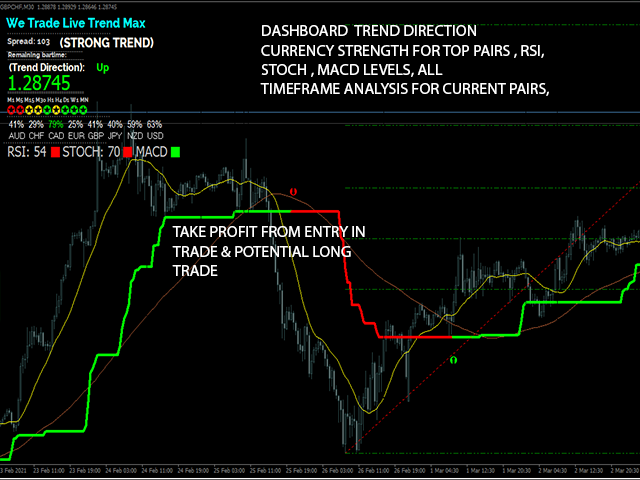
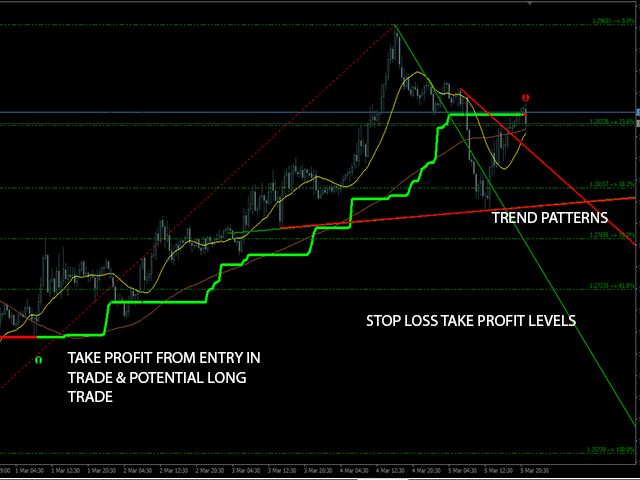
We Trade Live Trend Max uses the most advanced algorithm to detect market potential trades using price action and statistical calculations to help find your first take profit level and potential for longer trades on the trend the market is following.

We Trade Live Trend Max is a great tool for finding longer trends in the market with great success there is a high percentage of successful trend breakouts, this indicator is used to to take profit from entry into a trade from the We Trade Live Trend indicators available on the Market especially the We Trade Live Entry  & Exit indicator . never repaints or back paints , works on all symbols and time frames you have the option also for integrated pop- up, email, push notification and sound alerts.

This Indicator allows the trader to make longer trades which in turn brings more profit. THIS IS ONLY TO BE USED ON THE DAY CHART AS THIS IS PROGRAMMED FOR LONG TRADES WHERE GREAT PROFIT CAN BE MADE.

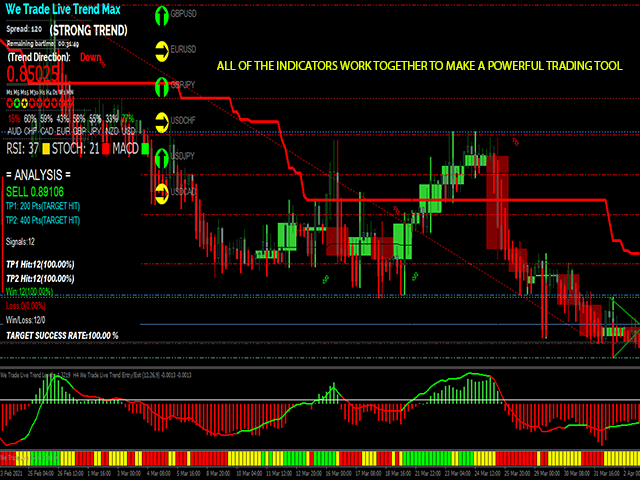
We Trade Live Trend Max has an advanced Fibonacci sequence used to identify support and resistance lines and trade breakouts, which can also be used for stop-loss placements and counter-trend target pricing which can also help a trader identify the possible extent of retracement.  This is complemented with a RSI , MACD Trend analysis & a breakout Timeframe aid alongside a Bullish and Bearish indication on the current market with currency strengths, this  provides you with current currency strengths of the top trading currencies currency in a percentage,  this tool is a must have as it helps identify the current market strength and can help you decide which currency to trade on.

A HIGH PERCENTAGE SCORE = STRONG PERFORMING CURRENCY 

LOW PERCENTAGE SCORE = LOW PERFORMING CURRENCY 

providing additional confirmation of trading entries or exits.  Trade in the overall direction of the prevailing trend in order to reduce the amount of false breakout signals

a Newly added FEATURE added is the Check TF (Checktime frame) feature added to 15mins, 30mins 1hr chart  which will check the trend on all frames times in particular the 4hr trend. so if a alert is received to buy or sell and the trend is not correlating to long term 4hr trend . you will receive a message to check analysis of A sell or buy signal before entering , if all trends correlate you will receive a message of strong sell or buy this is a feature which allow you to filter out false signals and increase the accuracy of trend follow on trades.   

when turned on Variable will check 15mins, 30mins, 1hr charts fast computer may be required for following timeframes to be turned on when turned off will appear on 15 minute chart which we believe will be 

when setting is turned off it will only checks the 15min chart for trend entries , which is possible the best used for entering trades. 

This indicator is to only be used on the 1day time frame it has the highest success rate the pip value aim per trade is

500 PIPS 1ST TARGET

1000 PIPS 2ND TARGET 

WITH A HIGH SUCCESS RATE AS CAN BE SEEN IN THE SIGNAL ANALYSIS ON THE INDICATOR 

Following these simple Rules will allow you to be successful you can return a high percentage of successful trades using this method as a tool.

Parameters

    Test the demo version and See amazing results, and is a great tool to use to make market decisions.


    おすすめのプロダクト
    Introduction to Fractal Pattern Scanner Fractal Indicator refers to the technical indicator that makes use of the fractal geometry found in the financial market. Fractal Pattern Scanner is the advanced Fractal Indicator that brings the latest trading technology after the extensive research and development work in the fractal geometry in the financial market. The most important feature in Fractal Pattern Scanner is the ability to measure the turning point probability as well as the trend probabi
    The "Market Profile" indicator displays the profiles and volumes of periods – weekly, daily, session (8-hour), 4-hour, hour, summary. The VAH/VAL price area is automatically highlighted by a dotted line for each profile (except for the summary). The indicator includes chroma Delta, which colors the profile areas. The areas of prevailing Buys is colored in green, that of Sells - in red. The intensity histogram features blue/red respectively. In the filter mode, the indicator displays the volume a
    このインジケーターは実践的なトレードに最適な自動波動分析のインジケーターです! 場合... 注:   Tang Lun (Tang Zhong Shuo Zen) の命名規則の影響で、私は波のグレーディングに西洋の名前を使用することに慣れていません。基本的な波を ペン 、二次波のバンドを セグメント と名付けました。同時に、 セグメント にはトレンドの方向が指定されます (この命名方法は将来のノートで使用されます。最初に言っておきます)。ただし、アルゴリズムは曲がりくねった理論とはほとんど関係がないため、付けるべきではありません。これは、私の市場分析 によって要約された、絶えず変化する複雑な運用ルール を反映しています。 バンドは標準化され、人によって異なることがないよう定義されており、市場参入を厳密に分析する上で重要な役割を果たす人為的な干渉の描画方法が排除されています。 このインジケーターを使用することは、取引インターフェイスの美しさを改善することと同等であり、元の K ライン取引を放棄し、取引の新しいレベルに連れて行きます。また、宣伝の観点から顧客の認識も向上します。 イ
    この取引ツールを使用すると、15 の市場を同時にスキャンできます。 新しい取引指標 2024 のご紹介: ️ ダッシュボード マルチ通貨 マルチタイムフレーム 確率的。 私がこの取引ツールを作成した理由は少なくとも 2 つあります。 まず、1 つの市場だけを観察することに飽きました。 次に、別の市場への参入の瞬間を逃したくないです。 だからこそ、他の市況も同時に知りたいのです。 このため、複数の市場の状況を同時にスキャンできるスキャナーが必要です。 私は確率的メインライン > (または <=) 確率的シグナルラインが M1 から H4 (または単に M1 から M30) で始まる市場をよく探します。 私の分析に同意するなら、これがあなたが探していた取引指標です。 市況が上記の要件を満たす瞬間を見逃さないでください。 これは、多くの優れた機能を備えたストキャスティックのスキャナーまたはダッシュボードです。 確率的メインラインのデータを表示可能 確率シグナルラインのデータを表示可能 確率的メインラインとシグナルラインの位置を表示可能(シグナルラインの上のメインライ
    Note : The slow loading of the indicator issue has been addressed . This new version loads fast and does not slow the platform. Version 1.3 : We have updated the indicator to include an historical bar scanning option . So instead of scanning all bars in the history (which can make the indicator slow sometimes ) , you can select the maximum number of bars it can scan which can increase the performance and make the indicator faster. This indicator scans the 1-3 Trendline pattern . The indicato
    MASTER MAは、移動平均クロスベースのインジケータであり、異なる期間の3つの移動平均を使用してシグナルを生成し、戦略は非常にシンプルですが、インジケータには、勝率/総利益などの有用なインスタントバックテスト結果を示す統計ダッシュボードがあります...など、このインジケーターにはポイント単位でTPとSLの入力があるため、TPとSLをTPの緑の点とSLの赤いxの形でチャートに表示することができ、インジケーターはそれらの値を使用して勝敗率を計算します。 この指標は、新しいバーが厳密に開いているときに信号を送ります。信号が再描画されたり遅延したりすることはありません。 推奨事項:m5以上を使用してください...毎日の目標を持つ...インジケーターの期間をいじって、より良い結果を得てください。 パラメーター: 3つの移動平均の期間と種類 アラート TP/SL値は、各シグナルとともにチャートに印刷し、以下に基づいて勝敗を計算します。 ダッシュボードの色と位置の入力 -------------------------------------------------------
    Gioteen Volatility Index (GVI)   - your ultimate solution to overcoming market unpredictability and maximizing trading opportunities. This revolutionary indicator helps you in lowering your losing trades due to choppy market movements. The GVI is designed to measure market volatility, providing you with valuable insights to identify the most favorable trading prospects. Its intuitive interface consists of a dynamic red line representing the volatility index, accompanied by blue line that indicat
    **Binary Smart Systemのご紹介:究極のトレードパートナー** Binary Smart Systemは単なるインジケーターではありません。様々な市場で的確なシグナルを提供し、洗練されたアルゴリズムと豊富なテクニカルインジケーターの集合をベースにした、トレーダーを的確さとタイムリーなシグナルで装備するための厳選されたトレードツールです。 **インジケーターコンポーネント:** 1. **移動平均パーセンテージ(MAP):** このコンポーネントは複数の移動平均の加重平均を計算し、トレンドの特定の強力な基盤を形成します。MAPは市場の状況に動的に適応し、現在のトレンド方向に対する洞察を提供します。 2. **商品チャネル指数(CCI):** 平均価格からの偏差を分析することで、CCIは買われすぎと売られすぎの状態を評価します。Binary Smart SystemのCCI統合は、ポテンシャルな反転ポイントを特定する包括的なアプローチを保証します。 3. **移動平均収束拡散法(MACD):** シンプルなクロスオーバーを超えるMACDコンポーネント。MACD
    WPR by Profile, or WPR for Professionals Geo_WprPro is one of the well-known currency profile indicators. It simultaneously displays two WPR indicators with different parameters in the matrix form on all timeframes of multiple currency pairs forming the currency profile . As follows from the description, " WPR is a leading indicator that often goes ahead of the price chart. The oscillator frequently reaches extreme values before the price reversal as if anticipating that event: it almost always
    This Indicator is use the ZigZag to calculate the Upper and  Lower Bound and the uptrend and the downtrned. Red for downtrend, Green for uptrend and Yellow is for the horizontal trend this horizontal trend also bookmarked the upper limited and the lower limited the the price swings.  Or in simple the Support and the Resistance level. However, You may use the Heikin Ashi to confirm the trend of the buy sell signal above. I cannot guarantee the win rate, Nevertheless, you must study well the timef
    Your Good Friends — this is not just an indicator, but your reliable trading assistant, designed for traders who value simplicity, clarity, and stability. It combines the best classic methods of technical analysis — support and resistance levels, reversal signals, visual cues — and presents them in the clearest, most user-friendly format possible. Suitable for both beginners and experienced traders — especially those who want to eliminate chaos, reduce stress, and trade based on clear signals.
    このインジケーターは、エリオット波動理論と組み合わせて作動し、2つの方法で使用されます: 自動モード: このモードでは、インジケーターがチャート上の全ての5つのモーティブ波を自動的に検出し、予測とポテンシャルな逆転ゾーンを提供します。また、アラートやプッシュメッセージを生成する能力も備えています。この自動機能により、エリオット波動パターンの識別と分析のプロセスが効率化されます。 手動モード: このオプションは、エリオット波動理論を手動で扱いたいトレーダー向けです。9つの段階を使用して波を描画することができます。各段階は、表示された後に描画されたラインを調整して個別に定義できます。この機能により、手動で波を描画するプロセスがより効率的になります。重要な点として、すべての描画データが将来の参照のためにプラットフォームのデータフォルダに保存されることに注意してください。 パラメータ: Name: インジケーターの名前。 Use_System_Visuals: インジケーターのテーマを有効または無効にして、取引プラットフォーム全体の外観に合わせます。 Explain_Comment: 波の番号
    Boba Binary
    Anthonius Soruh
    5 (1)
    Result look on  https://t.me/BonosuProBinary Pair : All Forex Pairs Time Frame : M1 Expaired : 1-2 Minutes Trade Time Once Time a Day Backtester, Alert Avaliable Average Signals Generate 5 - 20 Signals All Pair A Day Broker Time Zone GMT+3 Default Setting [Example Broker GMT+3 : Alpari, FBS, XM] Support Broker : Deriv, IQOption, Alpari, Binomo, Olymtrade, Qoutex, GCoption, etc Support Auto Trading : MT2 Trading, Binary Bot, Intrade Bot, Binomo Bot, Olymptrad Bot, MX2 trading, Price Pro, etc Ind
    Cota Binary
    Anthonius Soruh
    5 (2)
    Result look on  https://t.me/BonosuProBinary Pair : All Forex Pairs Time Frame : M1 Expaired : 1-2 Minutes Trade Time Once Time a Day Backtester, Alert Avaliable Average Signals Generate 5 - 20 Signals All Pair A Day Broker Time Zone GMT+3 Default Setting [Example Broker GMT+3 : Alpari, FBS, XM] Support Broker : Deriv, IQOption, Alpari, Binomo, Olymtrade, Qoutex, GCoption, etc Support Auto Trading : MT2 Trading, Binary Bot, Intrade Bot, Binomo Bot, Olymptrad Bot, MX2 trading, Price Pro, etc Ind
    Garuda Empire
    Ellan Dirgantara Tholkhah
    The Garuda Empire - Binary Options Experience the epitome of trading synthesis where the time-honored Ichimoku methodology seamlessly intertwines with revered Western indicators. It's a harmonious blend—Europe shaking hands with Japan, a true testament to the power of global financial collaboration. With years of dedicated observation and analysis, I've come to one conclusion: Mastery is achieved through specialization. My journey with the EURJPY has been transformative, leading to the birth of
    ナイト ゴースト - バイナリ オプションの矢印インジケーター。 これからのあなたの頼もしいアシスタントです! 11 - チャートの再描画なし - すべての通貨ペアで大活躍! -インジケータの精度は最大 90% (特に夜間) ・長時間の設定不要(バイナリーオプションに最適な設定) - 信号が遅れない - 現在のローソク足でのシグナルの出現 ・M1期にピッタリ(No More!) ・目に優しいキャンドルカラー(赤・青) -インストールされたアラート それを扱う: - 青い矢印は信号アップを示します -赤い下向き矢印 M1 以上のインジケーターをチャートに配置しないでください. シグナルの精度が低下します! インジケーターのスクリーンショットとビデオを見る
    This product works by detecting trend opportunities. So as shown in the screenshot when The indicator shows an upward arrow it shows the market is on an uptrend and when the indicator Shows a downward arrow it shows the market is on a downward direction. What makes this indicator Special is that it has additional signals just below the arrow signals. It is up to the trader to be  Creative and combine these signals with the arrow signal to get accurate forecasts.
    CONGESTION BREAKOUT PRO This indicator scans the breakout of congestion zones . This indicator unlike any other congestion indicator you will find in the market right now,  it uses an advanced algorithm not peculiar to most traditional congestion indicators available today . The advanced algorithm used to define the congestions  is greatly responsible for the high rate real congestion zones and low rate fake congestion zones spotted by this product. UNDERSTANDING CONGESTION Congestion are ar
    Bank Expert Indicator Uses A Simple method of tracking price as it moves across the chart and signals when a potential long or short position is active and indicates this to the trader giving you the opportunity to take a position on the market. Or you can simply use this indicator to give yourself signals and determine if you want to take the trade or learn the strategy on your own. The Signals From this indicator are targeted at long-term positions and focus on top quality call outs. 
    Hammer Shooting Star v1.1 – Advanced Candlestick Pattern Scanner Author: LIANG1990 Are you searching for a reliable tool to identify market reversals with precision? Hammer Shooting Star v1.1  is a professional MT4 indicator designed to scan and detect high-quality Hammer and Shooting Star candlestick formations. Unlike basic pattern indicators, this tool applies multiple built-in filters (shape, size, trend alignment, and contextual conditions) to reduce false signals and highlight only the cle
    Нестандартный индикатор определения текущего тренда. Альтернативный подход к определению текущей рыночной тенденции. В основе лежит уникальный алгоритм. Не используются   скользящие средние , осцилляторы , супер-тренды и прочие стандартные индикаторы. Для таймфреймов:   от M15 до D1 . Для стилей торговли:  интрадэй, свинг, долгосрок . Может стать готовой торговой стратегией совместно с любым канальным индикатором. Например таким, как индикатор   "Snake" . Внимание! Это индикатор, а не советник,
    REMINDER: Early buyers hot price discount: Price subject to rise after first 20 copies. Starting price $65 and final price will be $1275. Secure your discounted copy Now! Smart Money Analyser Indicator User Manual 1. Introduction Welcome to the   Smart Money Analyser Indicator This powerful tool provides traders with comprehensive market analysis by combining various technical indicators to generate actionable trading signals. Designed to be user-friendly, this indicator helps traders of all
    ToolBox 360 is the swiss knife of all indicators. It is full packed with useful tools to help you with your trading. It can be used to find best entry and exit points and help you to decide if you should open a trade or not. It shows market trends, candlestick formations outside / inside bars and you can sett time based allerts. Main features: Time based Fibonacci lines Choose a start and end time and the indicator shows you Fibonacci lines within the selected time range including range high a
    This indicator allows you to see the strength of the trend on all timeframes. It can be used for all currency pairs. The indicator can be displayed in the form of a column (from left to right): status buy / sell / strong buy / strong sell, strength of the trend in percentage, pips last candle, body candle now, remaining time, and the timeframe of M1 to MN. Information contained below (from left to right): total trend percent, sell percent, buy percent.
    PUMPING STATION – あなた専用の「オールインワン」戦略 PUMPING STATIONは、あなたのトレードをより楽しく、そして効果的に変えてくれる革新的なFXインジケーターです。ただの補助ツールではなく、強力なアルゴリズムを備えた本格的なトレーディングシステムで、より安定したトレードのスタートをサポートします。 この商品をご購入いただくと、以下の特典を無料でお付けします: 専用セットファイル:自動設定による最大パフォーマンスを実現。 ステップバイステップのビデオマニュアル:PUMPING STATION戦略の使い方を学べます。 Pumping Utility:PUMPING STATION専用の半自動トレードボットで、より快適かつシンプルな運用を可能にします。 ※ご購入後すぐにご連絡ください。追加リソースへのアクセスを提供いたします。 PUMPING STATIONの仕組み: トレンド管理:市場のトレンド方向を即座に判断。トレンドはあなたの最高の味方です。 エントリーサイン:チャート上の矢印で、取引のタイミングと方向を明確に示します。 明確な目標設定:インジケーターが自
    初心者またはプロフェッショナルである当社のベストセラーのマルチタイムフレームPivotProfは、スペシャリストが使用するサポート層とレジスタンス層を使用して、売買を美化し、一流の変更の可能性を提供します。ピボットの売買は、主要な範囲で市場に出入りするための簡単で優れた手法であり、当局によって長い間使用されており、外国為替、暗号、株式、インデックスなどのすべてのシンボルで機能します。ピボット教授がトップをもたらします市場が反応する可能性が最も高い場所であるディーラーへのレートティア。これは、ディーラーが市場に出入りし、大規模な最終損失やドローダウンを回避することを望んでいるまさにその要素です。 17の特定の時間枠全体から、シンボルごとに120度以上のデータを計算し、同時に表示する、他に類を見ないアルゴリズムを備えた豊富な機能。すべてがユニークで整頓された使いやすい形式で表示され、端末、電子メール、携帯電話のスマートフォンアラートが付属しています。さらに、全体がカスタマイズ可能です...数式、表示、信号など。 売買スタイルは数えられません。PivotProfを使用して、これらの重要
    This is  a dashboard indicator that displays the Average Level of each selected currency pairs that filters and gives us a signal for overbought (>=90%) or if price at extreme peak above 90, and/or oversold (<=10%) or if price at extreme peak below 10. The calculation is using Relative Strength Index default periods (2 & 9) applied to three different higher time frames H4,D1,&W1. This won't change or altered even if you change symbol or switch to lower time frames or even in monthly and year
    Introduction This indicator detects volume spread patterns for buy and sell opportunity. The patterns include demand and supply patterns. You might use each pattern for trading. However, these patterns are best used to detect the demand zone (=accumulation area) and supply zone (=distribution area). Demand pattern indicates generally potential buying opportunity. Supply pattern indicates generally potential selling opportunity. These are the underlying patterns rather than direct price action. T
    TPA True Price Action indicator reveals the true price action of the market makers through 100% non-repainting signals (except early signals mode) strictly at the close of a candle! TPA shows entries and re-entries, every time the bulls are definitely stronger than the bears and vice versa. Not to confuse with red/green candles. The shift of power gets confirmed at the earliest stage and is ONE exit strategy of several. There are available now two free parts of the TPA User Guide for our custom
    チャートを構成し、周期的な価格変動を識別するテクニカル指標。 どのチャートでも動作します。 いくつかの種類の通知。 グラフ自体に追加の矢印があります。 履歴を再描画せずに、キャンドルのクローズに取り組みます。 M5以上のTFを推奨します。 パラメータの使用と設定が簡単です。 異なるパラメータを持つ 2 つのインジケーターを使用する場合、他のインジケーターなしで使用できます。 入力パラメータは2つあります 周期性と信号持続時間 これら 2 つのパラメータは、チャート構造の処理を扱います。 Cyclicity - 反転サイクルが変化する頻度を調整し、サイクルを滑らかにします。 Signal duration - 最小数では価格変動の衝動を検出し、最大数では長期的なトレンドの動きを検出します。
    このプロダクトを購入した人は以下も購入しています
    El indicador "MR BEAST ALERTAS DE LIQUIDEZ" es una herramienta avanzada diseñada para proporcionar señales y alertas sobre la liquidez del mercado basándose en una serie de indicadores técnicos y análisis de tendencias. Ideal para traders que buscan oportunidades de trading en función de la dinámica de precios y los niveles de volatilidad, este indicador ofrece una visualización clara y detallada en la ventana del gráfico de MetaTrader. Características Principales: Canal ATR Adaptativo: Calcula
    An exclusive indicator that utilizes an innovative algorithm to swiftly and accurately determine the market trend. The indicator automatically calculates opening, closing, and profit levels, providing detailed trading statistics. With these features, you can choose the most appropriate trading instrument for the current market conditions. Additionally, you can easily integrate your own arrow indicators into Scalper Inside Pro to quickly evaluate their statistics and profitability. Scalper Inside
    Miraculous Indicator – ガン・スクエア・オブ・ナインに基づく100%非リペイントのFXおよびバイナリーツール この動画では、FXおよびバイナリーオプションのトレーダー向けに特別に開発された、非常に正確で強力な取引ツールである Miraculous Indicator を紹介しています。このインジケーターがユニークなのは、伝説的な ガン・スクエア・オブ・ナイン と ガンの振動の法則 に基づいている点で、現代の取引で利用できる最も正確な予測ツールの一つとなっています。 Miraculous Indicatorは 完全に非リペイント であり、ローソク足が確定した後にシグナルが変化したり消えたりすることはありません。つまり、見たものがそのまま利用できます。これにより、トレーダーは自信を持ってエントリーおよびエグジットを行うための信頼性と一貫性のある根拠を得ることができます。 主な特徴: ガン・スクエア・オブ・ナインとガン理論に基づいて構築 100%非リペイントのシグナルシステム すべての時間枠(M1、M5、H1、H4、日足、週足)で機能 FXおよびバイナリーオプション取引
    このインジケーターは、反転ポイントと価格戻りゾーンを正確に表示します。     主要プレーヤー 。新たなトレンドが形成される場所を把握し、最大限の精度で意思決定を行い、すべての取引をコントロールします。 TREND LINES PRO インジケーターと組み合わせることで、その潜在能力を最大限に発揮します。 VERSION MT5 インジケーターが示す内容: 新しいトレンドの始まりに活性化する反転構造と反転レベル。 リスクと報酬の比率を最小限に抑えた利益 確定 と 損失停止の レベルの表示     RR 1:2   。 インテリジェントな削減ロジックによるストップロス。 指定されたインジケーターから 2 つのトレンド タイプの反転パターンを表示します。 指標: トレンドを追う   TREND LINES PRO   (世界的なトレンドの変化) TREND PRO   (クイックトレンド変更) シンプルで効果的   スキャナー   リアルタイムトレンド(新機能)。 マルチタイムフレームのインストゥルメント フィルタリング。 画面   利益     LOGIC AI信号の後。 当日プラス方
    Volatility Trend System - a trading system that gives signals for entries. The volatility system gives linear and point signals in the direction of the trend, as well as signals to exit it, without redrawing and delays. The trend indicator monitors the direction of the medium-term trend, shows the direction and its change. The signal indicator is based on changes in volatility and shows market entries. The indicator is equipped with several types of alerts. Can be applied to various trading ins
    Precautions for subscribing to indicator This indicator only supports the computer version of MT4 Does not support MT5, mobile phones, tablets The indicator only shows the day's entry arrow The previous history arrow will not be displayed (Live broadcast is for demonstration) The indicator is a trading aid Is not a EA automatic trading No copy trading function The indicator only indicates the entry position No exit (target profit)  The entry stop loss point is set at 30-50 PIPS Or the front hi
    現在40%OFF! 初心者やエキスパートトレーダーのためのベストソリューション! このダッシュボードソフトウェアは、28の通貨ペアで動作しています。それは私達の主要な指標(高度な通貨の強さ28と高度な通貨インパルス)の2に基づいています。それは全体の外国為替市場の大きい概観を与えます。それは、すべての(9)時間枠で28の外国為替ペアのための高度な通貨の強さの値、通貨の動きの速度と信号を示しています。チャート上で1つのインディケータを使用して市場全体を観察し、トレンドやスキャルピングの機会をピンポイントで見つけることができたら、あなたのトレードがどのように改善されるか想像してみてください。 このインディケータには、強い通貨と弱い通貨の識別、潜在的な取引の識別と確認がより簡単になるような機能が搭載されています。このインディケータは、通貨の強さや弱さが増加しているか減少しているか、また、すべての時間枠でどのように機能しているかをグラフィカルに表示します。 新機能として、現在の市場環境の変化に適応するダイナミックなマーケットフィボナッチレベルが追加され、すでに当社のAdvanced
    PairMaster Buy Sell Arrow Indicator for MT4 Trade Reversals Like a Pro — Catch Every Swing Point with Precision The PairMaster Buy Sell Arrow Indicator is a powerful MetaTrader 4 tool built to identify high-probability swing trading opportunities . Designed for traders who value accuracy, clarity, and simplicity, PairMaster detects key market turning points and plots intuitive buy and sell arrows directly on your chart. Key Features Accurate Swing Point Detection – Automatically identifies ma
    Dynamic Forex28 Navigator - 次世代の Forex 取引ツール。 現在 49% オフ。 Dynamic Forex28 Navigator は、長年人気のインジケーターを進化させたもので、3 つの機能を 1 つにまとめています。 Advanced Currency Strength28 インジケーター (レビュー 695 件)  + Advanced Currency IMPULSE with ALERT (レビュー 520 件) + CS28 コンボ シグナル (ボーナス)。 インジケーターの詳細 https://www.mql5.com/en/blogs/post/758844 次世代の Strength インジケーターが提供するもの  オリジナルで気に入っていたすべての機能が、新機能と精度の向上によって強化されました。 主な機能: 独自の通貨強度計算式。 すべての時間枠でスムーズかつ正確な強度ライン。 トレンドの特定と正確なエントリーに最適です。 ダイナミックマーケットフィボナッチレベル (マーケットフィボナッチ)。 このインジケーターに固有
    Super Signal – Skyblade Edition プロ仕様のノンリペイント / ノーラグ・トレンドシグナルシステム。卓越した勝率を実現 | MT4 / MT5 対応 1分足、5分足、15分足などの低い時間足で最も効果を発揮します。 主な特徴: Super Signal – Skyblade Edition は、トレンド取引に特化したスマートなシグナルシステムです。マルチレイヤーのフィルターロジックを用いて、明確な方向性と実際のモメンタムに支えられた強力なトレンドのみを検出します。 このシステムは 天井や底を予測するものではありません 。次の3つの条件がすべて満たされた場合にのみシグナルを発生させます: 明確なトレンド方向 モメンタムの増加 健全なボラティリティ構造 市場セッションに基づく流動性分析と組み合わせることで、シグナルの精度とタイミングがさらに向上します。 シグナルの特性: すべての矢印シグナルは 100% 非リペイント / 遅延なし 一度出現したシグナルは固定され、点滅・消失しません チャート上の矢印、情報パネル、ポップアップ通知、音声アラート、プッシュ通知
    Buy Sell Signal Pro — Market Structure & Pivot based Indicator Looking for a powerful yet lightweight market structure indicator designed to accurately detect swing turning points and visualize trend behavior with clarity . Built for traders who demand precision without chart clutter , it identifies key structural levels and delivers reliable buy/sell signals across any timeframe and instrument . By confirming pivot points before plotting signals, the indicator ensures consistent, non-repaintin
    KT Trend Trading Suite は、トレンドフォロー戦略と複数のブレイクアウトポイントを組み合わせた多機能インジケーターです。 新たなトレンドが形成されると、このインジケーターは複数のエントリーチャンスを提供し、トレンドにうまく乗ることが可能になります。あまり重要でないエントリーポイントを避けるために、プルバックの閾値が使用されます。 MT5 バージョンはこちらで入手可能です  https://www.mql5.com/en/market/product/46270 機能 市場のさまざまなダイナミクスを1つの方程式にまとめ、トレンドの全体像を明確に描写します。 エントリーシグナルに基づいて、局所的な高値と安値を視覚的に示す長方形を描画します。 シグナルの精度を自動的に測定し、パフォーマンス指標をシンプルに表示します。 複数時間足対応のダッシュボードを搭載し、すべての時間軸をスキャンして、それぞれのトレンド方向を表示します。 入力パラメータ History Bars:   過去のシグナル分析に使用する履歴バーの数。  Signals Period:   エントリ
    No Repaint Bext は完全な取引システムです。エントリーとエグジットのタイミング、そして取引の方向を示します。 緑の矢印 が表示されるたびに、 買い注文 を開きます。 赤い矢印 が表示されたら、すべての買い注文を閉じます。 同様に、 赤い矢印 が表示されたら、 売り注文 を開き、 緑の矢印 が表示されたらすべての売り注文を閉じます。 取引には M5(1分足) を使用し、 どの通貨ペアでも取引可能 です。 このインジケーターは 再描画されず 、ほとんど遅延しません。ただし、 ローソク足が確定するまで待つ という自然な条件はあります。 RSI フィルター と**2 つのクラシックな反転パターン(エンゴルフィング、ピンバー)**を使用し、反転の瞬間をほぼリアルタイムで捉えます。 インジケーターの効果的な使い方 どの通貨ペアでも使用可能 (テスト済み: GBPUSD, EURUSD ) 時間足:M5(1分足) 初期資金:500ドル以上 取引ロット:0.01 緑の矢印 が表示されたら、買い注文を開く。 赤い矢印 が表示されたら、すべての買い注文を閉じる。 赤い矢印 が表示されたら、売
    現在20%OFF! 初心者やエキスパートトレーダーに最適なソリューションです。 このインディケータは、エキゾチックペア・コモディティ・インデックス・先物など、あらゆるシンボルの通貨の強さを表示することに特化したインディケータです。金、銀、原油、DAX、US30、MXN、TRY、CNHなどの通貨の強さを表示するために、9行目にどのシンボルでも追加することができます。独自の機能を多数搭載し、新しい計算式を採用したため、ユニークで高品質、かつ手頃な価格のトレーディングツールとなっています。新しいトレンドやスキャルピングチャンスのトリガーポイントを正確に把握することができるため、あなたのトレードがどのように改善されるか想像してみてください。 ユーザーマニュアル:ここをクリック   https://www.mql5.com/en/blogs/post/708876 すべての時間枠に対応します。あなたはすぐにトレンドを見ることができるようになります! 新しいアルゴリズムに基づいて設計されているため、潜在的な取引の特定と確認がより簡単になります。これは、8つの主要通貨と1つのシンボルの強弱
    The Super Arrow Indicator provides non-repainting buy and sell signals with exceptional accuracy. Key Features No repainting – confirmed signals remain fixed Clear visual arrows: green for buy, red for sell Real-time alerts via pop-up, sound, and optional email Clean chart view with no unnecessary clutter Works on all markets: Forex, gold, oil, indices, crypto Adjustable Parameters TimeFrame Default: "current time frame" Function: Sets the time frame for indicator calculation Options: Can be set
    Prime Strike Signal – 明確なエントリー。リペイントなし。 Prime Strike Signal No Repaint Never は、視認性と安定性を求めるトレーダーのために設計された、シンプルでルールに基づくシグナルツールです。チャート上に即座に矢印を表示し、相場の短期的な方向転換にスムーズに追従できるようサポートします。 最新情報をチェック 今後のアップデートや新リリース情報を受け取るには、公式チャンネルに参加してください: https://www.mql5.com/en/channels/signalsandindicators ロジック このシステムは、異なる平滑化期間を用いた2つの価格ベースの計算を比較し、モメンタムの変化を検出します。算出された差分は第2のロジックレイヤーによってフィルタリングされ、有効なクロスが発生した場合にのみシグナルが発生します。これにより、ノイズではなく実際の価格の動きに基づいたエントリーが可能になります。 リペイントしますか? しません。本ツールは、ローソク足が完全に確定してからシグナルを表示します。シグナル
    System Trend Pro - This is the best trend trading indicator!!! The indicator no repaint!!!  The indicator has   MTF   mode, which adds confidence to trading on the trend (   no repaint   ). How to trade? Everything is very simple, we wait for the first signal (big arrow), then wait for the second signal (small arrow) and enter the market in the direction of the arrow. (See screens 1 and 2.) Exit on the opposite signal or take 20-30 pips, close half of it, and keep the rest until the opposite
    Meravith
    Ivan Stefanov
    5 (3)
    マーケットメーカーのためのツール。 Meravith は次の機能を提供します: すべての時間足を分析し、現在有効なトレンドを表示します。 強気と弱気の出来高が等しくなる流動性ゾーン(出来高均衡)を強調表示します。 異なる時間足のすべての流動性レベルをチャート上に直接表示します。 テキスト形式の市場分析を生成し、参考情報として表示します。 現在のトレンドに基づいて目標値、サポートレベル、ストップロスを計算します。 取引のリスクリワード比を算出します。 口座残高に基づいてポジションサイズを計算し、潜在的な利益を推定します。 また、市場に大きな変化があった場合には警告を表示します。 インジケーターの主要ライン: 強気/弱気の出来高エグゾーストライン ― 目標値として機能します。 市場のトレンドを示すライン。市場が強気か弱気かによって色が変わり、トレンドのサポートとして機能します。主にその色が市場センチメントを示します。 出来高均衡ライン(Eq)。Eq(Volume Equilibrium)ラインはシステムの中核です。これは買い手と売り手の出来高のバランスポイントを表します。市場の流動性を示し
    Quant Impulse Signal – リペイントなし、バックペインティングなし Quant Impulse Signalは、高値と安値の指数移動平均線を比較して市場の転換点を強調する高精度ツールです。リアルタイムの価格変動に反応し、確認された方向転換に基づく明確なエントリーシグナルを提供します。 ロジック このインジケーターは、すべてのタイムフレームで各ローソク足の高値と安値に対して8期間EMAを計算し、現在の価格をそれらのEMAと比較します。始値と終値が高値EMAの上にあり、価格が前のローソク足の高値を上回ると買いシグナルが発生します。逆に、始値と終値が安値EMAの下にあり、価格が前のローソク足の安値を下回ると売りシグナルが発生します。この二重フィルター方式により、本物の強弱を捉えたシグナルを提供します。 シグナル生成 矢印は、直近10本のローソク足の平均真値幅(ATR)の0.2倍の距離にプロットされます。この動的配置により、ボラティリティにかかわらず視覚的一貫性が保たれます。矢印の文字コードや色はチャートのスタイルに合わせてカスタマイズ可能です。 マルチタイムフレーム対応
    発見が困難で頻度が少ないため、分岐は最も信頼できる取引シナリオの1つです。このインジケーターは、お気に入りのオシレーターを使用して、通常の隠れた分岐点を自動的に見つけてスキャンします。 [ インストールガイド | 更新ガイド | トラブルシューティング | よくある質問 | すべての製品 ] 取引が簡単 通常の隠れた発散を見つけます 多くのよく知られている発振器をサポート ブレイクアウトに基づいて取引シグナルを実装します 適切なストップロスおよび利益レベルを表示します 設定可能なオシレーターパラメーター カスタマイズ可能な色とサイズ バー単位でサイズ別に分岐をフィルタリング パフォーマンス統計を実装します 電子メール/音声/視覚アラートを実装します 幅広い市場の見通しを提供するために、異なるオシレーターを使用して、干渉なしで同じチャートにインジケーターを何度もロードできます。このインジケーターは、次のオシレーターをサポートしています。 RSI CCI MACD オスマ 確率的 勢い 素晴らしい発振器 加速器発振器 ウィリアムズパーセントレンジ 相対活力指数 特に外国為替市場では、
    「 Dynamic Scalper System 」インジケーターは、トレンド波の中でスキャルピング取引を行う手法のために設計されています。 主要通貨ペアと金でテスト済みで、他の取引商品との互換性があります。 トレンドに沿った短期的なポジションオープンのシグナルを提供し、追加の価格変動サポートも提供します。 インジケーターの原理 大きな矢印はトレンドの方向を決定します。 トレンド波の中では、小さな矢印の形でスキャルピングシグナルを生成するアルゴリズムが機能します。 赤い矢印は強気方向、青い矢印は弱気方向です。 トレンドの方向には敏感な価格変動ラインが描かれ、小さな矢印のシグナルと連動します。 シグナルは次のように機能します。適切なタイミングでラインが現れるとエントリーシグナルが形成され、ラインが開いている間はポジションが保持され、完了すると取引が終了します。 推奨される動作時間枠はM1~H4です。 矢印は現在のローソク足に形成され、次のローソク足が開いている場合は、前のローソク足の矢印は再描画されません。 入力パラメータ Trend Wave Period - トレンド方向
    EZT Trend
    Tibor Rituper
    4.75 (4)
    EZTトレンドインジケーターは、トレンド、プルバック、エントリーの機会を示します。 オプションのフィルタリングとあらゆるタイプのアラートが利用可能です。 電子メールおよびプッシュ通知アラートが追加されます。 また、このインジケーターに基づいた EA も開発中であり、間もなく利用可能になる予定です。 2色のヒストグラムとラインで構成される多機能インジケーターです。 これはトレンドの方向と強さを視覚的に表現したもので、ラインまたはヒストグラム上で発散が何度も見つかります。 このインジケーターは自動パラメーター設定とうまく連携します。 これらは特定の時間枠に対して事前に決定されており、その設定でインジケーターを使用することをお勧めします。 手動モードでは、独自のパラメータを設定できます。 これはマルチタイムフレーム(MTF)インジケーターです。 このインジケーターは、MTF rsi、MTF cci、MACD pro などの他のインジケーターの組み合わせとうまく機能します。 取引される商品の変動が大きいほど、最適なエントリーを見つけるために使用する必要がある時間枠は短くなります。 常
    現在40%OFF! このダッシュボードは、複数のシンボルと最大9つのタイムフレームで動作するソフトウェアの非常に強力な部分です。 このソフトは、弊社のメインインジケーター(ベストレビュー:Advanced Supply Demand)をベースにしています。    Advanced Supply Demand ダッシュボードは、素晴らしい概要を提供します。それは示しています。  ゾーン強度評価を含むフィルタリングされた需給値。 ゾーン内/ゾーンへのPips距離。 ネストされたゾーンがハイライトされます。 選択されたシンボルの4種類のアラートを全ての(9)時間枠で提供します。 それはあなたの個人的なニーズに合わせて高度に設定可能です。 あなたの利益! すべてのトレーダーにとって最も重要な質問です。 市場に参入するのに最適なレベルはどこか? 成功のチャンスとリスク/リターンを得るために、強力な供給/需要ゾーン内またはその近くで取引を開始します。 損切りの最適な位置はどこですか? 最も安全なのは、強力な供給/需要ゾーンの下/上にストップを置くことです。 最適な利益
    Allows multiple indicators to be combined into a single indicator, both visually and in terms of an alert. Indicators can include standard indicators, e.g. RSI, CCI, etc., and also Custom Indicators, even those purchased through Market, or where just have the ex4 file. An early alert is provided, say when 4 out 5 indicators have lined up, and a confirmed alert when all are in agreement. A‌lso features a statistics panel reporting the success of the combined indicator by examining the current cha
    Advanced version of CyberZingFx Volume Plus, the ultimate MT4 indicator for traders seeking highly accurate buy and sell signals. With an additional strategy and price action dot signals that enhances its effectiveness, this indicator offers a superior trading experience for professionals and beginners alike. The CyberZingFx Volume Plus Advanced version combines the power of volume analysis and historical price data with an additional strategy, resulting in even more precise and reliable signals
    This indicator show you the begin of the Trend by drawing (Up/Down) arrow. It works using compatibility of current fame and the next 3 frames to make it more professional and more profitable. Features:- Simply it gives you entry point as arrow (Buy / Sell) after candle closed. You can use it on time frames ( M1 , M5 , M15 , M30 ) are more profitable. You can use it on any currencies pair. It is historical indicator. No Repaint. No additional indicator needed. Easy to use. Indicator parameters:-
    To get a signal, the indicator uses the linear break formula, the signal is not redrawn, since no indicators based on the moving average are used to get the signal, only price values ​​and chart candles Indicator settings 1 Line for signal  - number of lines for forming a signal breakthrough 2 Up arrow colore - color of the up arrow 3 Down arrow colore - color of the down arrow 4 MTF period in minutes  - selection of the period for multi-timeframe display (in minutes) 5 UpArrowCode  - code of t
    Looking for a powerful yet lightweight swing detector that accurately identifies market structure turning points? Want clear, reliable buy and sell signals that work across any timeframe and any instrument? Buy Sell Arrow MT Swing is built exactly for that — precision swing detection made simple and effective. This indicator identifies Higher Highs (HH) , Higher Lows (HL) , Lower Highs (LH) , and Lower Lows (LL) with remarkable clarity. It is designed to help traders easily visualize market stru
    ゴールドラッシュ・トレンド・アロー・シグナル ゴールドラッシュ・トレンド・アロー・シグナル 指標は、XAU/USDにおける高速・短期スキャルパー向けに最適化された、正確でリアルタイムのトレンド分析を提供します。 1分足専用に設計されたこのツールは、明確なエントリーポイントを示す方向矢印を表示し、スキャルパーが変動の激しい市場状況でも自信を持って取引できるよう支援します。 この指標は、PRIMARY(主要)とSECONDARY(補助)のアラート矢印で構成されています。PRIMARYシグナルは、トレンドの方向転換を示す白と黒の方向矢印であり、SECONDARYシグナルは、PRIMARY矢印が示す方向を確認し、潜在的なエントリーポイントを示す青と赤の矢印です。 注意:トレンド方向の変化後にPRIMARYアラート矢印が1つだけ表示される場合、複数のSECONDARY青/赤矢印が表示される点に注意が必要です。SECONDARYシグナルは、シグナル基準を満たす任意のローソク足後に表示されます。したがって、長期的なトレンド移動の場合、画面に多くのSECONDARY矢印が表示されます(添付の
    Presenting one-of-a-kind Gann Indicator for XAUUSD IQ Gold Gann Levels is a non-repainting, precision tool designed exclusively for XAUUSD/Gold intraday trading. It uses W.D. Gann’s square root method to plot real-time support and resistance levels, helping traders spot high-probability entries with confidence and clarity. William Delbert Gann (W.D. Gann) was an exceptional market analyst whose trading technique was based on a complex blend of mathematics, geometry, astrology, and ancient calcul
    作者のその他のプロダクト
    We Trade Live Trend Levels  This indicator is a fantastic addition to the We Trade Live Trend Max this helps filter out noise and helps with better entries into a trade this add on is a must have and we use it all the time along side We Trade Live Trend Max this is a fantastic tool to help with entering a trade and exiting a trade,  This indicator Calculates  Volume strength  indicating levels of support and resistance for a trade, measures momentum in a market making buying or selling into the
    We Trade Live Trend Entry & Exit is another fantastic addition to the the We trade Live trend Indicator collection This Indicator works fantastically well with our other Indicators. This Indicator is primarily used to enter a trade & Exit a Trade , and to alert you when you could possibly take a short or long on a current trend , it provides alerts on when there is a change in direction on the trend you are trading but please make sure you take into account all variables, before entering a trade
    We Trade Live Trend Candle Stick can help identify potential trend in the market when  trading, spot market trends and predict future prices.  We Trade Live Trend Candle Stick has a smoother look, as it is essentially taking an average of the movement.   candles will  stay RED during a downtrend and Green during an uptrend . We believe It's useful for making candlestick charts more readable and trends easier to analyse. As a breakout trader you are looking for trades that are ‘breaking out’ of
    As a trader you are looking for to enter trades at the perfect time. This indicator takes advantage of any price action and indicates when a certain level has been made and a potential break out is going to be made. THIS IS BEST USED ON THE 1DAY CHART WITH WE TREND LIVE MAX  Check LTF (Check Long time frame) feature added to 5mins , 15mins, 30mins 1hr & 4Hr chart  which will check the trend on all frames times in particular the 4hr trend. so if a alert is received to buy or sell and the trend is
    Being   flat is a position   taken by a trader in Forex trading when s/he is unsure about the direction of currencies trading in the market. If you had no   positions   in the U.S. dollar or your long and short   positions   canceled each other out, you   would   be   flat   or have a   flat   book A   flat market   is one where there is little price movement; the   market   typically trades within a tight range, rather than forming a clear up or down trend. This indicator shows potential flat
    フィルタ:
    Zohra8x
    65
    Zohra8x 2021.04.17 16:39 
     

    ユーザーは評価に対して何もコメントを残しませんでした

    provo2020
    205
    provo2020 2021.04.07 20:09 
     

    ユーザーは評価に対して何もコメントを残しませんでした

    Kurran
    65
    Kurran 2021.04.05 14:00 
     

    ユーザーは評価に対して何もコメントを残しませんでした

    Rio
    14
    Rio 2021.04.05 01:02 
     

    ユーザーは評価に対して何もコメントを残しませんでした

    Shivam
    64
    Shivam 2021.04.04 15:41 
     

    ユーザーは評価に対して何もコメントを残しませんでした

    ImDaBoss
    372
    ImDaBoss 2021.04.04 13:34 
     

    ユーザーは評価に対して何もコメントを残しませんでした

    レビューに返信