Winshots ADX Trend
- インディケータ
- バージョン: 2.3
- アップデート済み: 18 3月 2024
- アクティベーション: 5

強いトレンドの方向に取引することは、リスクを減らし、潜在的な利益を増やします。一般に、平均方向性指数(ADX)は、価格が強くトレンドになっている時期を判断するために使用されます。多くの場合、それは究極のトレンド指標です!結局のところ、トレンドはあなたの友達かもしれませんが、それはあなたの友達が誰であるかを知るのに確かに役立ちます。
ADXは、トレンドの強さを定量化するために使用されます。 ADXの計算は、特定の期間における価格範囲の拡大の移動平均に基づいています。デフォルト設定は14バーですが、他の期間を使用することもできます。 ADXは、外国為替ペア、株式、投資信託、上場投資信託、先物、暗号通貨など、あらゆる取引手段で使用できます。
ADXは、ゼロの最低値から100の最高値までの範囲の値を持つ単一の線としてプロットされます。ADXは無指向性です。価格が上昇傾向にあるか下降傾向にあるかにかかわらず、トレンドの強さを記録します。標準のADXインジケーターは通常、ADXの派生元である2つの方向移動インジケーター(DMI)ラインと同じウィンドウにプロットされます。
ただし、標準のADXインジケーターを使用すると、すべての線がジグザグに交差するので少し混乱する可能性があります。それだけでなく、異なる時間枠に切り替えると、ADXラインが反対方向に交差する可能性があり、さらに混乱する可能性があります。
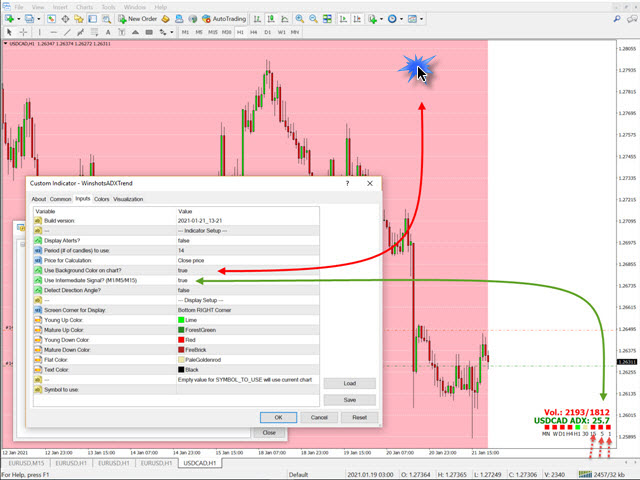
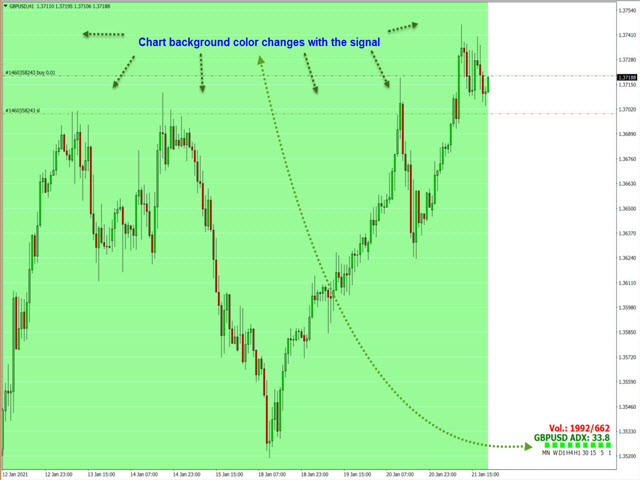
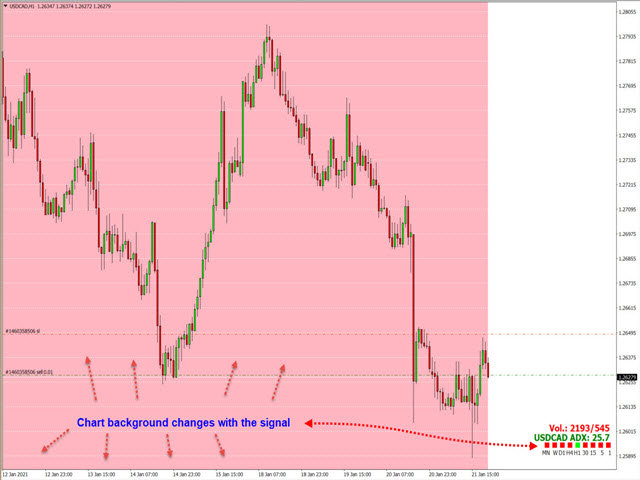
WinshotsADXトレンドインジケーターがこの問題を処理します。 1つの簡単なビューで、すべての時間枠でのADXトレンドの状態をすばやく判断できます。はい、あなたはそれを正しく読んだ。ホットスパゲッティのようにあらゆる方向に交差するADXラインを見て、さまざまな時間枠をクリックする必要はもうありません。 Winshots ADXトレンドインジケーターは、すべてのタイムフレームのトレンドを正確に表示するだけでなく、現在および前のバーの現在のチャートボリュームも表示します。この追加機能により、市場に強い勢いがあるかどうか、選択した時間内に取引する価値があるかどうかをすばやく判断できます。


I would rate 5 stars but it has issues that need to be fixed, such as it spamming a pop alert for the same currency pair 5 or 6 times in less than 1min.it also constantly has repetitive notifications every second, as I close the pop-up notifications and then a few seconds later it appears again.it needs a time delay in minutes between sending each notification.
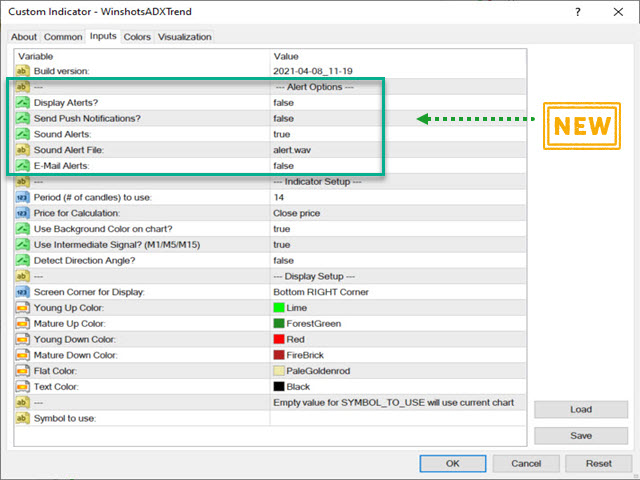
Can you add push notifications?
for the time being, I would not recommend this indicator for $30
4/12/20 Issues where addressed by developer so I update my rating to 5 stars
the only 1 request I have left it to be able to choose which time frames need to all align to get an alert. for example I want to get an alerts when M30 H1 H4 D1 all line up
I will update my review if he fixes these issues