YouTubeにあるマーケットチュートリアルビデオをご覧ください
ロボットや指標を購入する
仮想ホスティングで
EAを実行
EAを実行
ロボットや指標を購入前にテストする
マーケットで収入を得る
販売のためにプロダクトをプレゼンテーションする方法
MetaTrader 4のための新しいテクニカル指標 - 57

MT4のBinary Options Nuclear Masterで取引を強化しよう! バイナリーオプション取引を向上させたいですか? Binary Options Nuclear Master は、正確な10分間のウィンドウで取引機会を特定するために設計された究極のツールです。 2017年から2025年12月まで の平均勝率**72%**を持つこのインジケーターは、厳格なバックテストを経ており、市場の変化に応じて継続的に更新されています。 Binary Options Nuclear Masterを選ぶ理由は? 最適化された取引時間帯: 17:55から18:05 (MT4ブローカー時間)の間に取引を行い、最も効率的なタイミングで取引を行います。この短くても強力なウィンドウは、取引の成功を最大化するために設計されています。 精度設定: 正確な取引を行うためにM1タイムフレームを使用し、取引終了時間を 5分 に設定します。 事前アラート機能: Binary Options Nuclear Masterは、シグナルの前にアラート音と矢印を表示し、次

移動平均 (MA) インジケーターのマルチ通貨およびマルチタイムフレームの変更。ダッシュボードでは、インジケーターの現在の状態 (Fast MA と Slow MA のブレイクアウトとタッチ (価格別)、および MA ライン同士の交差 (移動平均クロスオーバー)) を確認できます。パラメーターでは、任意の通貨とタイムフレームを指定できます。また、インジケーターは、価格がラインに触れたことやラインが交差したことについて通知を送信できます。ピリオド付きのセルをクリックすると、このシンボルと期間が開きます。これは MTF スキャナーです。チャート上で複数のダッシュボードを実行できます。
インジケーターは、現在のチャートに Fast MA と Slow MA ラインを表示します。チャートの MA タイムフレームを選択し、他のタイムフレーム (MTF MA) から MA を監視できます。2 セットの MA のホットキーは、デフォルトでは「1」と「2」です。
ダッシュボードをチャートから非表示にするキーは、デフォルトでは「D」です。
パラメーター Fast MA Averag

外国為替インジケーターは、チャート上で価格の動きの方向を線の形でトレーダーに示すトレーディングシステムです。赤い線は下降トレンドの動きを示し、青い線は上昇トレンドの動きを示します。このインジケーターは、スキャルピングシステムとの取引に適しています。線が青で価格が線を下回っている場合に購入します。価格がラインを超えたら注文を閉じます。線が赤く、価格が線を上回っている場合は販売いたします。価格がラインを下回ったときに取引を終了します。これは非常に単純な取引戦略であり、初心者のトレーダーでも取引できます。
インジケーターパラメーター: period-トレンドを計算するための期間を変更します。パラメータ値が低いほど、チャート上のシグナルが多くなります。パラメータ値が高いほど、チャートに表示されるシグナルは少なくなります。 推奨事項: 時間枠M5、M30、H1 通貨ペア:GBPUSD、EURUSD、XAUUSD、AUDUSD、EURJPY。 一度に1つの取引のみを開きます。以前の取引を成立させた場合にのみ、新しい取引を開始します。
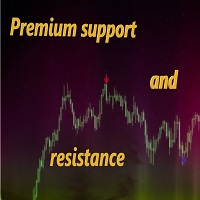
Premium support and resistance - the best combination of different indicators allowed us to create the best product on the market!
And that's Premium support and resistance!
A convenient and flexible tool that will help you in trading!
Shows where the price will go from the support and resistance levels!
The arrows Blue buy Red sell will help you with this!
Alert is already built into the indicator for your convenience!
Alert in order not to miss the "Own" signal!
It is already co

Klaus is an arrow indicator for identifying potential entry points. I like it, first of all, because it has a simple mechanism of work, adaptation to all time periods and trading tactics. Suitable for trading on small timeframes because it ignores sudden price spikes or corrections in price movement by reducing market noise around the average price. Forex indicator Klaus is a real trading strategy with which you can achieve the desired results. As soon as the Klaus indicator is installed, the m

The Private indicator displays information in a visual form. You can trade in any currencies, because the strategy is universal and shows entry signals, relying on price patterns. It smooths out price fluctuations when generating a signal by averaging the data and the signal only at certain moments! In those moments when you need to make a decision to enter a position and give the trader a direction. The indicator can work both for entry points and as a filter. The indicator gives the trader th
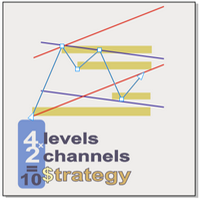
Supply and demand In all indicators that have the task of drawing support and resistance, the number of levels is so high that it causes a trader to make a mistake. We draw the last 4 important and valid levels for you using the Price Action method These surfaces are not easily broken and their breaking is done with long and powerful candlesticks Sometimes traders draw levels and wait for the price to reach those levels, but new levels may be created between the previous two levels in the f

The indicator shows De Mark patterns and gives trading signals in the form of arrows and alerts. Shows De Mark lines on the history of quotes. Has a multiframe., Can show DeMark patterns of higher timeframes on lower timeframes. Has a switchable function for displaying fractals. Trading signals are accompanied by sound alerts, as well as sending them to mail and mobile devices.

TrendControl is an arrow indicator of technical analysis for determining a trend, which can adjust to the price, is a graphical plot calculated using mathematical formulas, the initial data for which is a price chart. The indicator shows the direction of the trend, takes into account the minimum and maximum values of the extreme candles on the chart, then brings them to the average and compares them with the past data.
The principle of operation of the indicator is to automatically determin

All traders should know the trend before making their decision when placing the buy or sell orders. The first step always starts with supply and demand , rising and falling channels , trend lines, engulfing candles etc. All the above contribute to what is called “Price Action” and that is the best and most reliable way in trading and catching the trend and making profits, without stress. The Investment Castle Trend Line Indicator will automatically draw the trend lines on the MT4 for you. An
FREE

VictoryTMA (Triangular Moving Average) is a channel indicator without redrawing, built on the basis of moving averages. The key difference of the VictoryTMA indicator from other channel indicators (for example, from the same Bollinger) is that VictoryTMA does not take into account simple moving averages, but twice smoothed, which, on the one hand, allows you to more clearly determine the market movement, but the other hand, makes the indicator less sensitive.

Whether you are a scalper or daily trader, you will always look for bullish / bearish engulfing candles. This can be a bit tricky and stressful when you try to visually identify the engulfing candles on the chart. Not only that, you might be trading on the M15 time frame but the engulfing candle is forming or has already formed in the H4 time frame. This indicator is made to do that on your behalf. You can trade on any time frame and see Engulfing candles of another time frame, this means that y
FREE
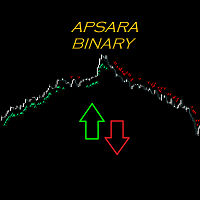
This indicator allows you to trade binary options and specially programmed to get the momentum to follow the trend that is happening in the live market. This indicator is based on trend strength, price correction and advanced technical analysis,this is 100% NO REPAINT. This indicators specifically for manual trading, I suggest using a platform that uses an expiration time Timeframe : M1 or M5 Expired Time : 1 Candle Pair : Any ( even better in the CAD market ) Time Session : Europe and NewY
The indicator shows entry points taking into account the trend, has flexible settings for filtering and aggressiveness of signals. The trend is set using four configurable movings with a rising period. Signals are filtered at the best price to enter. There are switches for this. The indicator does not redraw signals on history, gives sound signals and supports sending messages to mail and Push messages to mobile devices.
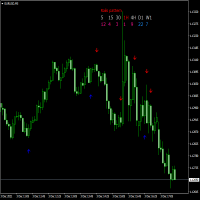
The RAILS indicator is the identification of the candlestick analysis pattern - Price Action. It signals an imminent price reversal or pullback. The main feature is the identification of candle combinations. In this case, the indicator is looking for two adjacent candles that are directed in different directions. In the upper part there is an information panel where information about different timeframes and identified "Rails" paptterns. There is also information - how many bars to that the pat
The indicator may be of interest to traders who use Fibonacci and Gann levels in their trading. The construction of levels is set by the range of the previous day. It is possible to set colors and styles of all lines in the indicator. It is possible to switch the view mode using buttons on the chart. The indicator practically does not load the terminal as it is recalculated either on a new bar or when switching buttons.
The indicator calculates the probability of a price reversal for a given size of price movement based on historical data. Made in a multicurrency version. When the price reversal probability specified in the properties is reached, the indicator emits a sound signal. It can display a table of the probability of reversals for several specified price movements for all instruments. Has the function of recording statistics of historical data in a CSV file, for viewing in Excel.

The MyEwo indicator is a tool that helps you to find the short maturity direction in your chart. Default input values are frequently used values in this indicator. You can find and use your own values according to your own trend detection and pairs you will trade.
My advice is to use a moving average in order to understand the long maturity trend on your main graph (200 and higher may be appropriate). The M5 graphics will be simplify Scalping style Trade transactions that you will use . You can
Nobilis AI. Интеллектуальная торговая система.
это готовая торговая система для работы на любом инструменте и любом таймфрейме.
Полностью готова для ручной торговли и использовании в роботах Канал не перерисовывается Сигналы не перерисовываются Интеллектуальный расчет сигналов под каждый инструмент и таймфрейм Рассчитывает и показывает торговые позиции Подбирает наилучшие торговые параметры 10000 активаций
Удобно работать на всех таймфреймах от M1 до W1.
Протестировано на металлах, валю
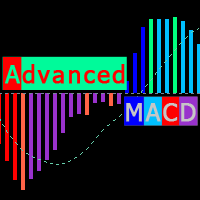
Modified MACD, for technical analysis of charts, with color backlight of histogram signals. The indicator highlights, the direction of the histogram movement, the change in the direction of the histogram movement, the histogram peaks, the interaction of the histogram and the signal curve. Also, the indicator makes it easier to find convergences / divergences between bars and the histogram (which serve as a powerful signal in some trading systems using the MACD indicator). Color designation of Ad

Hi, You can find the perfect buy sell signal with this indicator including trend line. This indicator providing signal based on some calculation of multiple moving averages. it gives arrow for buy and sell signal with color change in trend line. all the colors can be customize. For exit point you can use RSI indicator(14) along with this. I am attaching image for for your reference. Best Pair for this indicator :- EURUSD , USDCHF. Basic details of entry and exit :- Buy Entry :- Enter in the mark

The indicator determines the trend and its direction. At the same time, it shows
the oversold and overbought zones. Thus, it determines the most profitable
places to open a position. The indicator can be used as a filter and complement
to any strategy. It can also be used as an independent tool.
Advantages
The indicator does not redraw the values. Works on all available tools. Works on all periods. It has a minimum of settings. The ability to use it as a primary and auxiliary indicato

SF TREND SIGNAL - уникальный индикатор использующий несколько входных данных для определения тенденции, и сигнала для входа в сделку, в ее направлении. Подходит для любой валютной пары, любого таймфрейма, и не меняет свои показания. Индикатор очень прост в настройке, что является хорошим преимуществом для исследований.
Параметры индикатора Основные настройки ( Main Settings ): SlowPeriod - период для расчета тенденции. FastPeriod - период для расчета сигнала. SlowSmooth - сглаживание значен
Gamma Signal - индикатор предназначенный для поиска локальных экстремумов, определения текущей тенденции. В расчетах индикатора используется авторская методика. С помощью индикатора можно определять места возможного разворота цены желательно в направлении тенденции, но также с достаточной точностью и против нее. Также с помощью индикатора можно определять текущую тенденцию. Индикатор подходит для любых валютных пар, но для адекватного отображения показания необходимо, чтобы было достаточно ист

ContiStat restricted - Free DEMO version of the ContiStat indicator
Free version of the indicator is ment as DEMO of full paid version. Full functionality is available, however The indicator work only on M30 chart period . Find the ContiStat indicator for full functionality
Brief description The ContiStat indicator calculate statistic frequency of green (up) and red (down) movement in the chart and determine movement dynamics (silver curve). There are two key parameters to understand the Cont
FREE

Big Trend Signal indicator is designed for trend and signal trading. This indicator generates trend signals. It uses many algorithms and indicators to generate this signal. It tries to generate a signal from the points with the highest trend potential. This indicator is a complete trading product. This indicator does not need any additional indicators. You can only trade with this indicator. The generated signals are displayed on the graphical screen. Thanks to the alert features you can ge
Safe Signal Arrows indicator is designed for trend and signal trading. This indicator generates trend signals. It uses many algorithms and indicators to generate this signal. It tries to generate a signal from the points with the highest trend potential. This indicator is a complete trading product. This indicator does not need any additional indicators. You can only trade with this indicator. The generated signals are displayed on the graphical screen. Thanks to the alert features you can

Perfect Trade System indicator is designed for trend and signal trading. This indicator generates trend signals. It uses many algorithms and indicators to generate this signal. It tries to generate a signal from the points with the highest trend potential. This indicator is a complete trading product. This indicator does not need any additional indicators. You can only trade with this indicator. The generated signals are displayed on the graphical screen. Thanks to the alert features you ca
Real Signal System indicator is designed for trend and signal trading. This indicator generates trend signals. It uses many algorithms and indicators to generate this signal. It tries to generate a signal from the points with the highest trend potential. This indicator is a complete trading product. This indicator does not need any additional indicators. You can only trade with this indicator. The generated signals are displayed on the graphical screen. Thanks to the alert features you can
This Pro Trade Signal Arrow indicator is designed for trend and signal trading. This indicator generates trend signals. It uses many algorithms and indicators to generate this signal. It tries to generate a signal from the points with the highest trend potential. This indicator is a complete trading product. This indicator does not need any additional indicators. You can only trade with this indicator. The generated signals are displayed on the graphical screen. Thanks to the alert features y

Perfect Real Trade System indicator is designed for trend and signal trading. This indicator generates trend signals. It uses many algorithms and indicators to generate this signal. It tries to generate a signal from the points with the highest trend potential. This indicator is a complete trading product. This indicator does not need any additional indicators. You can only trade with this indicator. The generated signals are displayed on the graphical screen. Thanks to the alert features y
Pro Trend Tracking indicator is designed for trend and signal trading. This indicator generates trend signals. It uses many algorithms and indicators to generate this signal. It tries to generate a signal from the points with the highest trend potential. This indicator is a complete trading product. This indicator does not need any additional indicators. You can only trade with this indicator. The generated signals are displayed on the graphical screen. Thanks to the alert features you can
Advanced Entry Signal Arrows indicator is designed for trend and signal trading. This indicator generates trend signals. It uses many algorithms and indicators to generate this signal. It tries to generate a signal from the points with the highest trend potential. This indicator is a complete trading product. This indicator does not need any additional indicators. You can only trade with this indicator. The generated signals are displayed on the graphical screen. Thanks to the alert feature

Gvs Undefeated Trend indicator is designed for trend and signal trading. This indicator generates trend signals. It uses many algorithms and indicators to generate this signal. It tries to generate a signal from the points with the highest trend potential. This indicator is a complete trading product. This indicator does not need any additional indicators. You can only trade with this indicator. The generated signals are displayed on the graphical screen. Thanks to the alert features you ca
Super Strong Trade Signals indicator is designed for trend and signal trading. This indicator generates trend signals. It uses many algorithms and indicators to generate this signal. It tries to generate a signal from the points with the highest trend potential. This indicator is a complete trading product. This indicator does not need any additional indicators. You can only trade with this indicator. The generated signals are displayed on the graphical screen. Thanks to the alert features
Super Cross Trend Tracking indicator is designed for trend and signal trading. This indicator generates trend signals. It uses many algorithms and indicators to generate this signal. It tries to generate a signal from the points with the highest trend potential. This indicator is a complete trading product. This indicator does not need any additional indicators. You can only trade with this indicator. The generated signals are displayed on the graphical screen. Thanks to the alert features

Strong Runner Trade System indicator is designed for trend and signal trading. This indicator generates trend signals. It uses many algorithms and indicators to generate this signal. It tries to generate a signal from the points with the highest trend potential. This indicator is a complete trading product. This indicator does not need any additional indicators. You can only trade with this indicator. The generated signals are displayed on the graphical screen. Thanks to the alert features

Brief description The ContiStat indicator calculate statistic frequency of green (up) and red (down) movement in the chart and determine movement dynamics (silver curve). There are two key parameters to understand the ContiStat principle: Block height and Block count . The ContiStat engine convert instrument price chart move to Blocks of constant height (price) regardles of how much time it take. Example 1: Block height is set to 50. DE30 index price make move from 15230 to 15443 in an hour. 4 g
Pro Trend Signal System indicator is designed for trend and signal trading. This indicator generates trend signals. It uses many algorithms and indicators to generate this signal. It tries to generate a signal from the points with the highest trend potential. This indicator is a complete trading product. This indicator does not need any additional indicators. You can only trade with this indicator. The generated signals are displayed on the graphical screen. Thanks to the alert features you

This indicator Super Neuro Trend indicator.Indicator displays trend movement. Indicator helps to buy and sell. Features FiltPer- displays indicator period. deviation - displaus indicator deviation. Trend - displaus indicator trend.( true,false) Rectangle - displaus indicator rectangle. (true,false)
How to understand the status: If the trend color is green, trend is up. I f the trend color is red, trend is down. I f the trend waiting,trend waiting.
/////////////////////////////////////////

Alan Hull's moving average, more sensitive to the current price activity than the normal MA. Reacts to the trend changes faster, displays the price movement more clearly. My HMA indicator is the developed state of the standard HMA indicator. The indicator is Non Repaint Version. The indicator shown in a separate window is worth the value of -1 to 1. Default entries will give better results in the M15 chart for the parities. With different entry values, you can also get better results in differen

This indicator Mega Super Neuro Trend indicator.Indicator displays trend movement. Indicator helps to buy and sell.Trend1= line1 > < line1,trend2=line1 > < line2,trend3 = line1,line2 > < line3. Features Trend - displaus indicator trend.( true,false)
How to understand the status: If the trend color is green, trend is up. I f the trend color is red, trend is down.
////////////////////////////////////////////////////////////////////////////////////////////////////////////////////////////////
53% OFF until December 31 (Normal price $125)! Don't miss the opportunity to have this invaluable tool! This is a totally automated multi timeframe support and resistance levels finder on every MT4 chart. No manual work! Just drop this indicator on a chart and you will have the S/R levels always up to date. It is very convenient and helps the trader to anticipate possible stalls and reversions in price movements. The levels are displayed as lines and each timeframe has a different color.
The
Alpha Signal - индикатор предназначенный для поиска локальных экстремумов, определения текущей тенденции. В расчетах индикатора используется авторская методика. С помощью индикатора можно определять места возможного разворота цены желательно в направлении тенденции, но также с достаточной точностью и против нее. Также с помощью индикатора можно определять текущую тенденцию. Индикатор подходит для любых валютных пар, но для адекватного отображения показания необходимо, чтобы было достаточно ист

Beta Signal - индикатор предназначенный для поиска локальных экстремумов, определения текущей тенденции. В расчетах индикатора используется авторская методика. С помощью индикатора можно определять места возможного разворота цены желательно в направлении тенденции, но также с достаточной точностью и против нее. Также с помощью индикатора можно определять текущую тенденцию. Индикатор подходит для любых валютных пар, но для адекватного отображения показания необходимо, чтобы было достаточно исто
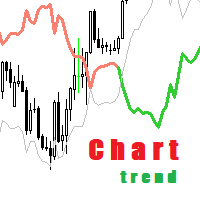
Определения текущей тенденции одна из самых важных задач трейдера не зависимо от стиля торговли. Индикатор Chart Trend поможет с достаточно высокой вероятностью это сделать. Chart Trend - индикатор распознавания тенденции, использующий авторский алгоритм расчета. Индикатор подходит для любой валютной пары, любого таймфрейма, и не меняет свои показания.
Параметры индикатора Основные настройки ( Main Settings ): HistoryBars - количество баров для отображения. CalcMode - выбор метода р

Определения текущей тенденции одна из самых важных задач трейдера не зависимо от стиля торговли. Индикатор Good Ribbon поможет с достаточно высокой вероятностью это сделать.
Good Ribbon - авторский индикатор основан на усреднении ценовых значений по уникальной методике. Индикатор подходит для любой валютной пары, любого таймфрейма, и не меняет свои показания.
Параметры индикатора Основные настройки ( Main Settings ): HistoryBars - количество баров для отображения. IndicatorID - иден

Pro Price Trading indicator is designed for trend and signal trading. This indicator generates trend signals. It uses many algorithms and indicators to generate this signal. It tries to generate a signal from the points with the highest trend potential. This indicator is a complete trading product. This indicator does not need any additional indicators. You can only trade with this indicator. The generated signals are displayed on the graphical screen. Thanks to the alert features you can g

This indicator shows in a subwindow the trend in M1, M5, H1, D1 timeframes based on MA, MACD, Stochastic This way you could see in once in different timeframes what happening. This is my first free indicator. Please follow I will put here some more. Thank you for you attention. . . . . .
lfknglkslksnlgslgnsflgjrpoesv ,msv lkrjpfjésmdg sd.npo4wsmdglknsp4jwpkeégmfs.lkmp Thank you
FREE
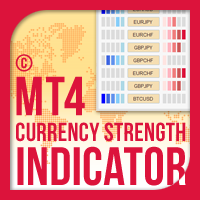
MT4の通貨強度インジケーター は、初心者またはエキスパートトレーダーにとって革新的なソリューションです!通貨の強さの概念は、価格アクションと組み合わされ、8つの主要通貨の通常の28の組み合わせを除いて、任意のシンボル/ペアに適用できるため、まったく新しいレベルになります。つまり、すべての通貨、メジャー、マイナー、エキゾチック、コモディティ、クリプト(インデックスではない)を含む、任意のペアの長所または短所をトレードできます。これは、複雑な強度線を解読したり、複雑な強度線を解読したりすることなく、任意のペアの2つの部分の強度/弱さのバランスを視覚的に通知する色付きのバーを使用することにより、32個のシンボルを一目で明確に把握できる画期的な製品です。他の従来の通貨強度ソリューションと同様に、ヒストグラム。
MT4の通貨強度インジケーター は、あなたが注目し、最も取引したいペアを追加することにより、あなたの個人的な好みに合わせて32のシンボルボタンを構成するオプションを提供します。このように、あなたは一目であなたのチャート上で現在の市場の全体像を見ることができるので、あなたは機会を逃
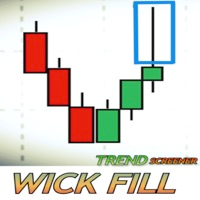
トレーディングにおけるウィックとは何ですか?このスクリーナーはどのように機能するのですか? ローソク足におけるウィックは、価格の拒否反応を反映しています。このスクリーナーは埋められる大きな可能性を持つウィックを識別しようとしています。このスクリーナーは、トレンド市場で発生するウィックに焦点を合わせています。
このスクリーナーは、ライブで取引されている潜在的なウィックの全体像を提供するダッシュボードを表示します。それは、時間枠によって整理されたすべてのペア/インスツルメンツを示しています。買いのチャンスは「UP-W」と名付けられます。彼らはダッシュボード上で緑色に表示され、売りの機会は、''DN-W''と名付けられ、赤で表示されます。トレーダーは画面に表示されたダッシュボード上で希望のウィック機会をクリックする必要があり、スクリーナーはその特定のトレードを表示します。スクリーナーは、トレーダーが選択したインプットに基づき、機会を表示します。金やUS30などの商品は、通常、ブローカーによって契約サイズが異なることに注意してください。同じコントラクトサイズのペアまたは商品を使用するよう

This indicator is based on Bulls and Bears oscillators, both exposed on Dr. Alexander Elder's book: "Come into my trading room". "Elder Ray" was made with the purpose of identify bulls and bears pressure in the markets. The indicator is basically the union of this two mentioned oscillators but on an efficient way to facilite getting price patterns, divergences, etc. Default parameter is EMA 13.
FREE

Trade Invest Pro - Boss in the world of cryptocurrency!
This indicator is ideal for cryptocurrency trading!
Work on Trade Invest Pro took us half a year!
But not in vain! Now only accurate signals near support - resistance levels!
He showed himself well on timeframes m5 m15 for binary options!
Optionally, it can be configured for forex for timeframes m30 and more!
Reacts well to news!
Doesn't paint! and does not disappear from the schedule!
As soon as a red arrow appears, open a

The Control indicator is used in the Forex markets. One of the main definitions for monitoring the currency market is a trend that is why the Control indicator was created in order to display the trend in a visual form. You should use the indicator as an additional one, that is, you need to use this indicator, for example, for the perfect display of price movements!
Control is a trend indicator, a technical analysis tool that helps to determine the exact direction of the trend: either the upw

The Avengers trend indicator is used to determine the strength and direction of a trend and to find price reversal points. The indicator is used in the forex markets. Created to visualize the trend. One of the main definitions for monitoring the currency market is trend. Flexible settings of the Avengers trend indicator allow you to receive more accurate signals for opening positions.
The trend can be ascending (bullish trend) and decreasing (bearish trend). In most cases, the trend grows for

Looking for a quality pivot point indicator? So Prosecution is what you need! To identify pivot points, the Prosecution indicator analyzes many conditions, as the aggregate analysis provides a more accurate picture of the market situation.
What are pivot points? Pivot point analysis is often used in conjunction with the calculation of support and resistance levels, as is the case with trend line analysis. When analyzing pivot points, the first support and resistance levels are calculated usin
Magic Levels for MT4 by Jeanne Soft The Magic Levels indicator was created to solve three important tasks of successful trading: 1) construction of the nearest support and resistance levels for the selected timeframe, 2) timely identification of situations when the instrument is overbought or oversold, 3) indication of the probable trend reversal points. The indicator allows you to significantly save time analyzing the current situation on the selected instrument and contributes to making the ri
The indicator highlights the value in "over Sold" and "over Bought" zones. in addition, arrow indicates the return of the value from the extreme zone. Indicator can be easily customized by the user including change of colors, with, levels and arrows. Combination with other market signals and analysis is necessary and provides more stable results. Alert is also available for user.
FREE
The SmartZigZag indicator is a generated system for successful trading, consisting of two indicators - a modified ZigZag and a trend indicator. The system automatically determines the expected reversal levels of the chart price, and also, using the Alert function, gives signals about a favorable situation for buying or selling. Has simple and straightforward settings. It can work in all foreign exchange and non-foreign exchange markets. Any timeframe.
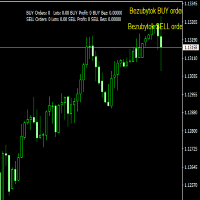
The Breakeven indicator is based on determining the breakeven levels of orders for a given instrument.
The indicator draws the breakeven level of BUY orders, the breakeven level of SELL orders.
If the number of lots between BUY orders and SELL orders between each other, the indicator draws the ALL breakeven level.
Drawing of levels is disabled in the indicator menu.

VWAP Bands gives you the regular Volume-Weighted Average Price and also the deviation bands.
Use this indicator to see the possible amount of market movement, find support and resistance lines, find good spots for entry and exit, and the most important feature is to find possible pivot points.
This indicator has been mathematically improved by Rira team. The calculation begins at the start of each trading day

Price reach indicator. It also serves as the perfect term for supports and resistance. I use it in two experts. The basic tool for professional trading. The indicator analyzes the last 500 bar and uses this to determine the levels ( but it doesn't predict the future ) . Personally, I use it on TF H1. It is very simple. Four lines on chart and that's all. Only two input parameters. Thousands of indicators. Why this? Is good ? No! Is very good. Please test the indicator prior to purchasing.
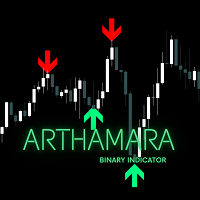
This indicator allows you to trade binary options . based on Bollinger bands and advanced technical analysis, this indicator is 100% NO REPAINT. This indicator is specifically for manual trading Timeframe : M5 / M15 or Higher Expired Time : 1 Candle Pair : Any Arrow Type : Current bar Alert : Current bar / Close Bar INDICATOR PARAMETER BBands Period ( Custom BBands Indicator) BBands Price BBands Deviation Signal Filter ( Level 1 - 3 ) you can use Supply n demand zone , SnR indicator , Auto
Highly configurable MFI indicator. Features: Highly customizable alert functions (at levels, crosses, direction changes via email, push, sound, popup) Multi timeframe ability Color customization (at levels, crosses, direction changes) Linear interpolation and histogram mode options Works on strategy tester in multi timeframe mode (at weekend without ticks also) Adjustable Levels Parameters:
MFI Timeframe: You can set the current or a higher timeframes for MFI. MFI Bar Shift: you can set th
FREE
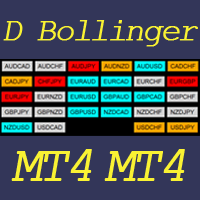
This indicator helps to visualize the Bollinger Band status of 28 pairs. With the feature of color panel, alert, and notification features, user can catch the potential Bollinger Bounce opportunities from 28 main pairs on one Dashboard quickly. Dashboard Bollinger Band is an intuitive and handy graphic tool to help you to monitor all 28 pairs and provide trading signals based on the Bollinger Bounce Rules (Overbought/Oversold and Bollinger Band Cross). COLOR LEGEND:
clrOrange: price is above th
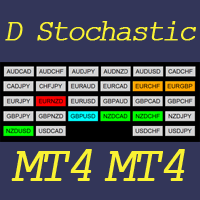
This indicator helps to visualize the Stochastic status of 28 pairs. With the feature of color panel, alert, and notification features, user can catch the potential buy and sell opportunities when the 28 main pairs cross the oversold/overbought area on one Dashboard quickly.
Dashboard Stochastic is an intuitive and handy graphic tool to help you to monitor all 28 pairs and provide trading signals based on the Stochastic Classic Rules (Overbought/Oversold and Stochastic Cross).
COLOR LEGEND:
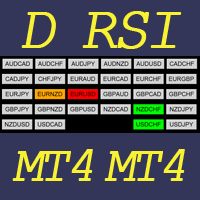
This indicator helps to visualize the RSI status of 28 pairs. With the feature of color panel, alert, and notification features, user can catch the potential buy and sell opportunities when the 28 main pairs cross the oversold/overbought area on one Dashboard quickly. Dashboard RSI is an intuitive and handy graphic tool to help you to monitor all 28 pairs and provide trading signals based on the RSI Rules (Overbought/Oversold and Stochastic Cross). COLOR LEGEND:
clrOrange: RSI signal is above t
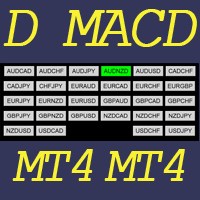
This indicator helps to visualize the MACD status of 28 pairs. With the feature of color panel, alert, and notification features, user can catch the potential buy and sell opportunities when the 28 main pairs’ fast EMA cross the slow EMA on one Dashboard quickly. Dashboard MACD is an intuitive and handy graphic tool to help you to monitor all 28 pairs and provide trading signals based on the MACD Rules (Fast EMA Cross Slow). COLOR LEGEND: clrRed: MACD fast EMA down cross MACD slow EAM and MACD f
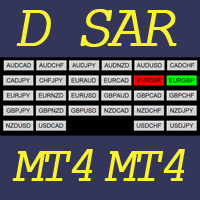
This indicator helps to visualize the SAR status of 28 pairs. With the feature of color panel, alert, and notification features, user can catch the potential buy and sell opportunities when the 28 main pairs’ SAR dots are switching between the above/below of candles on one Dashboard quickly. Dashboard SAR is an intuitive and handy graphic tool to help you to monitor all 28 pairs and provide trading signals based on the SAR Rules (SAR dots are switching between the above/below of candles). COLOR
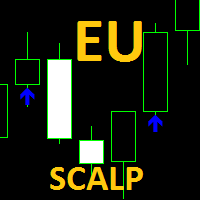
アラート付きのスキャルピングインジケーター:
EU頭皮インジケーターは2つのワーキングセットの組み合わせです。1つは価格変動の方向に逆らって機能するように事前設定されており、2つ目は価格変動またはブレイクアウトが発生する確率に基づいて価格変動の方向に取り組んでいます。重要な貿易レベル。
デフォルト設定は、EurUsdペアM5タイムフレーム用に最適化されています。その他の設定は、最初のコメントの「コメント」セクションにあります。
期待される結果と取引レベルの値を取得したい場合は、チャートにロットziseの推奨事項が表示されます。トレードレベルも線としてチャートに描かれます。
インジケーターは、価格がアクティブな取引レベルの1つに達したときにアラートを送信するように事前設定されており、矢印は買い(青)または売り(赤)を示し、注文を閉じる必要がある場合も示します。注文アラートは、新しいろうそくが表示され、最後のろうそくの本体によって取引レベルが破られた場合にのみアクティブになります。
この指標のように機能するエキスパートアドバイザーは、私の売り手プロファイルにあり、さら
FREE
MetaTraderマーケットはMetaTraderプラットフォームのためのアプリを購入するための便利で安全な場所を提供します。エキスパートアドバイザーとインディケータをストラテジーテスターの中でテストするためにターミナルから無料のデモバージョンをダウンロードしてください。
パフォーマンスをモニターするためにいろいろなモードでアプリをテストし、MQL5.community支払いシステムを使ってお望みのプロダクトの支払いをしてください。
取引の機会を逃しています。
- 無料取引アプリ
- 8千を超えるシグナルをコピー
- 金融ニュースで金融マーケットを探索
新規登録
ログイン