#include <Graphics\Graphic.mqh>
#include <Math\Stat\NegativeBinomial.mqh>
#include <Math\Stat\Math.mqh>
#property script_show_inputs
//--- 入力パラメータ
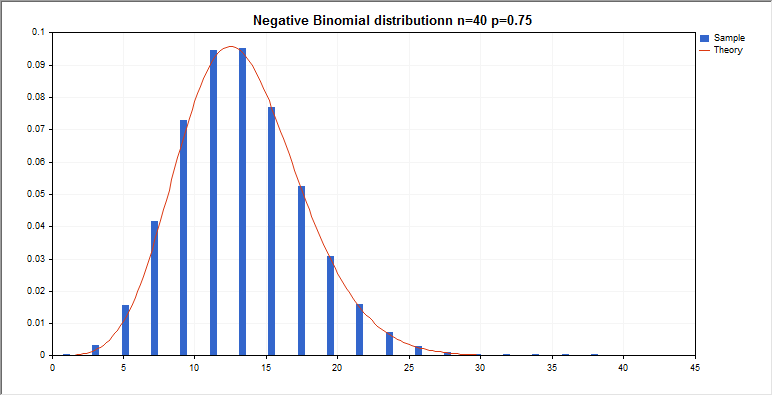
input double n_par=40; // テスト数
input double p_par=0.75; // 各テストの成功率
//+------------------------------------------------------------------+
//| スクリプトプログラムを開始する関数 |
//+------------------------------------------------------------------+
void OnStart()
{
//--- 価格チャートを非表示にする
ChartSetInteger(0,CHART_SHOW,false);
//--- 擬似乱数生成器を初期化する
MathSrand(GetTickCount());
//--- 確率変数のサンプルを生成する
long chart=0;
string name="GraphicNormal";
int n=1000000; // サンプルの値の数
int ncells=19; // ヒストグラムの間隔の数
double x[]; // ヒストグラム間隔の中心
double y[]; // 間隔内のサンプルからの値の数
double data[]; // 確率変数値のサンプル
double max,min; // サンプルの最大値と最小値
//--- 負の二項分布からサンプルを取得する
MathRandomNegativeBinomial(n_par,p_par,n,data);
//--- ヒストグラムをプロットするためのデータを計算する
CalculateHistogramArray(data,x,y,max,min,ncells);
//--- [min、max]の間隔で理論的に計算されたデータを取得する
double x2[];
double y2[];
MathSequence(0,n_par,1,x2);
MathProbabilityDensityNegativeBinomial(x2,n_par,p_par,false,y2);
//--- 規模を設定する
double theor_max=y2[ArrayMaximum(y2)];
double sample_max=y[ArrayMaximum(y)];
double k=sample_max/theor_max;
for(int i=0; i<ncells; i++)
y[i]/=k;
//--- チャートを出力する
CGraphic graphic;
if(ObjectFind(chart,name)<0)
graphic.Create(chart,name,0,0,0,780,380);
else
graphic.Attach(chart,name);
graphic.BackgroundMain(StringFormat("Negative Binomial distributionn n=%G p=%G",n_par,p_par));
graphic.BackgroundMainSize(16);
//--- カーブをプロットする
graphic.CurveAdd(x,y,CURVE_HISTOGRAM,"Sample").HistogramWidth(6);
//--- 今度は分布密度の理論曲線をプロットする
graphic.CurveAdd(x2,y2,CURVE_LINES,"Theory").LinesSmooth(true);
graphic.CurvePlotAll();
//--- カーブをプロットする
graphic.Update();
}
//+------------------------------------------------------------------+
//| データセットの頻度を計算する |
//+------------------------------------------------------------------+
bool CalculateHistogramArray(const double &data[],double &intervals[],double &frequency[],
double &maxv,double &minv,const int cells=10)
{
if(cells<=1) return (false);
int size=ArraySize(data);
if(size<cells*10) return (false);
minv=data[ArrayMinimum(data)];
maxv=data[ArrayMaximum(data)];
double range=maxv-minv;
double width=range/cells;
if(width==0) return false;
ArrayResize(intervals,cells);
ArrayResize(frequency,cells);
//--- 間隔の中心を定義する
for(int i=0; i<cells; i++)
{
intervals[i]=minv+(i+0.5)*width;
frequency[i]=0;
}
//--- 間隔内に入る頻度を記入する
for(int i=0; i<size; i++)
{
int ind=int((data[i]-minv)/width);
if(ind>=cells) ind=cells-1;
frequency[ind]++;
}
return (true);
}
|