ATR Monitor EA Friendly
- Indicatori
-
Flavio Javier Jarabeck
 We are a closed brotherhood of traders whose ultimate goal is to profit through well-studied, structured, and automated trades. As a result, we publish dozens of MT5 indicators (FREE and paid) to the global MQL5 community. 80% of our published products are high-quality free indicators so beginner
 - Versione: 1.1
- Aggiornato: 6 giugno 2020
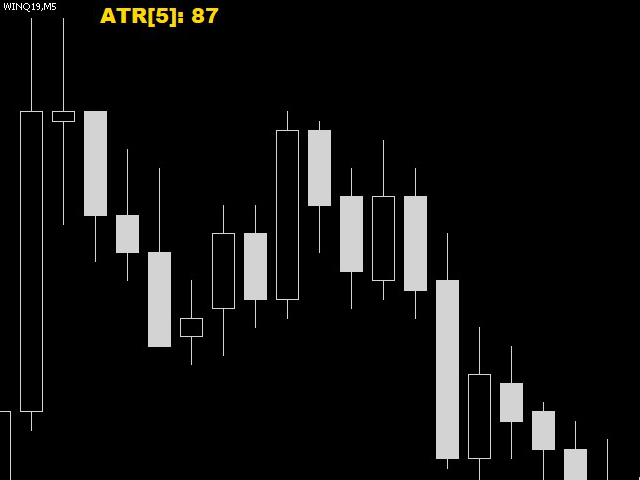
ATR is a measure of volatility introduced by market technician J. Welles Wilder Jr. in his book, "New Concepts in Technical Trading Systems".
In general, traders are accustomed to seeing the ATR in the form of a sub-window indicator. What I am presenting here is a simplified version of ATR - just the current ATR number - very useful for monitoring just the very moment of the current chart. And, by default, this indicator will not show up on screen, you can just use the buffers themselves.
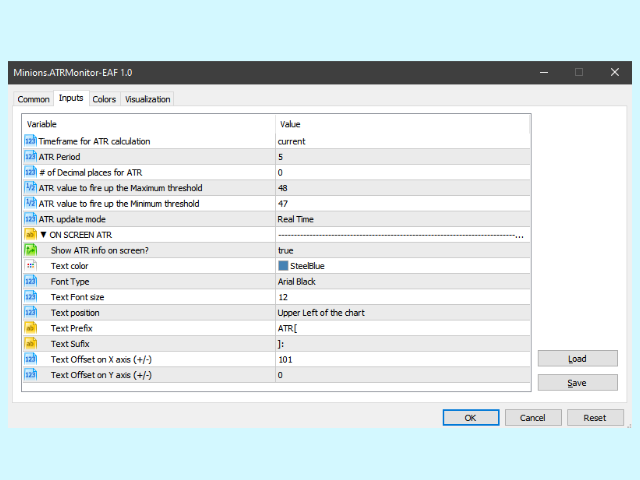
FEATURES
- Timeframe to monitor (this number will appear in brackets if desired)
- ATR period for calculation
- Number of decimal places to show up (if applicable)
- ATR value to fire up the Maximum threshold
- ATR value to fire up the Minimum threshold
- ATR update Mode: Candle by Candle; or Real Time
- ON SCREEN ATR INFO:
- Show ATR information on Screen?
- Font size of the ATR Monitor
- Font Type
- Font Color
- Font Size
- Text anchor position
- Position on screen (X,Y padding)
- Preffix and Suffix setting
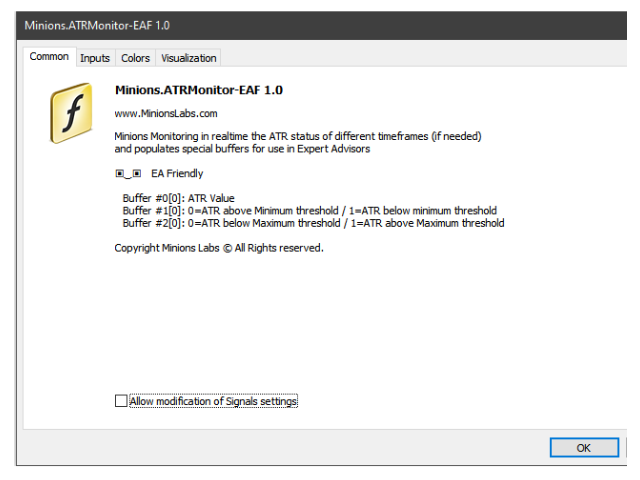
USAGE
- Buffer #0 is responsible for the ATR value.
- Buffer #1 is responsible to get the value of (1=ON / 0=OFF) if the Low threshold was reached.
- Buffer #2 is responsible to get the value of (1=ON / 0=OFF) if the High threshold was reached.
Since this indicator is highly optimized, only the last ATR number is available, so NO big buffers are used to store ATR numbers. Just read buffers #0, #1 and #2 in its 0 (zero) index that you will get it done!
To ADD more than one indicator in the same chart, just add it to your chart and CHANGE the ATR Period, this way the indicator will create a second version of itself.
If you like this indicator, all I am asking is a little Review (not a Comment, but a REVIEW!)...
This will mean A LOT to me... And this way I can continue to give away Cool Stuff for Free...
With No Strings Attached! Ever!
Live Long and Prosper!
;)
L'utente non ha lasciato alcun commento sulla valutazione.