Trendometer
- Indicatori
- Versione: 1.64
- Aggiornato: 3 aprile 2020
- Attivazioni: 10

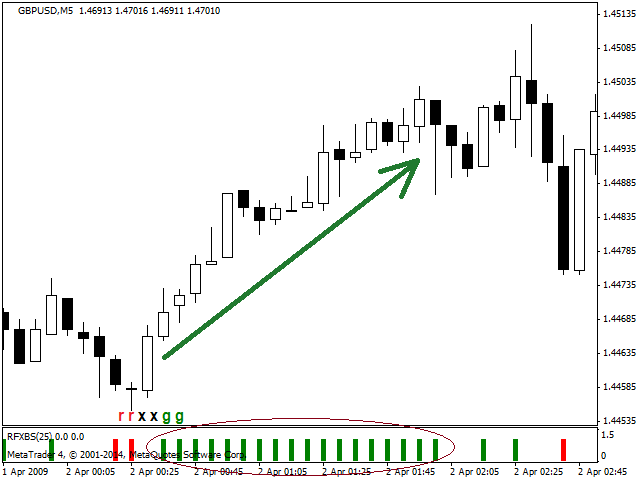
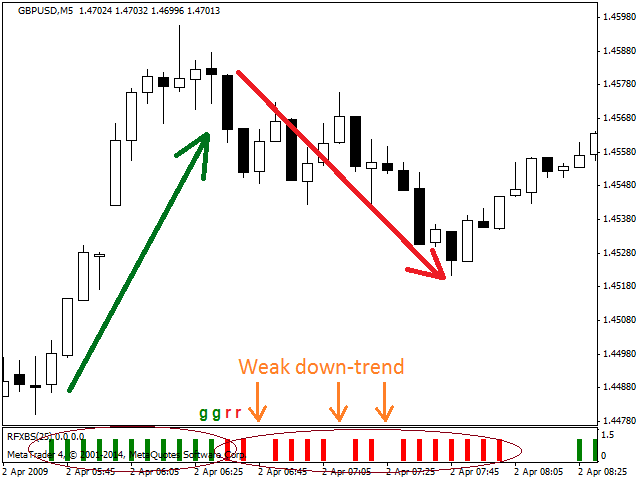
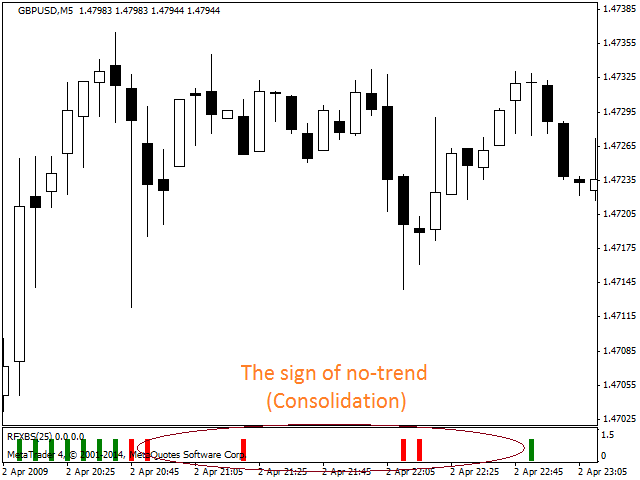
Identifying the trend of the market is an essential task of traders. Trendometer implements an advanced algorithm to visualize the trend of the market. The major focus of this indicator is to evaluate the market in the lower time frames (i.e., M1, M5 and M15) for the scalping purposes. If you are a scalper looking for a reliable indicator to improve your trade quality, Trendometer is for you. The indicator runs on a separate window showing a histogram of red and green bars. A two consecutive green (red) bars is a good sign to enter the market in Long (Short) direction. The number of consecutive bars with the same color is a measure of the power of the trend. In the absence of one or more bars, the interpretation of the indicator is that the market price is ranging (i.e., consolidation).
User Defined BUY/SELL Signal Patterns:
The
user can specify infinitely many BUY/SELL signal patterns to be shown
by the Trendometer indicator. A notification (in the alarm window) will
be generated as soon as a pattern is recognized by the indicator. In the
input setting there are two string variables: Buy Signal Pattern and Sell Signal Pattern. A space character between patterns separates them from each other. The characters 'g', 'r' and 'x' stand for a green, red and no bar
of the Trendometer indicator. For example, if we would like to have a
notification after two consecutive green bar followed by either a red
bar or no bar, we need to set Sell Signal Pattern ="rgg xgg".
Features:
- Generates reliable BUY/SELL scalping signals.
- Continuously follows the trend of the market price change.
- Filters out the noise in the candlesticks to identify the true trend.
- User can define infinitely many BUY/SELL signal patterns to be notified by the indicator.
- Works with 4 and 5 digits brokers.
Signals:
- Open a LONG (BUY) position when two consecutive green bars are formed after the end of a consolidation or the end of a down-trend.
- Open a SHORT (SELL) position when two consecutive red bars are formed after the end of a consolidation or the end of an up-trend.
- Trend Period: A positive integer number that indicates the period over which the trend will be estimated.
- Min Number of Group Bars: A positive integer number that indicates the minimum number of bars to be used in a group by the trend filter.
- Max Number of Group Bars: A positive integer number that indicates the maximum number of bars to be used in a group by the trend filter.
- Show Signal Alarm?: If Yes, the indicator will notify the user as a BUY/SELL signal pattern matches by means of the alert window.
- Draw Signal Arrow?: If Yes, the indicator will draw UP/DOWN arrows on the bar chart as a BUY/SELL signal pattern matches.
- Buy Signal Pattern: A string of user defined BUY signal patterns (see above to find out how to define a pattern).
- Sell Signal Pattern: A string of user defined SELL signal patterns (see above to find out how to define a pattern).
- Sell Color: The color of sell arrow.
- Buy Color: The color of buy arrow.


realy a good indicator. its just top for that price its 80% accurate!