Jin Lucrum Div Sentimen
- Indicatori
-
Syamsurizal Dimjati
 Hello traders, I design and develop high-quality indicators and Expert Advisors (EAs) for MT5 (since 2023), built to help you achieve more consistent and reliable trading results.
- Versione: 1.0
- Attivazioni: 5
JIN LUCRUM Sentiment: MA Trigger + Divergence + Multi-Timeframe Dashboard
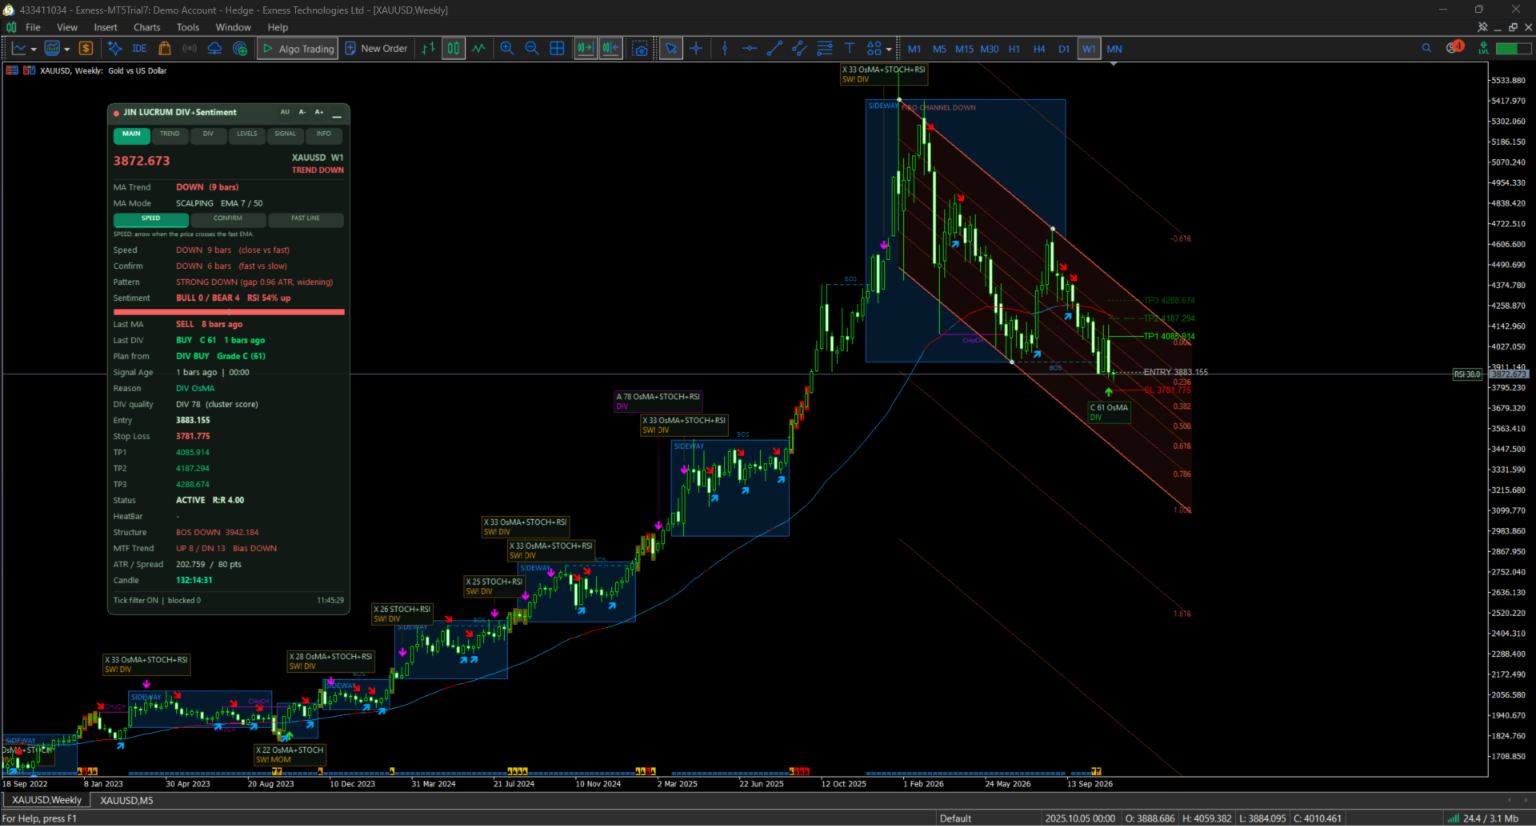
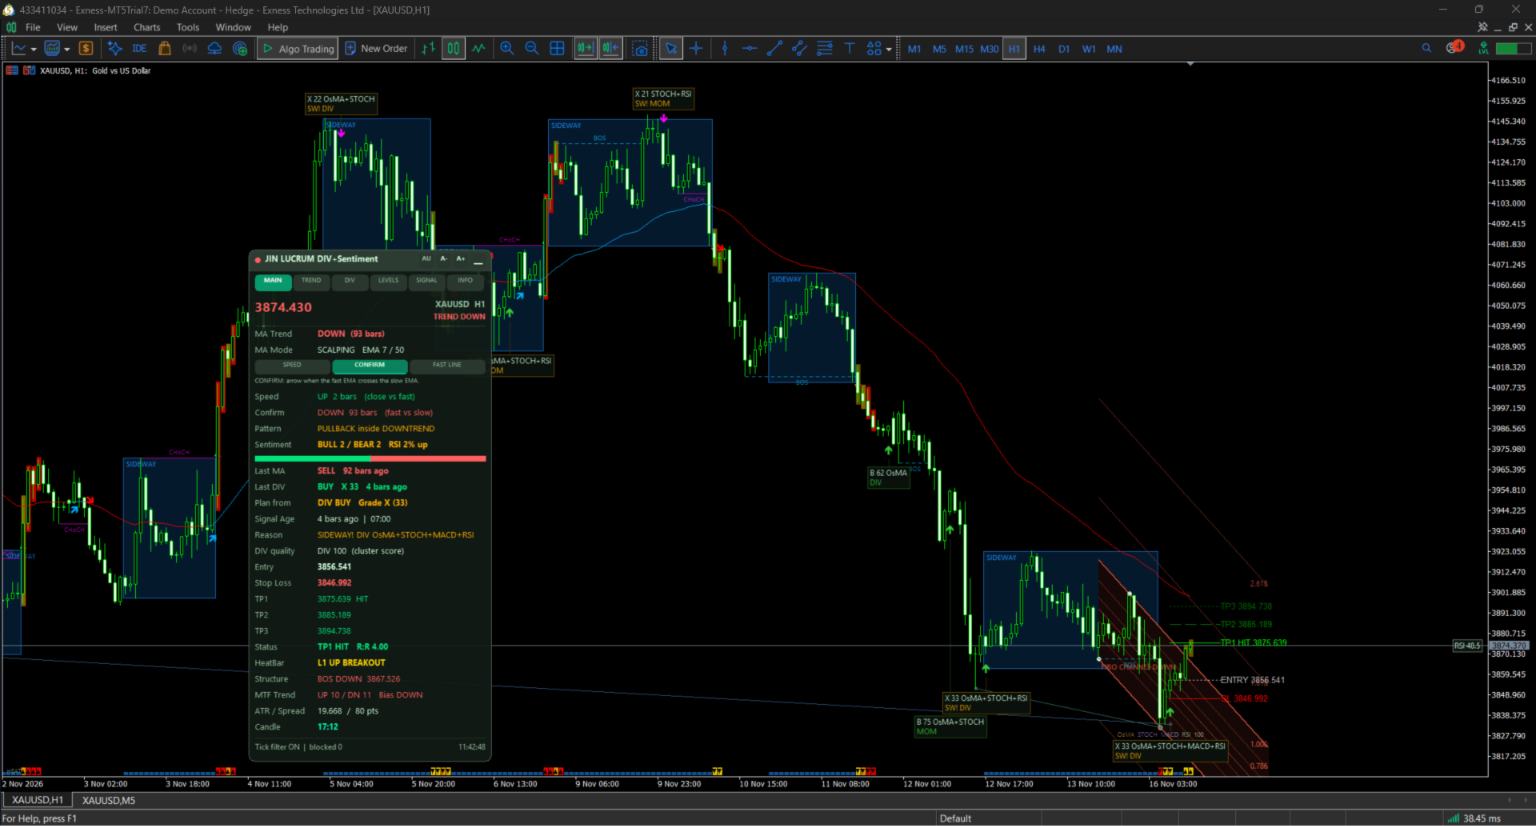
is a chart-overlay indicator for MetaTrader 5 that gives you two independent entry triggers and the market context around them, on one clean chart: a colour-changing EMA trigger with five trading modes and two selectable techniques, and a quality-scored RSI / OsMA / Stochastic / MACD divergence engine with its own arrows. A Canvas dashboard reads 21 timeframes at once, and a built-in trade plan draws entry, stop loss and three take-profit levels for the newest signal.
| Feature | What you get |
|---|---|
| MA Trigger | Slow EMA changes colour; the colour change draws the MA BUY / SELL arrow |
| Two techniques | SPEED (price crosses the fast EMA) or CONFIRM (fast EMA crosses the slow EMA), switchable live from the dashboard |
| Five trading modes + Custom | EMA 7/50, 13/100, 21/150, 34/200, 55/300, or your own pair |
| Divergence engine | OsMA, Stochastic, MACD and RSI divergence, scored 0-100 with grades A to D, own arrows, own alerts |
| Market context | Sideway zones, HeatBar breakout, BOS / CHoCH structure, Fibonacci channel |
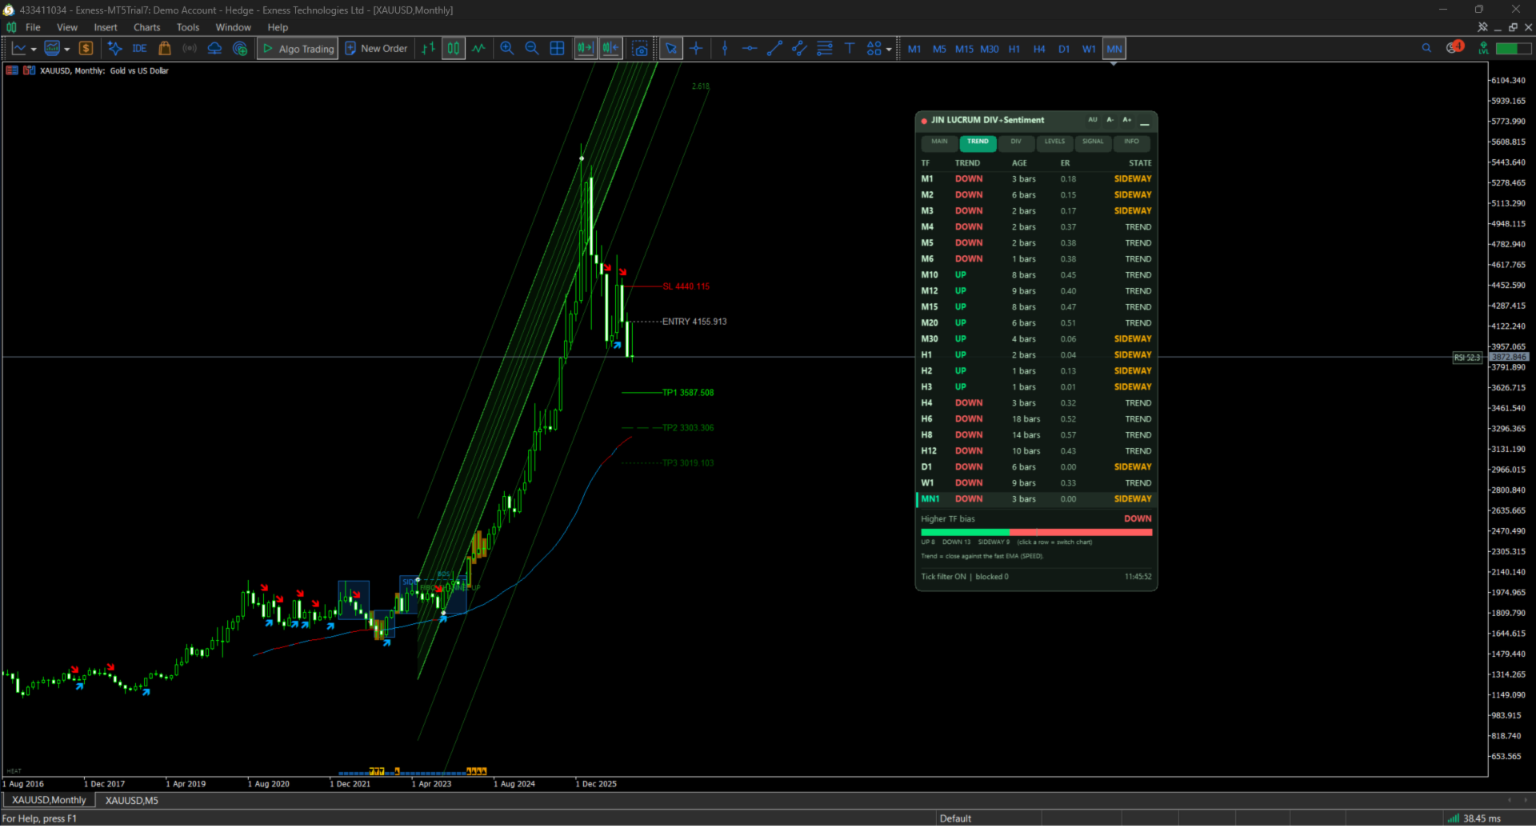
| Multi-timeframe dashboard | Trend and divergence on up to 21 timeframes, click a row to switch the chart |
| Trade plan | Entry, stop loss (ATR or pivot), TP1 / TP2 / TP3 lines with live status and R:R |
| Tick spam / spike filter | Blocks spike ticks, wide-spread ticks and tick bursts that cause fake arrows |
| Clean chart | Grid and trade history are hidden on attach; the candles stay the standard MT5 candles |
| Alerts | Popup, push notification and sound, with separate switches for MA and DIV signals |
The MA arrow sits next to the candle and the divergence arrow sits further out, so the two signal sources never hide each other.
MA Trigger: the slow EMA changes colour
The slow EMA is the trend line. It is drawn in the UP colour (blue by default) or the DOWN colour (red by default), and the moment the colour flips an MA BUY or MA SELL arrow is drawn. A colour change is easy to read at a glance and needs no extra confirmation indicator.
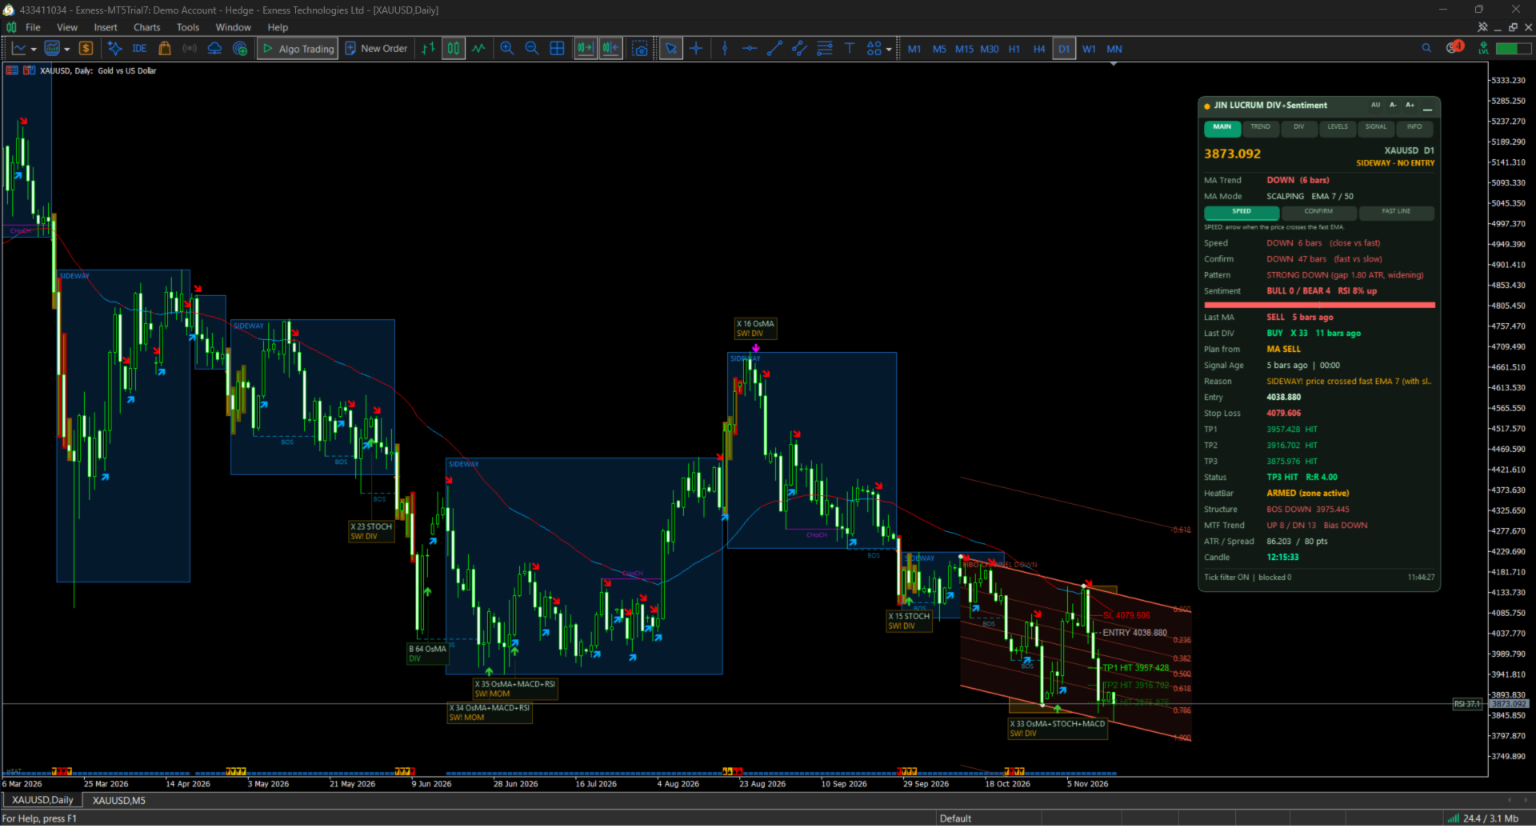
What makes the colour flip depends on the technique you pick. Choose it with the Trade_Technique input or switch it live in the dashboard MAIN tab; every arrow on the chart is recalculated immediately.
| SPEED | CONFIRM | |
|---|---|---|
| Colour flips when | the price crosses the fast EMA | the fast EMA crosses the slow EMA |
| Slow EMA decides the trend? | No, it only carries the colour | Yes |
| Arrows | Many and early | Few and late, much less noise |
| Typical use | Scalping, fast entries, pullback re-entries | Intraday to position trading, measuring the trend of a longer trade |
The MAIN tab always shows the state and age of both techniques side by side, plus a Pattern line that reads the trend from them: STRONG (EMA gap widening), MATURE (gap narrowing), PULLBACK inside a trend, REVERSAL RISK (price through the slow EMA) or FLAT (EMAs tangled).
Trading modes
The mode sets the fast / slow EMA pair. SPEED reacts to price against the fast EMA, so its arrows look alike across modes; CONFIRM is where the mode changes the signals the most.
| Mode | Fast EMA | Slow EMA | Intended style |
|---|---|---|---|
| Scalping (default) | 7 | 50 | Minutes to hours |
| Intraday | 13 | 100 | Same-day trades |
| Short Swing | 21 | 150 | Days |
| Long Swing | 34 | 200 | Days to weeks |
| Position | 55 | 300 | Weeks and longer |
| Custom | MA_Custom_Fast (6) | MA_Custom_Slow (200) | Your own pair |
Signal behaviour
- Live (confirmed by tick filter) draws the arrow on the forming bar once enough distinct ticks and time have confirmed the flip. Set the signal mode to Bar close for arrows that appear only after the bar has closed.
- Sideway protection: an arrow that appears inside a sideway zone carries a warning tag, or is hidden if you set the sideway arrow mode to Hide.
- Fast EMA line: hidden by default; the FAST LINE button in the MAIN tab shows it as a thin dotted line.
- The arrow type, size, colours and distance from the candle are all adjustable.
Divergence engine with its own score
Divergence works on its own, separate from the MA Trigger: it has its own score, its own BUY / SELL arrows (green and magenta by default) and its own alerts. It does not need an MA signal to fire, and an MA signal does not need a divergence.
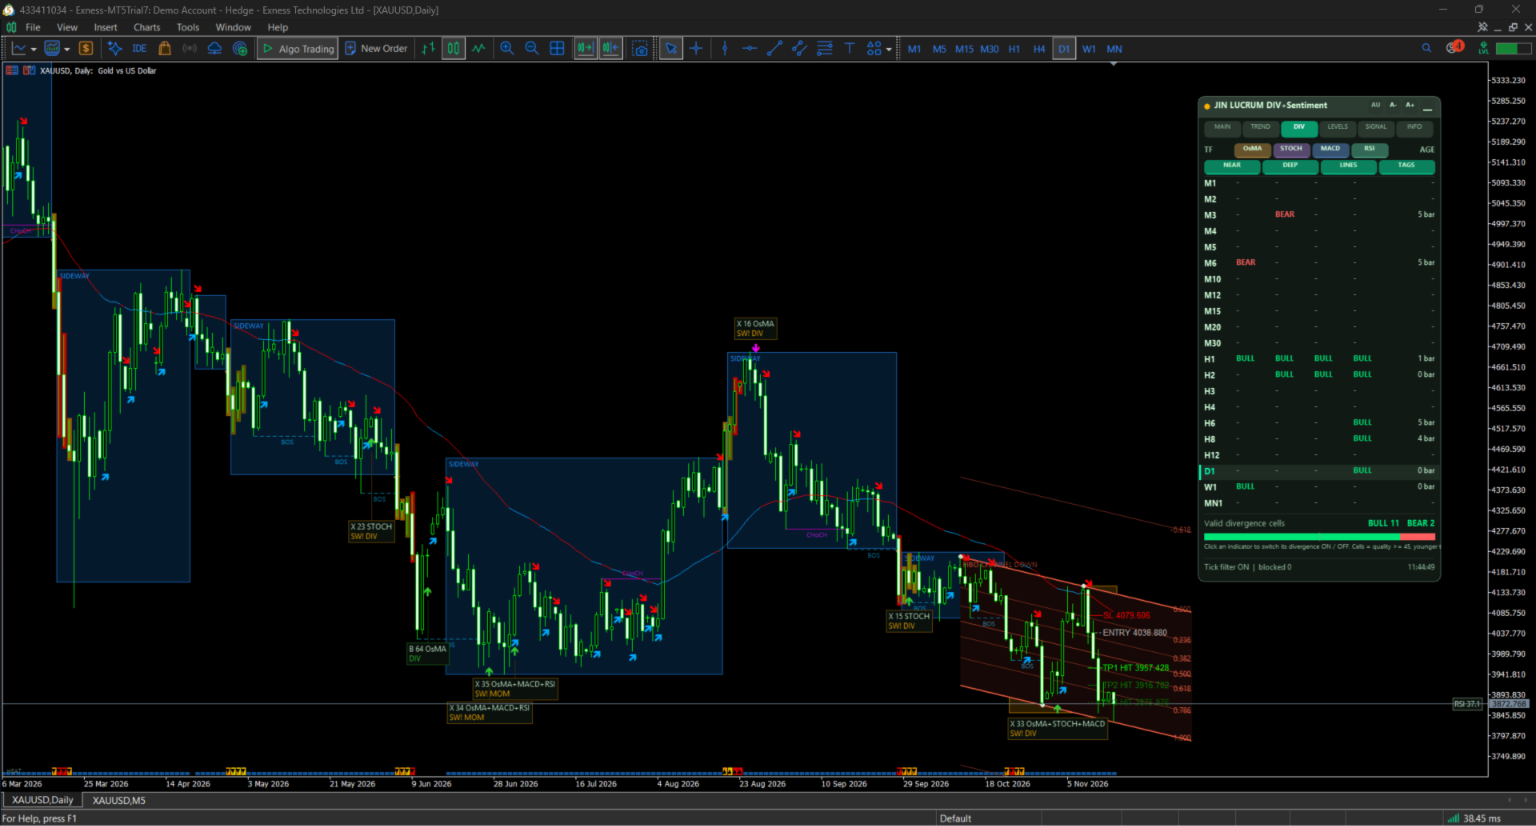
Four oscillators are scanned for regular divergence between two price pivots: OsMA, Stochastic, MACD and RSI. Each can be switched on or off live in the dashboard DIV tab, together with the NEAR / DEEP scan, the divergence lines and the reason tags.
- NEAR divergence: two pivots up to 500 bars apart. DEEP divergence: pivots up to 1,500 bars apart, marked DEEP.
- Gates before a divergence counts: price must move at least 0.3 ATR between the pivots, the oscillator difference must be meaningful, and price must not break the line between the pivots.
- Quality 0-100 per divergence, then a cluster score when several indicators agree inside a sync window of 6 bars. An arrow needs a cluster score of 75 by default ( InpDivTrigScore ); raise it for fewer, stronger arrows.
- Final signal score = 78% of the cluster score, plus structure (CHoCH +10, BOS +8), sideway breakout (+6), higher-timeframe agreement (+4) and a strong momentum candle (+2), minus 45 inside a sideway zone.
| Grade | Signal score | Meaning |
|---|---|---|
| A | 78 and above | Strongest setups |
| B | 62 to 77 | Good |
| C | 45 to 61 | Acceptable, trade with care |
| D | below 45 | Weak |
| X | any, inside a sideway zone | Avoid |
Each divergence arrow carries a small reason tag with the grade, the agreeing indicators and the extra evidence (DEEP, CHoCH, BOS, BRK, MOM, MTF). Divergence lines are thin and dimmed, one colour per indicator, and expire after 30 bars so the chart stays readable; the arrows stay as history.
A divergence is confirmed only after the right-hand pivot bars have closed (2 by default), so its arrow appears that many bars after the pivot. This delay is what keeps the signal from repainting on the pivot itself.
Market context and signal filters
The overlay is drawn on a Canvas layer behind the candles by default (Overlay_Behind_Candles input), so the standard candles stay fully visible.
| Module | What it does | Main settings |
|---|---|---|
| Sideway zone | Draws a box when the market is choppy and compressed, marks it active until price closes beyond it, and flags arrows that appear inside it | Efficiency ratio below 0.30, range below 4.5 ATR, at least 4 bars, breakout 0.25 ATR |
| HeatBar breakout | Highlights the candles that break out of a sideway zone in three heat levels, plus follow-through bars | Level 2 at 0.60 ATR, level 3 at 1.20 ATR, 3 follow bars, optional breakout alert |
| BOS / CHoCH structure | Draws break of structure and change of character lines and tracks the structural trend | Swing strength 5 bars, minimum swing 0.8 ATR, up to 12 events |
| Fibonacci channel | Draws a diagonal channel from the last three swings with 0, 0.5 and 1 levels and optional -0.618 / 1.618 / 2.618 extensions | Fill and extensions on or off, 15 bars extension |
| Tick spam / spike filter | Rejects spike ticks, ticks with a spread above 3x the average, and bursts closer than 120 ms; a live signal needs 3 distinct ticks over 800 ms | All values adjustable, or switch the filter off |
| Wick clamp | Limits an extreme wick to 2 ATR before it is used in a calculation | Set to 0 to turn it off |
The INFO and LEVELS dashboard tabs show the live state of each module, including how many ticks the filter has blocked.
Dashboard: six tabs on one panel
The dashboard is drawn on a Canvas, so it is a single smooth panel instead of dozens of chart objects. Drag it by the title bar, minimise it, and change the font size with A+ / A- (or leave auto font on, which follows the chart size). Switches you change in the dashboard are remembered per chart. Nine colour themes are included, from Dark Green and Gold Black to Soft White and Arctic Ice.
| Tab | What it shows |
|---|---|
| MAIN | Price and market state; MA trend and age; SPEED / CONFIRM / FAST LINE buttons; both technique states and the Pattern line; sentiment; last MA and last DIV signal; the trade plan (entry, SL, TP1-TP3, status, R:R); HeatBar, structure, higher-timeframe trend, ATR and spread |
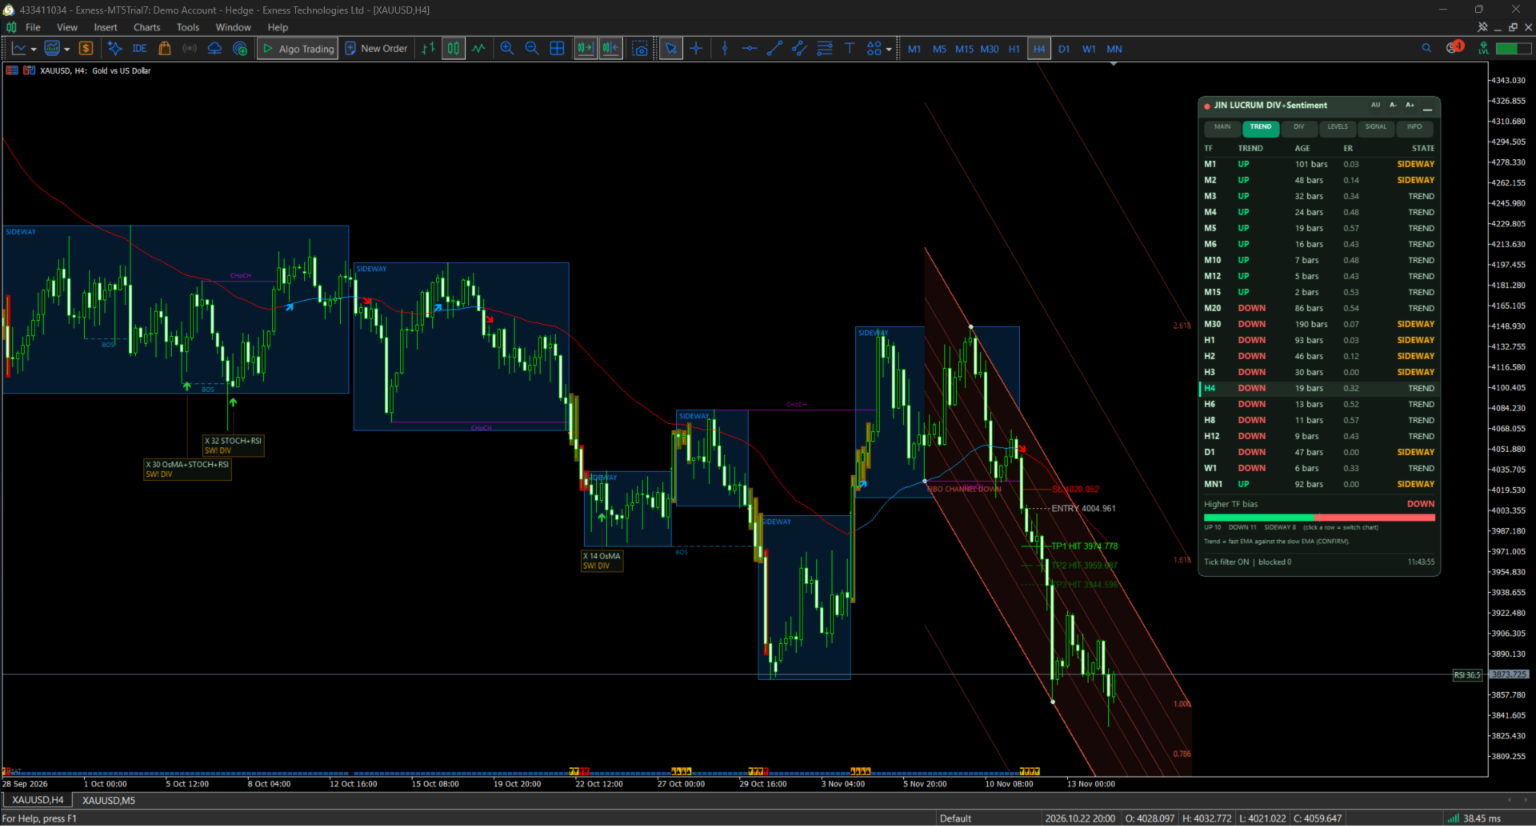
| TREND | The MA trend (UP / DOWN), its age, efficiency ratio and TREND / SIDEWAY state on every timeframe, with a higher-timeframe bias bar. Click a row to switch the chart to that timeframe |
| DIV | Switches for OsMA, Stochastic, MACD and RSI, NEAR / DEEP, lines and tags, and the latest divergence (BULL / BEAR) per timeframe |
| LEVELS | The active sideway zone with edges and width, the Fibonacci channel levels and price position, and the latest BOS / CHoCH events |
| SIGNAL | History of the latest signals, tagged MA or DIV, with grade, age and result, and win / loss / open counts for each source |
| INFO | Tick filter statistics, the active MA mode and technique, divergence engine settings, and a legend for the arrows and tags |
TREND and DIV can show all 21 timeframes (M1 to MN1, including M2, M3, M4, M6, M12, M20, H2, H3, H6, H8 and H12) or the 9 standard ones.
Trade plan and alerts
The newest signal of either source (MA or DIV) becomes the trade plan shown in the MAIN tab and drawn on the chart. If both fire on the same bar, the divergence signal is used.
| Level | How it is set |
|---|---|
| Entry | The signal price |
| Stop loss | ATR mode (default): entry minus / plus 0.5 ATR. Pivot mode: beyond the divergence pivot, capped at 3 ATR |
| TP1 / TP2 / TP3 | 1.0 / 1.5 / 2.0 ATR from entry (ATR period 14), each with its own colour and line style |
The plan tracks the live price: which targets have been hit, whether the stop was touched, and the current R:R. Lines extend a few bars to the right of the latest bar and are limited in length so old plans do not clutter the chart. Switch them off with InpShowTPSL .
Alerts
- Channels: popup, push notification and sound, each with its own switch.
- Per source: Alert_MA_Signal for MA BUY / SELL, Alert_Div_Signal for divergence BUY / SELL. The alert text names the source, the mode and technique, the grade and the reason.
- Breakout alert: optional alert when price breaks out of a sideway zone.
- Alerts fire once per bar and side, and follow the signal mode: confirmed live ticks or bar close.
Quick start
- Copy all indicator files into the same folder ( MQL5\Indicators ) if you install from source; the Market version is a single install.
- Drag the indicator onto a chart. The grid and trade history are hidden for a clean chart and the standard candles stay as they are. Removing the indicator gives your original chart settings back.
- Pick the Trade Mode that matches your holding time, then the Technique: SPEED for early entries, CONFIRM for fewer and cleaner ones.
- Read the colour of the slow EMA for the trend and wait for the arrow. Check the dashboard MAIN tab for the trade plan and the TREND tab for the higher-timeframe bias.
- Treat divergence arrows as a separate signal. Prefer grades A and B, and skip any arrow marked X (inside a sideway zone).
Suggested starting points
| Style | Mode | Technique | Notes |
|---|---|---|---|
| Scalping | Scalping | SPEED | Use Bar close signal mode if you want no intra-bar arrows |
| Intraday | Intraday | SPEED or CONFIRM | Use CONFIRM to avoid chop, SPEED for pullback entries |
| Swing | Short Swing or Long Swing | CONFIRM | Read the Pattern line: STRONG and MATURE trends versus PULLBACK |
| Position | Position | CONFIRM | Use the TREND tab to align higher timeframes before entering |
These are starting points, not guarantees. Test each combination on a demo account and your own symbols and timeframes before using real money.
Tips
- Combine the sources: an MA arrow in the direction of a recent A or B divergence on the same side is a stronger set-up than either alone.
- Raise InpDivTrigScore for fewer divergence arrows; lower InpDivMinQ only if you want to see weaker candidates.
- Use Min_Score_Arrow to hide low-score divergence arrows without changing the engine.
- On very short history (for example MN1) the indicator shortens its warm-up automatically and starts analysing as soon as enough bars are loaded.
FAQ
Does it repaint? In Bar close mode an MA arrow is drawn only after the bar closes and does not change afterwards. In Live mode the arrow is drawn on the forming bar once the tick filter confirms it, and it can disappear if price reverses before the bar closes. Divergence arrows are drawn after the right-hand pivot bars have closed and stay on the chart.
Why are there two kinds of arrows? The MA arrow (next to the candle) comes from the slow EMA colour change. The divergence arrow (further out) comes from the oscillator divergence engine. They are independent, with separate alerts, so you can follow either one or both.
What is the difference between SPEED and CONFIRM? SPEED draws an arrow when price crosses the fast EMA, so it is earlier and has more noise. CONFIRM waits for the fast EMA to cross the slow EMA, so it gives fewer, later signals and suits longer trades. Switch between them in the MAIN tab at any time.
Does it change my candles? No. The candles keep your own colours and style. Only the grid and trade history are hidden, and they come back when you remove the indicator or turn InpApplyChartStyle off.
Which symbols and timeframes work? Any symbol and timeframe in MT5, M1 to MN1. On very short history the indicator starts as soon as enough bars are loaded.
Does it trade for me? No. It is a signal and analysis indicator. It does not open or close orders.
Risk warning
Trading leveraged products carries a high risk of loss. Signals, grades and trade-plan levels are decision support, not financial advice, and past results do not guarantee future results. Test on a demo account first and never risk money you cannot afford to lose.