CalmFx SR Zones MT4

  • Indicatori
  • Callum Gunn
    Callum Gunn
    CalmFx - calm, clear trading tools for MetaTrader 5.
    I build and support the CalmFx toolkit: on-chart panels, multi-symbol scanners and indicators designed to work side by side on the same charts, on any symbol and any screen size, from a laptop to a 40-inch TV.
    CalmFx on the Market:
  • Versione: 1.0
  • Attivazioni: 10

Support and resistance zones drawn from where price has actually turned. CalmFx SR Zones finds swing highs and lows, merges the ones that sit close together into zones, and counts how many times each zone has been touched. Only zones with enough touches are drawn.

How the zones are built

  • Swing points are found with a strength you choose (bars on each side).
  • Swing points within a fraction of ATR are merged into one zone, so the zone width suits the market: the same inputs work on a currency pair, gold or an index.
  • Zones are chosen strongest first, with a minimum gap between them, so the chart stays readable.
  • Zones above price read as resistance and below as support. The colours swap when price moves through.

Options

  • Find zones on a higher timeframe and see them on a lower one.
  • Number of zones, minimum touches, zone width, gap and lookback are all inputs.
  • Labels with the zone price and touch count, and a tooltip on each zone.
  • Alert when price enters a zone, with a cooldown per zone. Pop-up, sound, push notification and email.
  • The zones already holding price when the indicator loads are treated as the starting point, so adding it to a chart does not alert straight away.

Notes

  • The indicator does not open, change or close trades.
  • Zones show where price has reacted before, not where it will react next.

Part of the CalmFx toolkit

  • CalmFx Surge Ranker MT4, Snap Ranker MT4, Squeeze Ranker MT4 and Session Range Ranker MT4 rank your whole watchlist.
  • All CalmFx tools, for MetaTrader 4 and MetaTrader 5, are on the CalmFx seller page.
Prodotti consigliati
Overview Harmonic Patterns MT4 is a technical analysis indicator designed for the MetaTrader 5 platform. It identifies and displays harmonic price patterns, such as Butterfly, Cypher, Crab, Bat, Shark, and Gartley, in both bullish and bearish directions. The indicator calculates key price levels, including entry, stop loss, and three take-profit levels, to assist traders in analyzing market movements. Visual elements and customizable alerts enhance usability on the chart. Features Detects six ha
Trade with Gann on your side!! MASTER CIRCLE 360 CIRCLE CHART, originally created by Gann admitted that this is “The Mother of all charts”. It is one of the last studies that this great trader left for us. The numeric tab le is apparently quite simple like all the tables and is based on square numbers, the SQUARE OF 12 and is by evolution, one of the most important square numbers. Here we can find CYCLE, PRICE AND TIME thanks to angles and grades, to show past and future support and resistance.
Dominant Wave Pro (MT4 Version) Trade with the market's actual rhythm — not a guessed one Most oscillators lock onto a fixed cycle length and never question it. Real markets don't behave that way — the length of a swing, a trend leg, or a pullback shifts constantly with volatility and momentum. Dominant Wave Pro takes a different approach: instead of assuming a cycle, it measures the market's current dominant cycle directly from price on every bar, and adapts to it automatically. At its core,
PZ Harmonacci Patterns
PZ TRADING SLU
3.17 (6)
Trade smarter, not harder: Empower your trading with Harmonacci Patterns This is arguably the most complete harmonic price formation auto-recognition indicator you can find for the MetaTrader Platform. It detects 19 different patterns, takes fibonacci projections as seriously as you do, displays the Potential Reversal Zone (PRZ) and finds suitable stop-loss and take-profit levels. [ Installation Guide | Update Guide | Troubleshooting | FAQ | All Products  ] It detects 19 different harmonic pric
Monster Harmonic Indicator
Paul Geirnaerdt
4.59 (29)
Monster Harmonics Indicator is a harmonic pattern indicator. It recognizes Gartley, Bat, Crab, Butterfly, Cypher, White Swan, Black Swan, Shark and several other patterns. Projected patterns that are not yet completed are recognized, too. Monster even shows the PRZ (Potential Reversal Zone). Users can add their own user defined patterns to Monster. Besides the current pattern, Monster also shows all patterns in the symbols history. Monster will provide alerts for developing patterns. Introduced
Professional Opening Range Breakout (ORB) indicator designed for precision session trading with automatic time handling, breakout alerts, and advanced target levels. This indicator automatically identifies the Opening Range for any configurable session, plots the High, Low, and Midpoint levels, and extends them across the trading day. Built-in breakout detection and alerts, range measurements, and extension targets provide traders with clear structure and actionable levels. Ideal for traders usi
PZ Wolfe Waves
PZ TRADING SLU
1 (1)
Precision trading: leverage wolfe waves for accurate signals Wolfe Waves are naturally occurring trading patterns present in all financial markets and represent a fight towards an equilibrium price. These patterns can develop over short and long-term time frames and are one of the most reliable predictive reversal patterns in existence, normally preceding strong and long price movements. [ Installation Guide | Update Guide | Troubleshooting | FAQ | All Products ] Clear trading signals Amazingly
SRline
Huu Tri Nguyen
SRline Automatic Support and Resistance Zone Indicator Based on Fractal Structure Overview SRline is a technical analysis indicator designed to identify and display support and resistance zones using fractal-based price structure detection. The indicator automatically scans historical price data and marks significant fractal highs and lows directly on the chart. It can be used for: Market structure analysis Support and resistance observation Breakout monitoring Reversal analysis Price action wo
"Impulses and Corrections 4" is created to help traders navigate the market situation. The indicator shows multi-time frame upward and downward "Impulses" of price movements. These impulses are the basis for determining the "Base" , which is composed of zones of corrections of price movements, as well as "Potential" zones for possible scenarios of price movement. Up and down impulses are determined based on a modified formula of Bill Williams' "Fractals" indicator. The last impulse is always "U
FVG DGT Panel [TMT] — Fair Value Gap and Inverse FVG Indicator with Live "% Left" Fill Tracking for MetaTrader 4 Version for MT4 | Non-repainting zone logic | BUY / SELL / NEUTRAL bias panel | FVG + IFVG | Optional second timeframe 1. Overview FVG DGT Panel [TMT] is a chart-window indicator for MetaTrader 4 that finds, draws and tracks Fair Value Gaps (FVG) and Inverse Fair Value Gaps (IFVG) directly on your price chart. It is a MetaTrader 4 port of the popular "Fair Value Gaps by DGT" concept
The indicator provides a superior alternative to price action analysis. It enables the identification of normalized patterns, which are then transformed into a graphical representation to forecast future steps within a time series. In the top-left corner, you'll find information regarding the expected prediction accuracy, determined through a complex MSQE calculation. You have the flexibility to adjust the time window, making it easy to validate the indicator's performance. Additionally, you can
Point61 Indicator
Evgeniy Machok
5 (1)
The Point61 indicator is the result of many years of monitoring of price behavior of currency pairs and metals. It is not a secret, that in times of uncertainty, traders are looking for possible levels of support and resistance - the point, where price should stop its movement. There are 2 possible scenarios at these points: 1. Reverse (correction) to the opposite direction; 2. Breakthrough to continue movement. Very often these points are used to set stop orders - TakeProfit or StopLoss
The   Fibonacci Confluence Toolkit   is a technical analysis tool designed to help traders identify potential price reversal zones by combining key market signals and patterns. It highlights areas of interest where significant price action or reactions are anticipated, automatically applies Fibonacci retracement levels to outline potential pullback zones, and detects engulfing candle patterns. Its unique strength lies in its reliance solely on price patterns, eliminating the need for user-define
Questo indicatore rileverà i pattern armonici disegnati sul grafico tramite metodi manuali e automatici. Aggiungi la tua recensione, per favore. Note: Questo indicatore ha un pannello di controllo e salverà ogni impostazione (grafico e timeframe). Puoi ridurlo per avere più spazio sul grafico e puoi premere il pulsante di chiusura per nascondere tutti i dati dell'indicatore sul grafico se preferisci lavorare con altri strumenti di analisi. Quando utilizzi questo indicatore e modifichi le imposta
Reversal Pattern Pro
Boonyapagorn Rodvattanajinda
Reversal Patterns Pro Reversal Patterns Pro is a Price Action (PA) analytical tool that scans the reversal patterns.  - Finds and marks the most dependable Japanese candlestick patterns in real-time. - Supports all time frames (Best for Scalping) - Doesn't repaint making it an exceptional indicator for Expert Advisors. Input parameters : - Support & Resistance Mode ( true or false ) for enabling advanced filtering - Donchian Period - RSI Period - RSI Oversold Level - RSI Overbought Level - Al
PZ 123 Pattern
PZ TRADING SLU
1 (1)
Unlock powerful breakout opportunities The 123 Pattern is one of the most popular, powerful and flexible chart patterns. The pattern is made up of three price points: a bottom, a peak or valley, and a Fibonacci retracement between 38.2% and 71.8%. A pattern is considered valid when the price breaks beyond the last peak or valley, moment at which the indicator plots an arrow, rises an alert, and the trade can be placed. [ Installation Guide | Update Guide | Troubleshooting | FAQ | All Products  ]
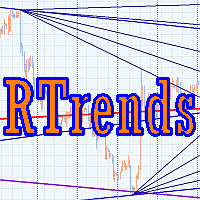
RTrends
Nikolay Likhovid
The RTrends indicator does two things: first, it automatically draws the layout of the price chart by plotting trend lines and, secondly, it produces bearish and bullish signals. The layout reflects the fractal nature of the market. Trends from different time horizons are applied simultaneously on the chart. Thus, from a single chart a trader can see trend lines of higher timeframes. The lines, depending on the horizon, differ in color and width: the older the horizon, the thicker the line is. T
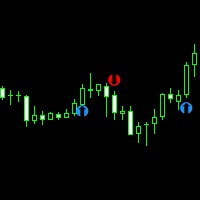
Alpha Trend sign has been a very popular trading tool in our company for a long time. It can verify our trading system and clearly indicate trading signals, and the signals will not drift. Main functions: Based on the market display of active areas, indicators can be used to intuitively determine whether the current market trend belongs to a trend market or a volatile market. And enter the market according to the indicator arrows, with green arrows indicating buy and red arrows indicating se
Gold Phoenix
Yaroslav Varankin
The perfect tool for Scalng in the Forex markets You can trade both from signal to signal and using take profit  The algorithm does not use Zigzag!  No redrawing!  This is a channel instrument that uses a moving average as a filter. Moving Average  There are 2 parameters for the settings Ma Period = 5 period Moving Average  Channel 1.0 distance of channel lines from the chart Price Signal Filter - calculation of signal opening and filter There is a complete set of Alert There is a multi-timefram
The CCI Divergence is a reasonably useful indicator in itself, but it is even more effective when used with divergence pattern trading. The CCI Divergence indicator signal is one of the most potent signals among the indicators that exist in the market. Here is new version for Divergence Indicator using CCI method, with more improvements. Divergences indicate a potential investment point because the directional moment does not confirm the price. A bullish divergence occurs when the underlying va
Future Candle One Candle is an arrow indicator of candlestick patterns, based on the calculation of historical statistics. It identifies and calculates patterns consisting of one candle. Advantages of the indicator Gives information about the next candle right now; The indicator values are based on statistical data on the history of the current instrument; Forecasts and displays the result of trading based on its signals; The colors of the indicator have been selected for a comfortable operatio
Smc Auto Pro
Pedro Ramon Seabra De Souza
SMC AUTO PRO is an advanced indicator for MetaTrader 4 that automates the reading of Smart Money Concepts (SMC), mapping of the valid market structure in real time and highlighting the most relevant points of interest (POIs) — such as Order Blocks (OB) and Fair Value Gaps (FVG) — already ranked by institutional strength. What it does The indicator analyzes market flows and builds a dynamic queue of structures based on breaks: BOS (Break of Structure):   confirms trend continuation and keeps the
We present you the indicator "Candle closing counter", which will become your indispensable assistant in the world of trading. That’s why knowing when the candle will close can help: If you like to trade using candle patterns, you will know when the candle will be closed. This indicator will allow you to check if a known pattern has formed and if there is a possibility of trading. The indicator will help you to prepare for market opening and market closure. You can set a timer to create a pre
CRT Candle Range Theory HTF MT4 - Ultimate CRT Indicator: Concetti ICT avanzati e sistema di trading Malaysian SnR Padroneggia le orme dei Market Maker con l'indicatore Candle Range Theory più avanzato. Sblocca il vero potere degli Smart Money Concepts (SMC) e fai trading con la stessa precisione delle istituzioni grazie all'Ultimate CRT Indicator. Costruito esclusivamente per i trader seri, questo indicatore automatizza la teoria CRT, un pilastro centrale dei Concetti ICT (Inner Circle Trader),
UT BOT Simple MT4
Bartlomiej Tadeusz Tomaja
**Features:** 1. **Innovative Trend Tracking:** The UT BOT Simple Indicator leverages the power of the Average True Range (ATR), a renowned volatility measure, to calculate precise trailing stop values, providing unparalleled insights into market trends. 2. **Customizable Settings:** Flexibility is paramount in any trading strategy. With this in mind, our indicator allows you to adjust the ATR periods and other key parameters to tailor the tool to your trading style and strategy. 3. **Real-t
Indicatore Crypto_Forex "Hanging Man Pattern" per MT4, senza ridisegnare, senza ritardi. - L'indicatore "Hanging Man Pattern" è un indicatore molto potente per il trading basato sulla Price Action. - L'indicatore rileva pattern ribassisti di Hanging Man sul grafico: segnale di freccia rossa sul grafico (vedi immagini). - Con avvisi su PC, dispositivi mobili ed e-mail. - L'indicatore "Hanging Man Pattern" è eccellente da combinare con livelli di supporto/resistenza. Click here to see high qualit
Harmonic Scanner Pro MT4 watches many symbols and timeframes at once for eight harmonic patterns: ABCD, Gartley, Bat, Alternate Bat, Butterfly, Crab, Deep Crab and Cypher. One panel shows where a pattern has just reached its potential reversal zone. It also shows where one is forming close to its zone, and how long ago the last one completed. It uses only confirmed swings and closed bars. A completed pattern in a cell never changes afterwards. MetaTrader 4 edition: the same calculation, panel, o
Cosmic Diviner X Planet
Olena Kondratenko
4 (2)
This unique multi-currency strategy simultaneously determines the strength of trends and market entry points, visualizing this using histograms on the chart. The indicator is optimally adapted for trading on the timeframes М5, М15, М30, Н1. For the convenience of users, the indicator renders the entry point (in the form of an arrow), recommended take profit levels (TP1, TP2 with text labels) and the recommended Stop Loss level. The take profit levels (TP1, TP2) are automatically calculated for
PATTERN HUNTER 4.00 Stop opening chart after chart looking for candlestick patterns. Let Pattern Hunter find them for you. Pattern Hunter is a multi-market, multi-timeframe candlestick pattern scanner for MetaTrader 4 . It monitors the instruments in your Market Watch, searches your selected timeframes for recognised candlestick formations, and organises the results in one clear dashboard. When Pattern Hunter finds an opportunity, you can go from: SCAN → SIGNAL → CHART → PATTERN in a single clic
Zones Supply and Demand mt4
Jose Antonio Rojas Amaricua
Indicator Title:   Supply and Demand Zones Short Description: This indicator for MetaTrader 5 automatically identifies and draws supply and demand zones on the price chart, providing key visual information for trading decisions. Based on the analysis of price action and candle structure, the indicator highlights areas where the price is likely to react. Detailed Description: The Supply and Demand Zones indicator analyzes price history to identify specific candlestick patterns that suggest the pr
Gli utenti di questo prodotto hanno anche acquistato
Trend SniperX MT4
Sarvarbek Abduvoxobov
5 (5)
Trend Sniper X è un indicatore di trend-following multi-timeframe per MetaTrader 5 che aiuta i trader a identificare la direzione del trend e i potenziali punti di inversione con chiarezza e precisione. Per MT5: https://www.mql5.com/en/market/product/181101 Informazioni sul prezzo: Il prezzo attuale è promozionale ed è soggetto a modifiche con il rilascio dei prossimi aggiornamenti e nuove funzionalità. Canale Code2Profit Domina il mercato con l'analisi multi-timeframe! Come massimizzare il tuo
Currency Strength Wizard è un indicatore molto potente che ti fornisce una soluzione all-in-one per un trading di successo. L'indicatore calcola la potenza di questa o quella coppia forex utilizzando i dati di tutte le valute su più intervalli di tempo. Questi dati sono rappresentati in una forma di indice di valuta facile da usare e linee elettriche di valuta che puoi utilizzare per vedere il potere di questa o quella valuta. Tutto ciò di cui hai bisogno è collegare l'indicatore al grafico che
PRO Renko System
Oleg Rodin
5 (31)
PRO Renko System è un sistema di trading altamente accurato appositamente progettato per il trading di grafici RENKO. Questo è un sistema universale che può essere applicato a vari strumenti di trading. Il sistema neutralizza efficacemente il cosiddetto rumore di mercato che consente di accedere a segnali di inversione accurati. L'indicatore è molto facile da usare e ha un solo parametro responsabile della generazione del segnale. Puoi facilmente adattare lo strumento a qualsiasi strumento di
SR Liquidity
Oleg Rodin
5 (2)
SR Liquidity è un indicatore di trading progettato per individuare le zone nascoste in cui si concentra la liquidità di mercato e dove il prezzo reagisce con maggiore intensità. Queste aree di liquidità agiscono come potenti livelli di supporto e resistenza, offrendo una mappa chiara dei punti in cui è più probabile che il mercato inverta la propria direzione. Invece di tracciare le classiche linee di supporto e resistenza, SR Liquidity analizza l'effettivo comportamento dei prezzi per individua
Scalper Vault
Oleg Rodin
5 (40)
Scalper Vault è un sistema di trading potente e completo, progettato per i trader che desiderano ottenere risultati costanti nel trading intraday. Questo indicatore ad alta precisione funge da sistema di trading autonomo, offrendo analisi di livello istituzionale sia per il mercato Forex che per le Opzioni Binarie. CONTATTAMI DOPO L'ACQUISTO PER RICEVERE I MIEI CONSIGLI DI TRADING E UN FANTASTICO BONUS! Eliminando le congetture e le complesse analisi manuali, Scalper Vault ti permette di concen
Smart Trend Trading System è un indicatore per MetaTrader 4 che riunisce informazioni sul trend, segnali di entrata e uscita e livelli di prezzo in un unico grafico. Combina più di 10 strumenti di trading in un unico sistema, inclusi rilevamento del trend, zone di inversione, Smart Cloud, logica di trailing stop, supporto e resistenza, colorazione delle candele, avvisi e analisi multi-timeframe. Il sistema è progettato per aiutarti a operare in diverse condizioni di mercato: Mercati in trend: I
Quant Direction
Georgios Kalomoiropoulos
Quant Direction è uno strumento di analisi di mercato 3D. Offre un'analisi di mercato perfettamente oggettiva, basata su algoritmi, calcolando con precisione le deviazioni percentuali su diversi parametri. Sviluppato utilizzando strumenti di modellazione avanzati basati sull'intelligenza artificiale e rigorosamente testato, questo algoritmo analizza il mercato con una precisione senza pari. È possibile analizzare qualsiasi coppia di valute o strumento finanziario sulla piattaforma. Che si pratic
Trend Lines PRO
Roman Podpora
5 (2)
LINEE DI TENDENZA PRO       Aiuta a capire dove il mercato sta realmente cambiando direzione. L'indicatore mostra reali inversioni di tendenza e punti in cui i principali attori rientrano. Vedi  Linee BOS   Cambiamenti di tendenza e livelli chiave su timeframe più ampi, senza impostazioni complesse o rumore inutile. I segnali non vengono ridisegnati e rimangono sul grafico dopo la chiusura della barra. VERSIONE MT 5     -      Svela il suo massimo potenziale se abbinato all'indicatore   RFI LEVE
AW Prime Oscillator
AW Trading Software Limited
5 (1)
Una combinazione di due oscillatori. Il primo mostra i punti di ingresso, il secondo mostra l'andamento attuale. L'indicatore può visualizzare i segnali dell'oscillatore tramite frecce in due modalità, tutti i segnali dell'oscillatore veloce o segnali solo nella direzione della tendenza attuale. Ha un pannello multi-intervallo temporale e tre tipi di notifiche di segnali. Benefici: Adatto per il trading giornaliero e scalping Filtraggio delle tendenze Configurazione semplice e sensibile Pannello
Atomic Analyst
Issam Kassas
5 (14)
Atomic Analyst — MetaTrader 4 Per domande sul prodotto, indicazioni sulla configurazione o supporto tecnico, scrivimi direttamente qui su MQL5. L’indicatore trasforma calcoli complessi del mercato in semplici segnali visivi, candele colorate, letture del trend, livelli di stop-loss e diverse zone di take-profit che i trader possono capire rapidamente e usare in condizioni reali di mercato. Principali utilizzi di trading: Scalping e trading intraday: Progettato per decisioni rapide, frecce chiar
M1 Sniper
Oleg Rodin
4.97 (30)
M1 SNIPER è un sistema di indicatori di trading facile da usare. Si tratta di un indicatore a freccia progettato per l'intervallo temporale M1. L'indicatore può essere utilizzato come sistema autonomo per lo scalping sull'intervallo temporale M1 e come parte del tuo sistema di trading esistente. Sebbene questo sistema di trading sia stato progettato specificamente per il trading sull'intervallo temporale M1, può comunque essere utilizzato anche con altri intervalli temporali. Inizialmente ho pro
SIO Oscillator: oscillatore auto-ottimizzante dello squilibrio di semivarianza Acquista l’indicatore e ricevi GRATIS l’Expert Advisor (EA) basato su di esso. La maggior parte degli oscillatori tratta ogni movimento di prezzo allo stesso modo. SIO separa la pressione rialzista da quella ribassista e misura lo squilibrio tra le due, mostrando quale parte controlla davvero il mercato: compratori o venditori. Quando lo squilibrio raggiunge un estremo, SIO genera un segnale chiaro con livelli di ingr
Hidden Cycles
Lev Vladimirovic Marushkin
5 (1)
The Only 100% Universal Tool! Stop trading against nature! This is your chance to secure the only indicator rooted in the absolute laws that govern the entire universe. Most tools guess—this one reveals the truth. Buy another toy or buy the truth. Your choice... Based on Universal Laws — NOT Some Guy’s Algorithm: Let the market adjust to the Hidden Cycles Geometry — not the other way around. Most indicators are based on a man-made formula. They often lag, fail over time, or need constant re-o
Neo Wave PRO
Nikolay Raykov
5 (1)
Price & Time Market Structure Indicator A professional market structure tool that analyzes waves through both price and time — not price alone. Main Description NeoWave PRO is a professional market structure indicator for MetaTrader 4 designed for traders who want to move beyond traditional one-dimensional wave tools such as ZigZag, swing indicators, and basic high/low systems. Most wave indicators analyze only one thing: Price. But a real market wave is not only a price movement. A true wave de
PZ Turning Points MT4
PZ TRADING SLU
1 (1)
Identify key turning points with reliable fractal analysis This indicator examines the price structure of fractals of different periods to determine possible reversal points in the market, providing timing to positional traders that already have a fundamental or technical valuation model. Unlike its younger brother, Reversal Fractals , this indicator won't miss reversals because of the period selected, and will find reversal fractals on a zig-zag fashion, ignoring those reversals which do not
CRT Multi-Timeframe Market Structure & Liquidity Sweep Indicator Non-Repainting | Multi-Asset | MT5 Version Available MT5 Version:   https://www.mql5.com/en/market/product/162075 Full User Guide — explains what each feature does and why:   https://www.mql5.com/en/blogs/post/767525 Quick Start User Guide  — explains how to configure and in what order:  https://www.mql5.com/en/blogs/post/767540 Indicator Overview CRT Ghost Candle HTF Fractal is a complete institutional-grade market structure too
Gann Time Clusters
Martin Eshleman
2.5 (2)
Gann Time Clusters Indicator This indicator is based on W. D. Gann's Square of 9 method for the time axis. It uses past market reversal points and applies the mathematical formula for Gann's Square of 9 and then makes projections into the future. A date/time where future projections line up is called a 'time cluster'. These time clusters are drawn as vertical lines on the right side of the chart where the market has not advanced to yet. A time cluster will result in a market reversal point (ex.
Non repaint MT4
Yan Zhen Du
5 (1)
This is a professional chart indicator designed for traders focused on stability and clear price action. It helps filter market noise and provides clear visual entry and exit zones for your trading decisions. Core Features: Strictly Non-Repainting: The system is built with strict non-repaint logic. What you see on the chart is the true historical performance. Confirmed Signals: Signals are triggered and confirmed only after the candle closes . Once a trading arrow appears on a closed candle, it
Forex Breath System è un sistema di trading basato sui trend che può essere utilizzato con qualsiasi mercato. Puoi utilizzare questo sistema con valute, metalli, materie prime, indici, criptovalute e persino azioni. Può essere utilizzato anche con qualsiasi intervallo di tempo. Il sistema è universale. Mostra la tendenza e fornisce segnali di freccia con la tendenza. L'indicatore può anche fornirti un tipo speciale di avvisi quando i segnali appaiono nella direzione del trend, il che rende il tr
Advanced Supply Demand
Bernhard Schweigert
4.91 (302)
Speciale Trading- SCONTO DEL 30% La soluzione migliore per qualsiasi trader principiante o esperto! Questo indicatore è uno strumento di trading unico, di alta qualità e conveniente, perché abbiamo incorporato una serie di funzionalità proprietarie e una nuova formula. Con questo aggiornamento, potrai visualizzare doppie zone di timeframe. Non solo potrai visualizzare un TF più alto, ma anche entrambi, il TF del grafico e il TF più alto: MOSTRA ZONE ANNIDATE. Tutti i trader che operano con Of
ATTUALMENTE SCONTATO DEL 40%! La soluzione migliore per ogni principiante o trader esperto! Questo indicatore è uno strumento di trading unico, di alta qualità e conveniente perché abbiamo incorporato una serie di caratteristiche proprietarie e una formula segreta. Con un solo grafico fornisce avvisi per tutte le 28 coppie di valute. Immaginate come migliorerà il vostro trading perché sarete in grado di individuare l'esatto punto di innesco di una nuova tendenza o opportunità di scalping! Co
Super Signal – Skyblade Edition Sistema professionale di segnali di tendenza senza repaint / senza ritardo con tasso di vincita eccezionale | Per MT4 / MT5 Funziona meglio su timeframe più bassi, come 1 minuto, 5 minuti e 15 minuti. Caratteristiche principali: Super Signal – Skyblade Edition è un sistema intelligente di segnali progettato specificamente per il trading di tendenza. Utilizza una logica di filtraggio multilivello per identificare esclusivamente i movimenti direzionali forti, supp
Liquidity Scalper System: un sistema di trading basato sulla liquidità in formato indicatore. La maggior parte degli indicatori mostra solo una freccia, poi è il trader a decidere dove mettere lo stop, dove si trova il target e se fidarsi del segnale. Liquidity Scalper System copre l'intero ciclo del trade: trova i pool di liquidità, dà un segnale alla loro rottura, calcola subito Entry, Stop Loss e tre target, e mostra sul pannello le statistiche e i risultati della verifica su dati nuovi. Il
Market Reversal Alerts
Lee Samson
4.19 (114)
Il profitto dalla struttura del mercato cambia quando il prezzo si inverte e si ritira. L'indicatore di avviso di inversione della struttura del mercato identifica quando una tendenza o un movimento di prezzo si sta avvicinando all'esaurimento e pronto a invertire. Ti avvisa dei cambiamenti nella struttura del mercato che in genere si verificano quando stanno per verificarsi un'inversione o un forte pullback. L'indicatore identifica inizialmente i breakout e lo slancio del prezzo, ogni volta c
Gann Made Easy
Oleg Rodin
4.84 (174)
Gann Made Easy è un sistema di trading Forex professionale e facile da usare che si basa sui migliori principi del trading utilizzando la teoria di mr. WD Gann. L'indicatore fornisce segnali ACQUISTA e VENDI accurati, inclusi i livelli di Stop Loss e Take Profit. Puoi fare trading anche in movimento utilizzando le notifiche PUSH. CONTATTAMI DOPO L'ACQUISTO PER RICEVERE GRATUITAMENTE LE ISTRUZIONI DI TRADING E OTTIMI INDICATORI EXTRA! Probabilmente hai già sentito parlare molte volte dei metodi d
Neuro Poseidon MT4
Daria Rezueva
4.74 (46)
Neuro Poseidon is a new indicator by Daria Rezueva. It combines precise trading signals with adaptive TP/SL levels - creating best possible trades as a result! Message me and get  Neuro Poseidon Assistant  as a gift to automize your trading process! What makes it stand out? 1. Proven profitability on all assets and timeframes 2. Only confirmed BUY and SELL signals present on the chart 3. Adaptive TP & SL levels generated by the software for each trade 4. Easy to understand - suitable for all
Break and Retest Hunter MT4 is a powerful MetaTrader 5 indicator designed to automatically identify support and resistance levels, breakout structures, and potential retest opportunities in real time. Bonus Indicator: After purchasing Break and Retest Hunter , contact me to receive Trade Indicator Assistant EA completely free as a bonus utility. $65 for the next 10 copies . Next price is $120.  Combining adaptive market analysis, clear BUY/SELL signals, Fibonacci-based profit targets, and a pre
Gold Channel is a volatility-based indicator, developed with a specific timing algorithm for the XAUUSD pair, which consists of finding possible corrections in the market. This indicator shows two outer lines, an inner line (retracement line) and an arrow sign, where the theory of the channel is to help identify overbought and oversold conditions in the market. The market price will generally fall between the boundaries of the channel. If prices touch or move outside the channel it is a tradi
Attualmente 30% di sconto! La soluzione migliore per ogni principiante o trader esperto! Questo software per cruscotti funziona su 28 coppie di valute. Si basa su 2 dei nostri indicatori principali (Advanced Currency Strength 28 e Advanced Currency Impulse). Offre un'ottima panoramica dell'intero mercato Forex. Mostra i valori di forza delle valute avanzate, la velocità di movimento delle valute e i segnali per 28 coppie Forex in tutti i (9) timeframe. Immaginate come migliorerà il vostro tra
Italo Volume Indicator
Italo Santana Gomes
4.92 (79)
BUY INDICATOR AND GET EA FOR FREE AS A BONUS + SOME OTHER GIFTS! ITALO VOLUME INDICATOR  is the best volume indicator ever created, and why is that? The Indicator works on all time-frames and assets, indicator built after 7 years of experience on forex and many other markets. You know many volume indicators around the internet are not complete, does not help, and it's difficult to trade, but the Italo Volume Indicator is different , the Italo Volume Indicator shows the wave volume, when market
Altri dall’autore
The Daily Dipper Skipper is an on-chart dashboard that watches a list of symbols on several timeframes at once and shows where RSI is in, or approaching, an oversold ("dip") or overbought ("rip") zone. It is a monitoring and alerting tool. It does not open, modify or close trades. It reads RSI on D1, H4, H1, M30 and M15. Each symbol is given a class from A to E that sets how many of those timeframes it is watched on, so your most-traded instruments can be watched on all five while quieter ones s
A volatility squeeze is when the Bollinger Bands contract inside the Keltner Channel. Price is coiling, and the release that follows is often a strong move. Finding squeezes by hand across dozens of charts and timeframes is slow. CalmFx Squeeze Ranker scans your symbol list, or your whole Market Watch filtered by asset class, from a single chart and scores every market from 0 to 100, with the tightest coils at the top. How the score works Compression: how deep the Bollinger Bands sit inside the
A quiet session on a symbol that normally moves a lot has to resolve somewhere. CalmFx Session Range Ranker measures how tight a reference session's range was (Tokyo by default) against each symbol's own average daily range. It ranks your whole watchlist from 0 to 100 and shows the break levels next to the score, so you can see which markets are coiled ahead of the next session and where they would break. How the score works Compression: the session range as a percentage of the symbol's average
Markets that stretch too far from their mean tend to snap back. CalmFx Snap Ranker scans your symbol list, or your whole Market Watch, from a single chart and scores how stretched each market is from 0 to 100. The strongest snap-back candidates appear at the top, each with its expected direction. How the score works RSI: how far RSI is past its overbought or oversold level. Band position: how far price sits across the Bollinger Bands. 100 means at a band, and higher means it has closed outside.

Markets that move strongly and cleanly in one direction tend to keep going. CalmFx Surge Ranker scans your symbol list, or your whole Market Watch, from a single chart and scores the strength and cleanliness of each market's current move from 0 to 100. The strongest, cleanest trends appear at the top, each with its direction. How the score works Momentum: the rate of change measured in ATR units, so a currency pair, an index and gold can be compared fairly. Trend quality: how straight the move i
See the trend on nine timeframes at once. CalmFx MultiTF Trend Dashboard reads M1, M5, M15, M30, H1, H4, D1, W1 and MN on the chart symbol and shows each one as BULL, BEAR or MIX, with how long that reading has held and an overall bias across the board. What it shows One row per timeframe, from a fast moving average against a slow one (8 and 200 by default). A timer on each row showing how long the current reading has held. An overall bias and an agreement meter showing how aligned the nine time
The four forex sessions at a glance. CalmFx Sessions Clock shows which of Sydney, Tokyo, London and New York are open, a live countdown to the next open or close, and how far each open session has run. What it shows Open or closed for each session, with its hours in GMT. A live countdown to the next open or close. Progress through each open session. The server time and GMT in the title bar. Daylight saving handled properly London, New York and Sydney change their clocks on different dates, and S
FREE
Three moving averages drawn as two coloured clouds, so trend, pullback and turn are visible at a glance. CalmFx Trend Ribbon shades between the fast and mid averages, and between the mid and slow averages, and each cloud changes colour with its direction. What it draws A fast-to-mid cloud for the quick read and a mid-to-slow cloud for the structure. The three moving average lines on top (8, 38 and 200 by default). Periods, method and applied price are inputs. An optional Bollinger envelope drawn
CalmFx Trading Panel is an on-chart panel for manual trading in MetaTrader 5. It places market and pending orders in one click, manages open positions with a trailing stop and a hedge button, and shows sessions, multi-timeframe trend, RSI alerts and the economic calendar on the same chart. The panel works on any symbol. Distance settings such as take profit, trailing stop and pending order offsets are scaled automatically to each market's average daily range, so the same settings behave consiste
The Daily Dipper Skipper is an on-chart dashboard that watches a list of symbols on several timeframes at once and shows where RSI is in, or approaching, an oversold ("dip") or overbought ("rip") zone. It is a monitoring and alerting tool. It does not open, modify or close trades. It reads RSI on D1, H12, H8, H4 and H1. Each symbol is given a class from A to E that sets how many of those timeframes it is watched on, so your most-traded instruments can be watched on all five while quieter ones st
A volatility squeeze is when the Bollinger Bands contract inside the Keltner Channel. Price is coiling, and the release that follows is often a strong move. Finding squeezes by hand across dozens of charts and timeframes is slow. CalmFx Squeeze Ranker scans your symbol list, or your whole Market Watch filtered by asset class, from a single chart and scores every market from 0 to 100, with the tightest coils at the top. How the score works Compression: how deep the Bollinger Bands sit inside the
A quiet session on a symbol that normally moves a lot has to resolve somewhere. CalmFx Session Range Ranker measures how tight a reference session's range was (Tokyo by default) against each symbol's own average daily range. It ranks your whole watchlist from 0 to 100 and shows the break levels next to the score, so you can see which markets are coiled ahead of the next session and where they would break. How the score works Compression: the session range as a percentage of the symbol's average
Markets that stretch too far from their mean tend to snap back. CalmFx Snap Ranker scans your symbol list, or your whole Market Watch, from a single chart and scores how stretched each market is from 0 to 100. The strongest snap-back candidates appear at the top, each with its expected direction. How the score works RSI: how far RSI is past its overbought or oversold level. Band position: how far price sits across the Bollinger Bands. 100 means at a band, and higher means it has closed outside.
Markets that move strongly and cleanly in one direction tend to keep going. CalmFx Surge Ranker scans your symbol list, or your whole Market Watch, from a single chart and scores the strength and cleanliness of each market's current move from 0 to 100. The strongest, cleanest trends appear at the top, each with its direction. How the score works Momentum: the rate of change measured in ATR units, so a currency pair, an index and gold can be compared fairly. Trend quality: how straight the move i
See the trend on ten timeframes at once. CalmFx MultiTF Trend Dashboard reads M1, M5, M15, M30, H1, H2, H4, H8, H12 and D1 on the chart symbol and shows each one as BULL, BEAR or MIX, with how long that reading has held and an overall bias across the board. What it shows One row per timeframe, from a fast moving average against a slow one (8 and 200 by default). A timer on each row showing how long the current reading has held. An overall bias and an agreement meter showing how aligned the ten t
The four forex sessions at a glance. CalmFx Sessions Clock shows which of Sydney, Tokyo, London and New York are open, a live countdown to the next open or close, and how far each open session has run. What it shows Open or closed for each session, with its hours in GMT. A live countdown to the next open or close. Progress through each open session. The server time and GMT in the title bar. Daylight saving handled properly London, New York and Sydney change their clocks on different dates, and S
FREE
Support and resistance zones drawn from where price has actually turned. CalmFx SR Zones finds swing highs and lows, merges the ones that sit close together into zones, and counts how many times each zone has been touched. Only zones with enough touches are drawn. How the zones are built Swing points are found with a strength you choose (bars on each side). Swing points within a fraction of ATR are merged into one zone, so the zone width suits the market: the same inputs work on a currency pair,
Three moving averages drawn as two shaded clouds, so trend, pullback and turn are visible at a glance. CalmFx Trend Ribbon shades between the fast and mid averages, and between the mid and slow averages, and each cloud changes colour with its direction. What it draws A fast-to-mid cloud for the quick read and a mid-to-slow cloud for the structure. The three moving average lines on top (8, 38 and 200 by default). Periods, method and applied price are inputs. An optional Bollinger envelope drawn a
Filtro:
Nessuna recensione
Rispondi alla recensione