CalmFx Trading Panel MT5
- Utilità
-
Callum Gunn
 CalmFx - calm, clear trading tools for MetaTrader 5.
I build and support the CalmFx toolkit: on-chart panels, multi-symbol scanners and indicators designed to work side by side on the same charts, on any symbol and any screen size, from a laptop to a 40-inch TV.
CalmFx on the Market: - Versione: 2.50
- Attivazioni: 10
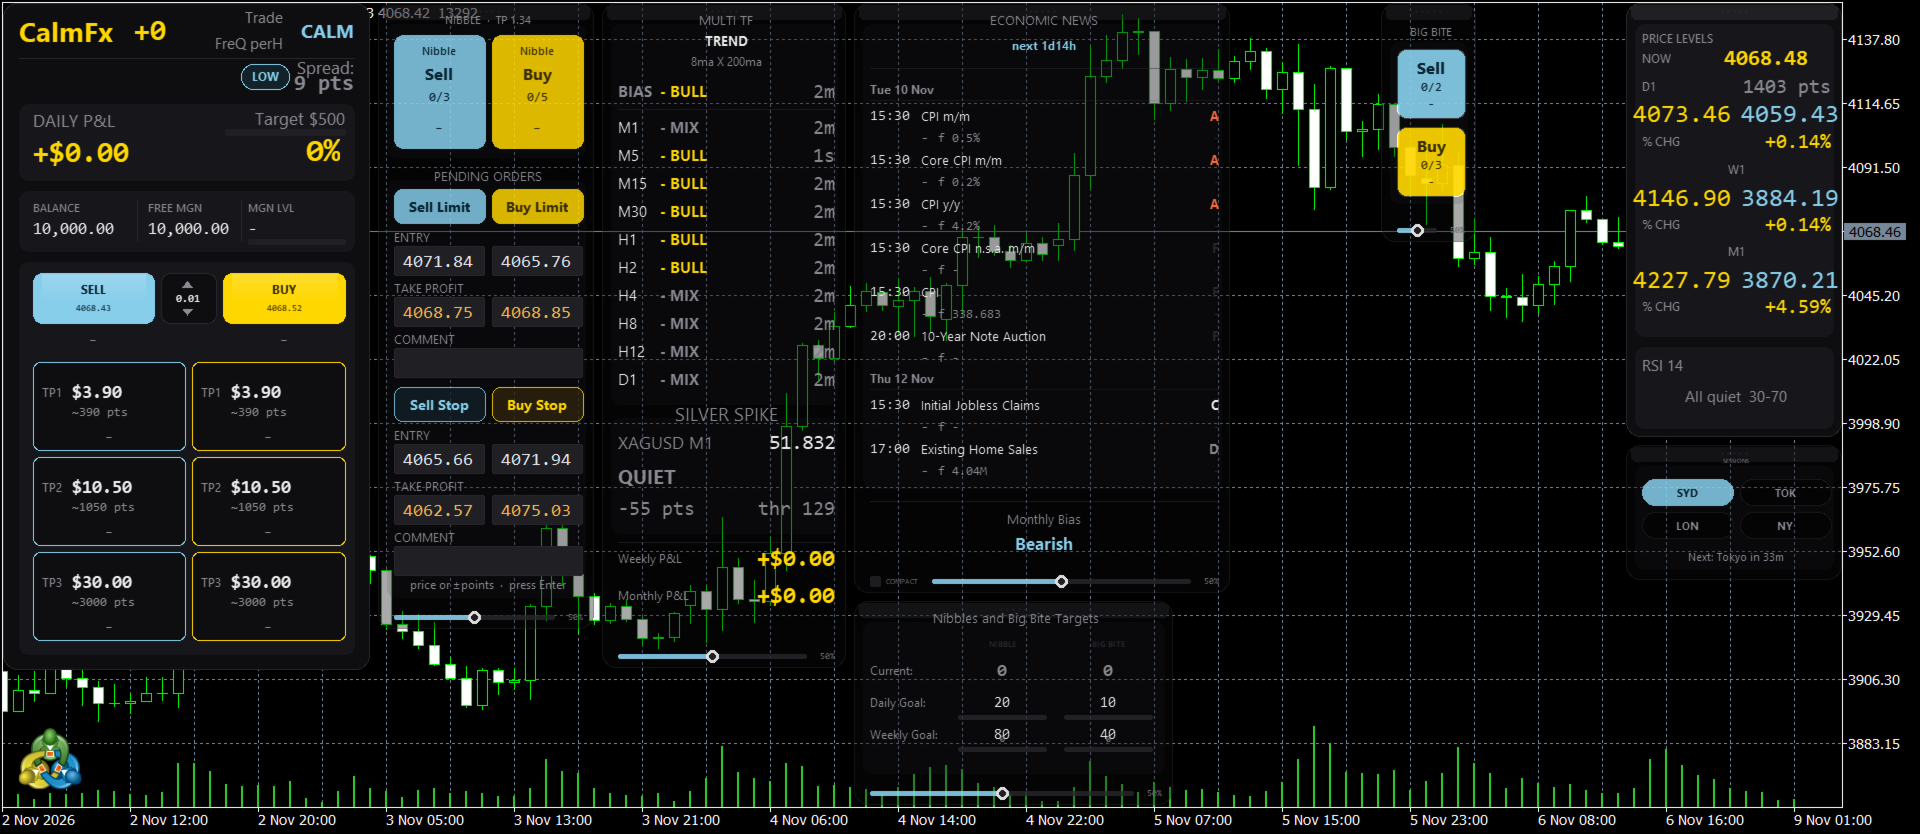
CalmFx Trading Panel is an on-chart panel for manual trading in MetaTrader 5. It places market and pending orders in one click, manages open positions with a trailing stop and a hedge button, and shows sessions, multi-timeframe trend, RSI alerts and the economic calendar on the same chart.
The panel works on any symbol. Distance settings such as take profit, trailing stop and pending order offsets are scaled automatically to each market's average daily range, so the same settings behave consistently on forex, metals, indices and crypto. A fixed-points mode is available if you prefer exact values.
Order execution
- Buy and Sell buttons with a lot size stepper.
- Three take-profit tiles (TP1, TP2, TP3) set in account currency, each with its own lot size. Select a tile, then click Buy or Sell.
- Nibble buttons for small fixed-target trades, and Big Bite buttons for larger ones, each with its own lot size, take profit and maximum number of open trades per side.
- Pending orders card: Buy Limit, Sell Limit, Buy Stop and Sell Stop, with entry and take-profit fields that accept an absolute price or an offset in points, an optional stop loss, expiry and order comment.
- Optional confirmation dialog for each order type.
Trade management
- Trailing stop for the panel's positions, with a start distance, trail distance and step, so the stop is moved in steps rather than on every tick.
- Hedge card with a Hedge Now button that opens an opposite position against the position furthest in loss, with limits on spacing and the number of hedges.
- Daily profit target and daily loss limit. When the loss limit is reached, the panel blocks new orders for the rest of the day.
- Optional cap on the total number of open positions from the panel.
Market information
- Header with symbol, spread and a spread state (calm, moderate or aggressive), plus floating profit and loss and an account row with balance, free margin and margin level.
- Price levels for the day, week and month, with the percentage change of each period.
- Sessions card showing the Sydney, Tokyo, London and New York sessions.
- Multi-timeframe trend from M1 to D1, comparing a fast and a slow moving average on each timeframe, with an overall bias and how long each signal has held.
- RSI alerts on nine timeframes from M5 to D1. A timeframe is listed only while its RSI is outside the overbought or oversold level.
- Economic calendar card with this week's high-impact events for the symbol's currencies, a countdown to the next release, a volatility grade, and the actual, forecast and previous values. After a release, the card shows whether the result was bullish or bearish for the symbol on the chart.
- Daily and weekly targets that count profitable Nibble and Big Bite closes.
- Silver spike alert that flags fast moves in XAGUSD on M1.
Layout
- Each card can be shown or hidden, dragged to a new position and given its own opacity.
- Panel size can be adjusted for small or large screens, and the panel fits itself to the chart: it grows on large monitors and TVs and shrinks on small laptop screens, so every card stays readable and nothing overlaps.
Safety checks
Before an order is sent, the panel checks the trading session, available margin, volume limits and the broker's minimum stop distance. If a check fails, the order is not sent and the reason is shown on the chart.
Notes
- Use a different magic number for each chart running the panel.
- The economic calendar requires the terminal to be online. In the Strategy Tester it uses a saved copy of the calendar if one exists.
- No DLLs and no external connections are used.
Part of the CalmFx toolkit
CalmFx makes calm, clear tools for MetaTrader 5, built to work side by side on the same charts:
- CalmFx Trading Panel MT5: one-click orders, take-profit tiles, trailing stop, hedge button, sessions, multi-timeframe trend and the economic calendar.
- Daily Dipper Skipper RSI Scanner: multi-symbol, multi-timeframe RSI dip and rip dashboard with alerts.
- CalmFx Squeeze Ranker MT5: ranks your watchlist by volatility squeeze, with a matching histogram and release alerts.
Questions or ideas? Leave a comment on this page and I will reply.