SMC Session Scanner MT5
- Indicatori
-
Allan Aparece Ninal
 Sviluppo indicatori ed Expert Advisor per MetaTrader 5.
Come lavoro:
- Ogni indicatore viene controllato contro il repainting: i segnali vengono decisi solo su barre chiuse, e un test su ogni tick conferma che non cambiano in seguito. - Versione: 1.0
- Attivazioni: 5
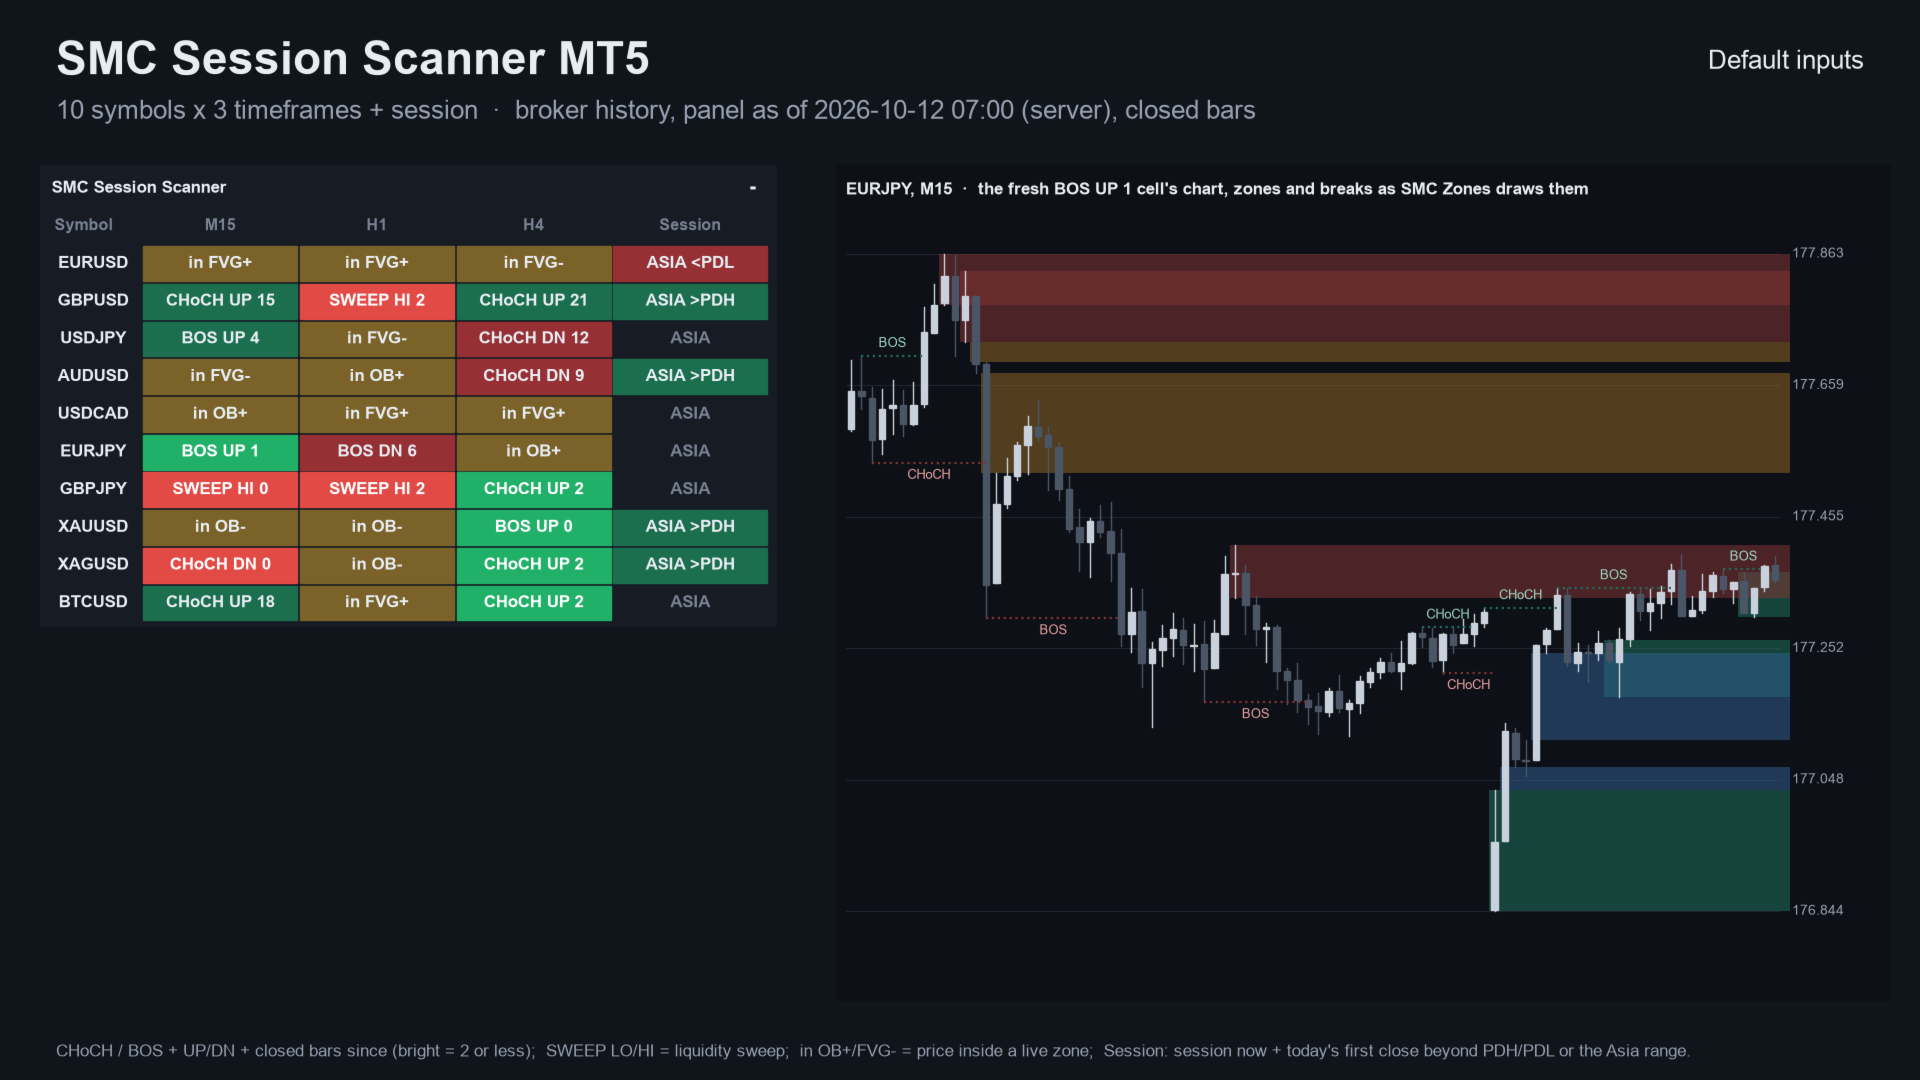
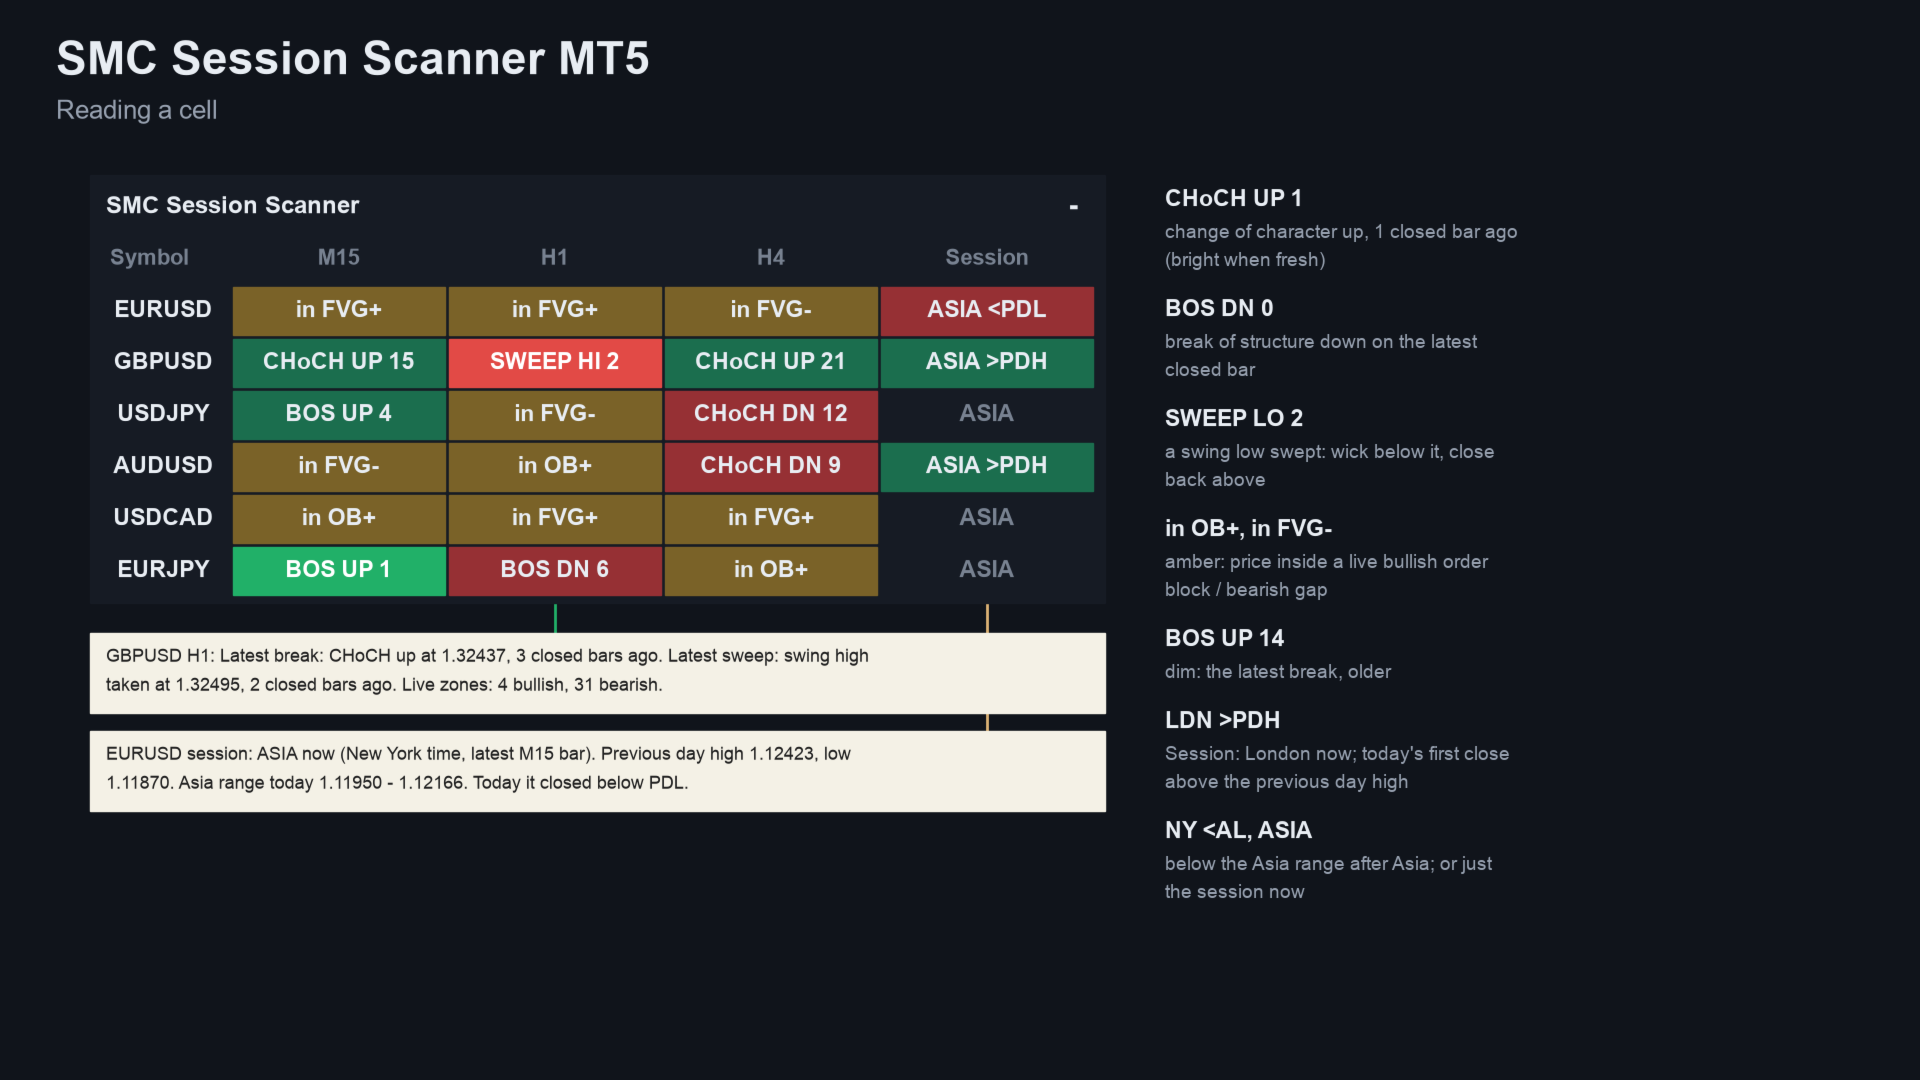
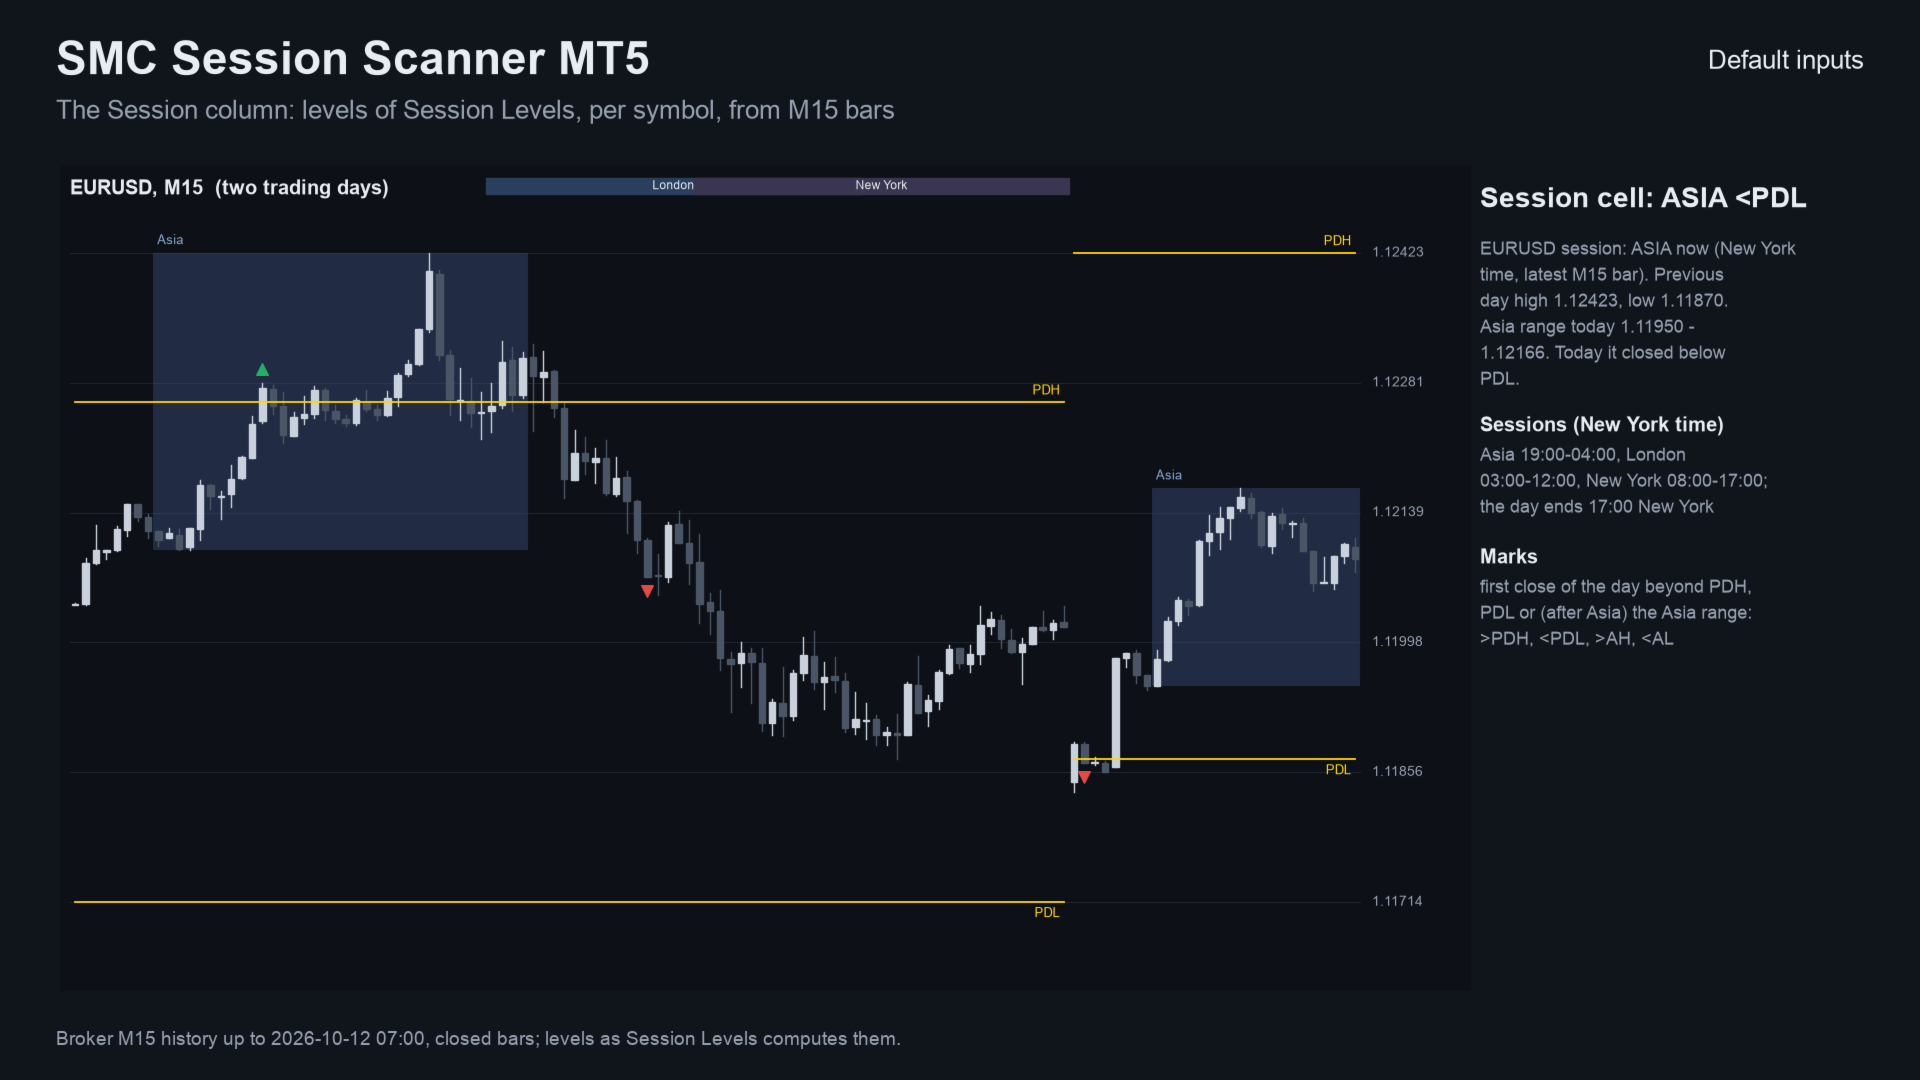
SMC Session Scanner MT5 is a panel indicator for MetaTrader 5 that watches many symbols and timeframes for smart-money structure and session levels. For each symbol and timeframe it shows one of these: a fresh break of structure (BOS), a change of character (CHoCH), or a fresh liquidity sweep. It also shows price inside a live order block or fair value gap. Otherwise it shows the latest break and how long ago it was. A Session column shows the session now. It also shows today's first close beyond the previous day high or low, or the Asia range.
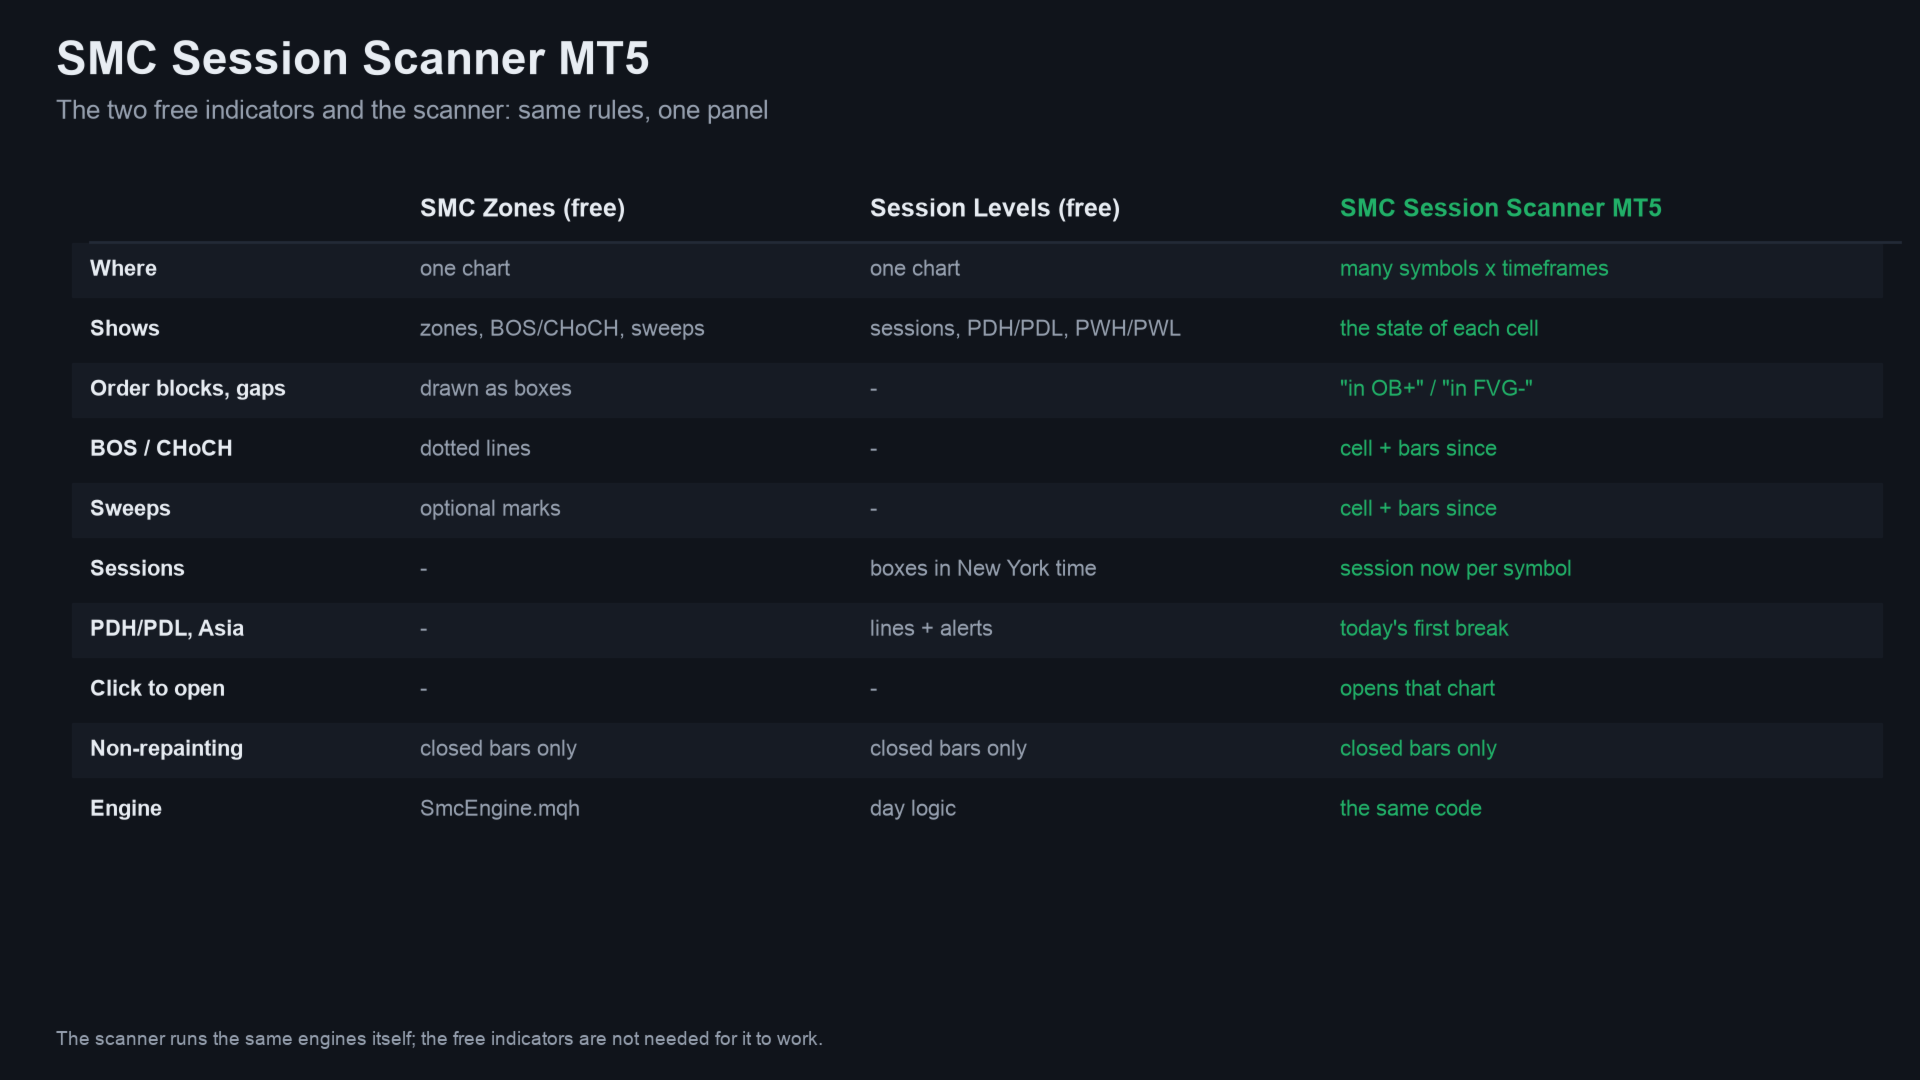
It places no trades and uses closed bars only. A cell never changes after its bar has closed. It uses the same rules as my free indicators SMC Zones and Session Levels, so the panel agrees with what they draw.
Quick start
- Attach it to any chart. By default it scans your Market Watch symbols on M15, H1 and H4.
- To scan your own list, set Which symbols to your list and fill in My list. Change Timeframes if you want others.
- Check the session times (New York time) and leave Broker server clock on Auto. Choose your alerts and the delivery: pop-up, sound, push or e-mail.
- Click a cell to open that symbol and timeframe (the Session column opens M15).
Per symbol and timeframe
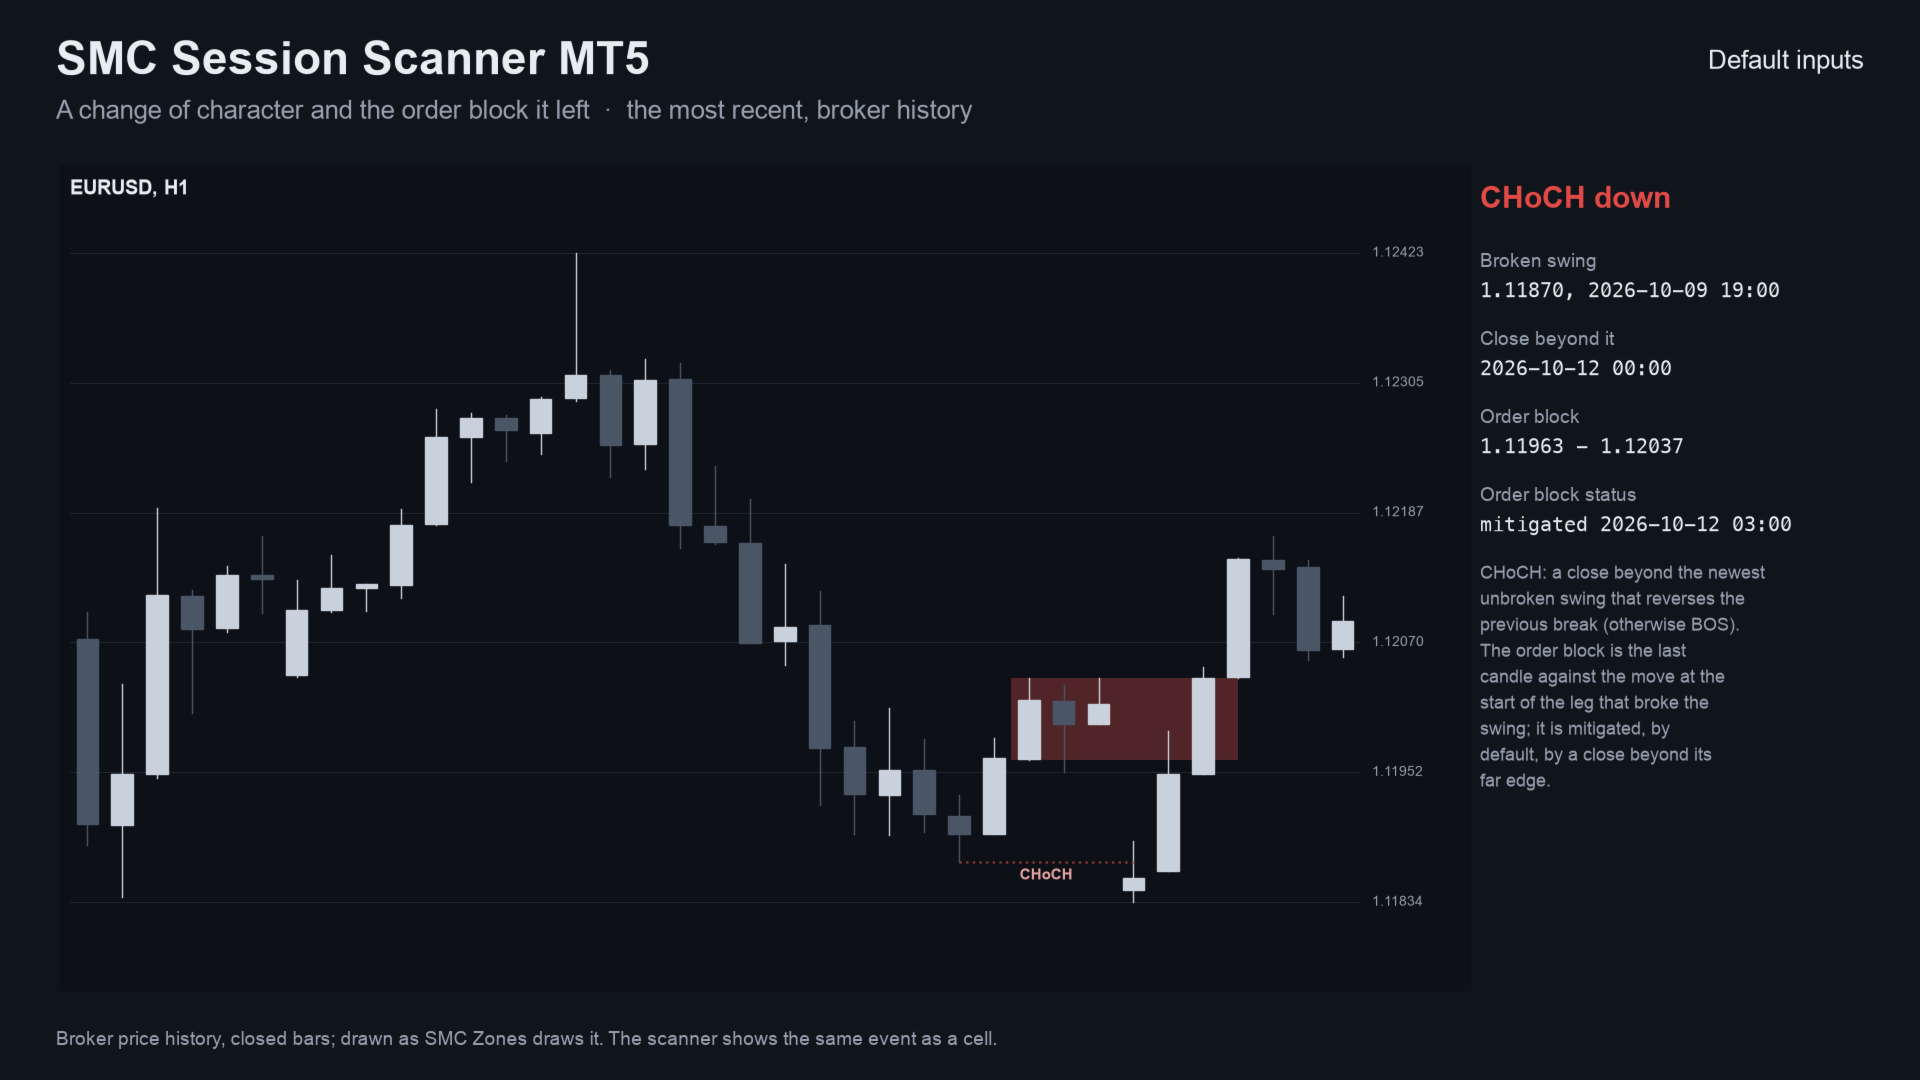
- BOS and CHoCH: a close beyond the last unbroken swing (swing strength 3 bars by default). It is a CHoCH when it reverses the previous break.
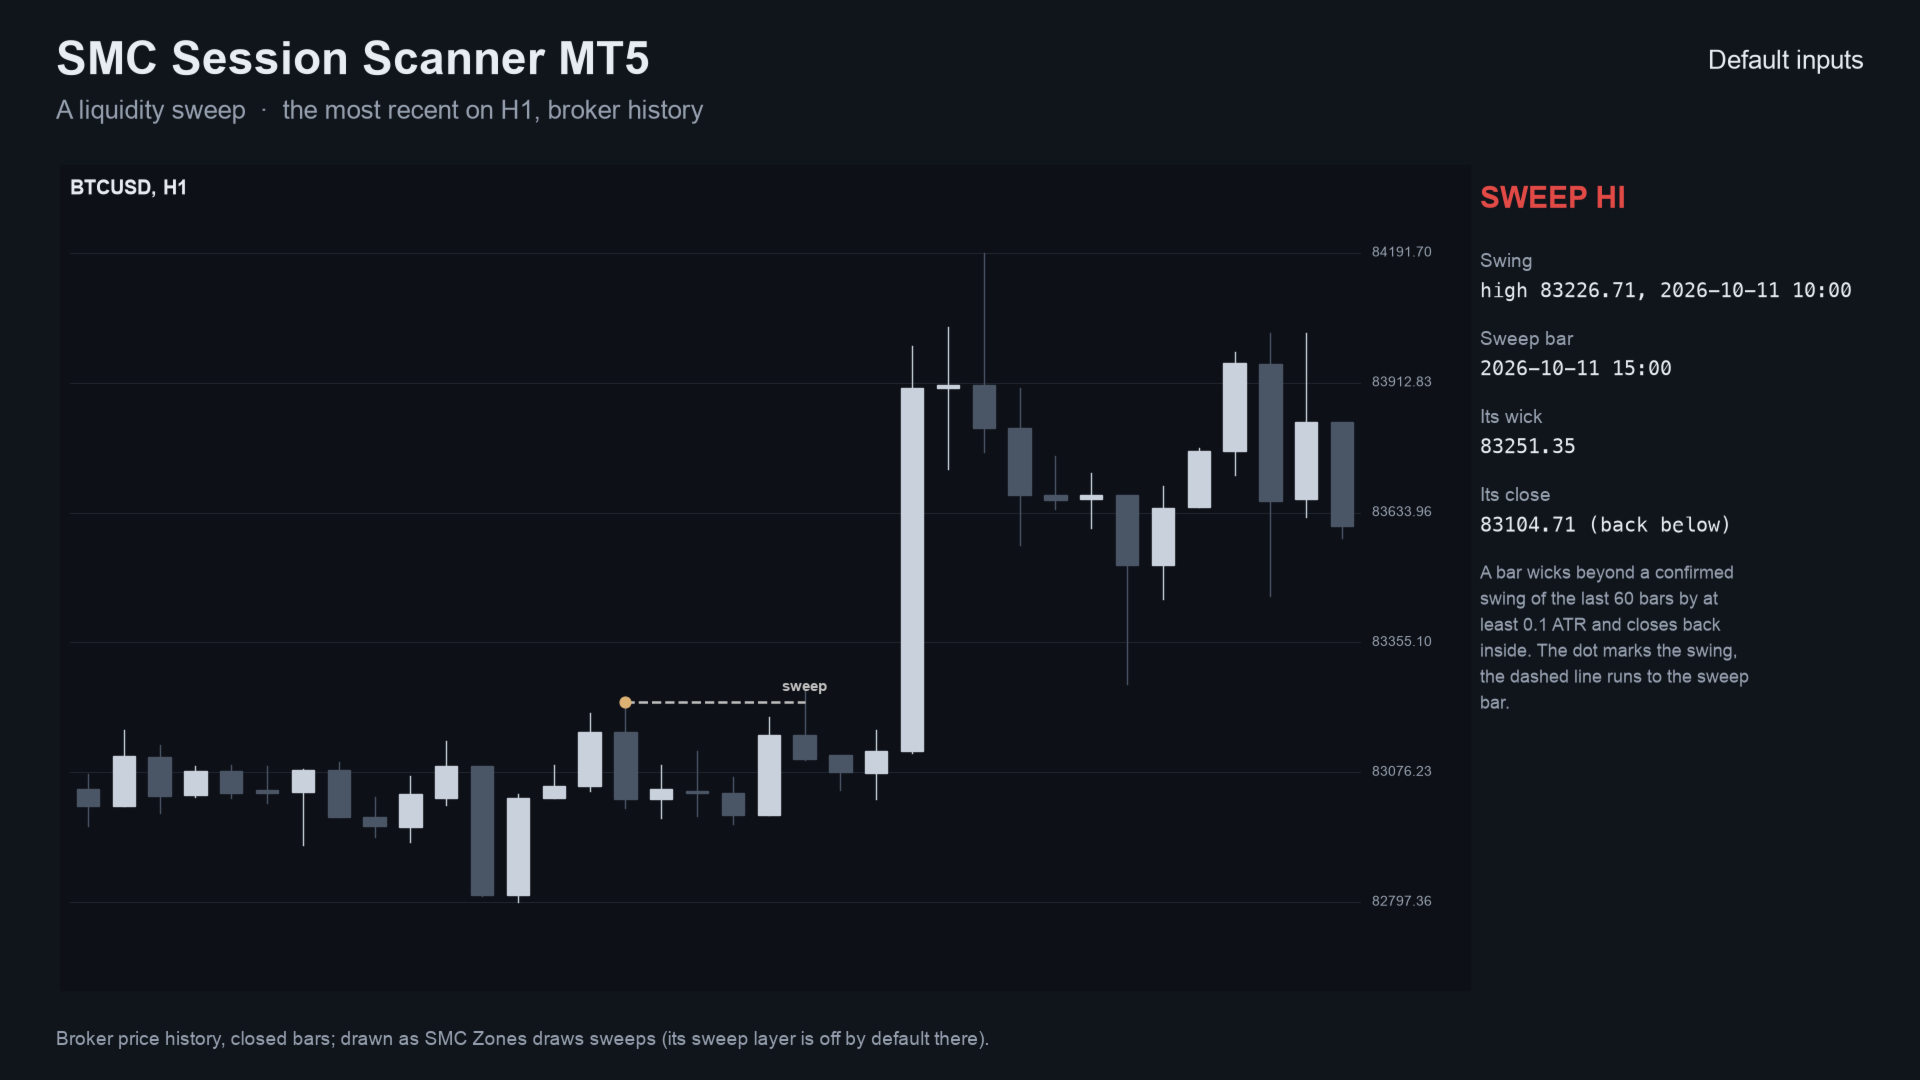
- Liquidity sweeps: a wick beyond a recent swing by at least 0.1 ATR that closes back inside.
- Zones: order blocks and fair value gaps stay live until mitigated (by a close, a wick, the midpoint or a touch, as you choose). The cell reads "in OB+" or "in FVG-" when price is inside one.
- The tooltip gives the levels, the zone prices and how many bars ago each event was.
Session column (per symbol, from M15 bars)
- The session now in New York time: Asia, London, New York or London + New York, with the times you set.
- Level breaks: today's first close above the previous day high (>PDH) or below the previous day low (<PDL). After Asia it also shows a close above or below the Asia range (>AH, <AL). The trading day ends at 17:00 New York.
- The broker clock is detected (New York close, European or fixed offset), so the sessions are right on any broker and through daylight saving.
Alerts and clicks
- Alerts for CHoCH, BOS, sweeps, previous-day breaks and Asia-range breaks. Each is switchable. Delivery is pop-up, sound, push or e-mail. Alerts of the same second come as one message.
- Click a cell to open that symbol and timeframe.
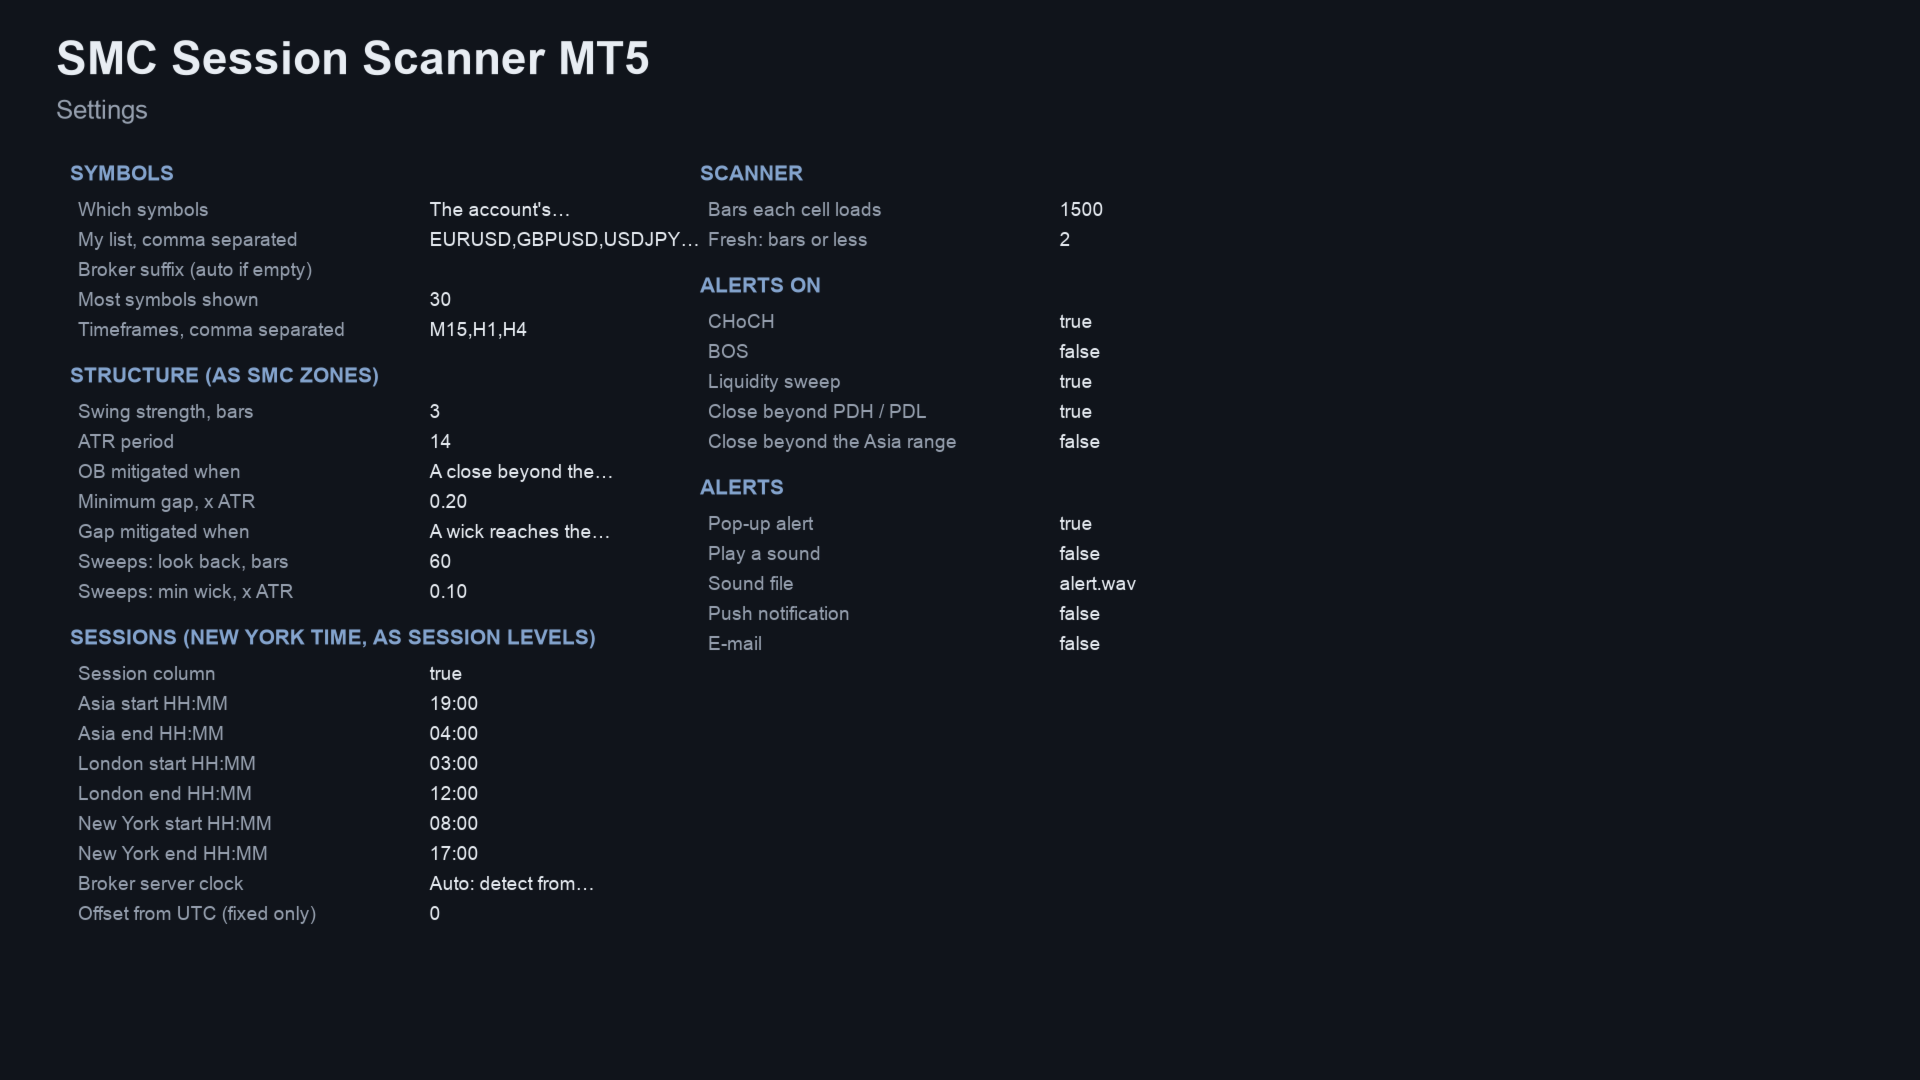
Inputs (main)
| Input | Default |
|---|---|
| Symbols | Market Watch - or your list; timeframes - M15,H1,H4 |
| Structure | swing 3, ATR 14, order block mitigated by a close beyond it, gap by a wick through it, minimum gap 0.2 ATR |
| Sessions | Asia 19:00-04:00, London 03:00-12:00, New York 08:00-17:00 (New York time); broker clock auto |
| Closed bars each cell starts from | 1500; fresh - 2 bars |
| Alerts | CHoCH, sweeps and previous-day breaks on; BOS and Asia off |
Questions
- Does it repaint? No. Swings are confirmed 3 bars after they form, and every event is decided on a closed bar and never changed.
- Do I need SMC Zones and Session Levels? No. This scanner runs the same logic itself. The free indicators help you see the zones and boxes on a chart.
Related products
- SMC Zones — the chart indicator for order blocks, fair value gaps and BOS / CHoCH lines. The scanner uses its structure rules.
- Session Levels — the chart indicator for session boxes and previous day and week levels. The scanner uses its session rules.
- All my products on MQL5
If it helps your trading, a short review on this page helps other traders find it.
Questions: use the comments on this page or send me a message on MQL5.
Trading involves risk. The scanner reports chart structure; it does not tell you to buy or sell.