Supply and Demand with Fibonacci and Classic Pivot
- Indicatori
- Versione: 1.0
- Attivazioni: 5

Supply and Demand with Fibonacci and Classic Pivot
What it does
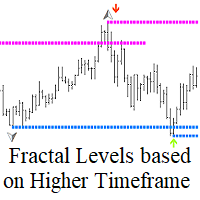
This indicator draws supply and demand zones on your chart from pivot points. Ordinary pivot indicators draw thin lines. This one draws zones (price areas), because price usually reacts to an area and rarely to one exact price. You can show up to 10 different periods at once (for example H1, H4, Daily and Weekly), and the indicator highlights the places where zones from different periods overlap.
Main features
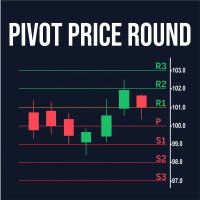
- Fibonacci pivots, Classic pivots, or both. Fibonacci levels are 0.382, 0.618 and 1.000. Classic (Floor Trader) levels are the standard R1–R3 and S1–S3.
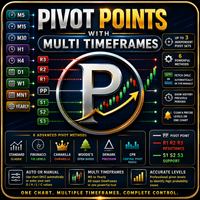
- Up to 10 independent period slots. Each slot has its own period (M5, M15, M30, H1, H4, Daily, Weekly, Monthly or Yearly). You can switch each one on or off separately.
- Confluence highlighting. When zones from two or more different periods overlap, the overlap is marked with a coloured box and a label such as "CONFLUENCE x2". These are often the stronger areas.
- Historical zones. Optionally show the zones of previous periods (1 to 5 back) as faded, dotted outlines, so you can see how price reacted to them.
- Auto or manual data. In Auto mode the indicator reads High, Low and Close from the chosen period. In Manual mode you type in your own High, Low and Close.
- Flexible zone width. Set the zone thickness as a percentage of the period range, as a fixed number of points, or based on ATR.
- Exact time span. Each zone ends exactly where its period ends (an H1 zone ends after one hour, a Daily zone after one day).
- Clear labels. Each zone shows its level name (R1, S2 and so on), the period, the method (FIB or STD) and the exact price.
- Alerts. Popup, push notification and sound when price enters a zone.
- Pivot Period Dashboard. A small panel that tells you whether the pivot point of a lower period is above or below the pivot point of the next higher period (5m vs 15m, 15m vs 1H, 1H vs 4H, 4H vs Daily, Daily vs Weekly, Weekly vs Monthly, Monthly vs Yearly). Green means above and red means below. It gives you a quick read of the multi-timeframe picture. You can drag it anywhere on the chart with the mouse, and it remembers its position.
- Light on the terminal. Zones are redrawn only when a period changes, not on every tick.
Advantages
- One indicator replaces several pivot indicators and separate supply/demand tools.
- Zones instead of lines match how price behaves in practice.
- Confluence is found for you, so you don't have to compare levels by eye.
- You choose how many periods, levels and colors are shown, so the chart stays clean.
- Works on any symbol and any chart timeframe.
Input parameters
Pivot Calculation
- Pivot Point Type: Fibonacci, Classic, or Both.
Slots 1–10 (the same set of inputs for every slot)
- Enable: turn the slot on or off. Only Slot 1 is on by default.
- Period: the pivot period for the slot (M5, M15, M30, H1, H4, D1, W1, MN1, Yearly).
- Mode: Auto (High/Low/Close taken automatically) or Manual (you enter them).
- Manual High / Manual Low / Manual Close: the values used in Manual mode.
- History: show zones of previous periods for this slot. Not available in Manual mode.
- History Count: how many previous periods to show (1–5).
Zone Settings (apply to all slots)
- Zone Width Mode: % of Range, Fixed Points, or ATR.
- Width % of Range: thickness as a percentage of the period's High–Low range (default 10).
- Width in Points: thickness in points when using Fixed Points mode (default 500).
- ATR Period / ATR Multiplier: settings for ATR mode (default 14 and 0.5). Yearly slots fall back to % of Range.
- Zone Placement: Directional (the zone extends away from the pivot only) or Symmetrical (the zone is center on the level).
- Show R3/S3, R2/S2, R1/S1 zones: choose which levels to draw.
- Show Pivot (P) line: show the central pivot line.
History Style
- Fade History: draw historical zones as dotted outlines without fill.
Colors
- Resistance Color / Support Color / Pivot Line Color.
Confluence
- Highlight overlapping zones: turn confluence detection on or off.
- Confluence Color: color of the overlap box.
- Min. Periods: how many different periods must overlap to be marked (default 2).
Display
- Fill Zones: fill the zones or draw outlines only.
- Draw as Background: put the zones behind the candles.
- Show Labels: show the level, period and price labels.
- Label Font Size.
Alerts
- Enable Alerts: alerts when price enters a zone.
- Alert Only for R2/S2 (0.618) Zones: turn off to also get alerts for R1/S1 and R3/S3.
- Popup / Push Notification / Play Sound: choose the alert types.
- Sound File: the sound to play (default alert.wav).
Pivot Period Dashboard
- Show Dashboard: turn the panel on or off.
- Show 5m vs 15m … Monthly vs Yearly: seven switches, one for each comparison row.
- Panel Corner: the corner where the panel first appears.
- Font Size.
- Above / Below / N/A Colors: row colors.
- Show Background / Show Border / Border Color / Show Separator / Background Color: panel appearance.
- Draggable: allow moving the panel with the mouse.
- Reset Position: send the panel back to its starting corner on load (untick it afterwards).