AIS Correct Averages MT5
- Indicatori
- Versione: 3.0
- Aggiornato: 1 luglio 2022
- Attivazioni: 5

L'indicatore AIS Correct Averages consente di impostare l'inizio di un movimento di tendenza nel mercato. Un'altra importante qualità dell'indicatore è un chiaro segnale della fine del trend. L'indicatore non viene ridisegnato o ricalcolato.
Valori visualizzati
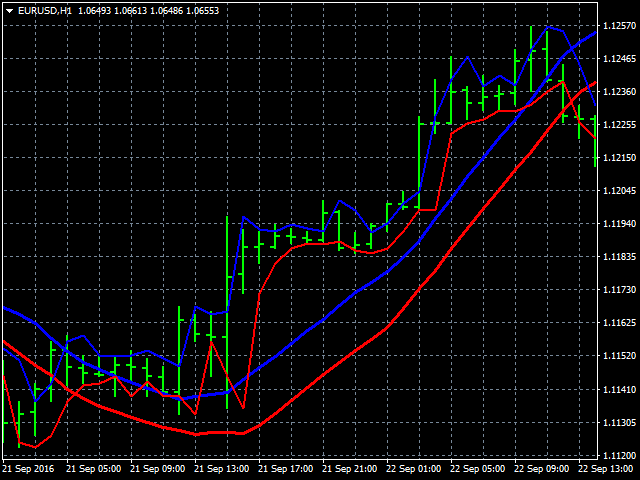
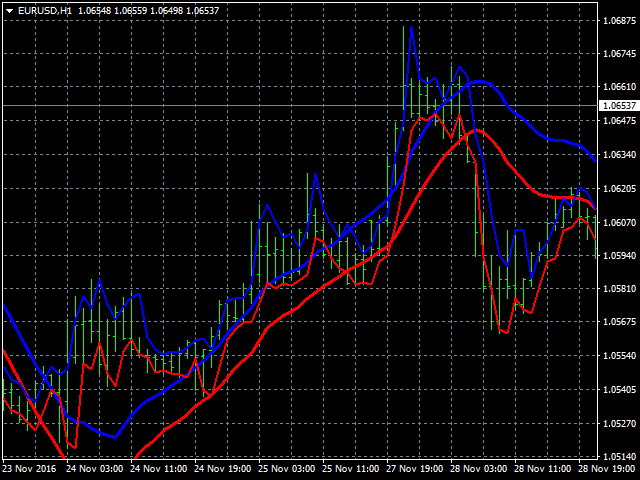
h_AE - limite superiore del canale AE
l_AE - limite inferiore del canale AE
h_EC - Valore previsto alto per la barra corrente
l_EC - Valore previsto basso per la barra corrente
Segnali quando si lavora con l'indicatore
Il segnale principale è l'intersezione dei canali AE ed EC.
Un trend rialzista può iniziare quando la linea l_EC è al di sopra della linea h_AE.
L'inizio di una tendenza al ribasso può essere previsto dopo che la linea h_EC scende al di sotto della linea l_AE.
In questo caso, occorre prestare attenzione alla larghezza del canale tra le linee h_AE e l_AE. Maggiore è la differenza tra loro, più forte sarà la tendenza. Dovresti anche prestare attenzione al raggiungimento di massimi/minimi locali da parte del canale AE. In questo momento, la tendenza delle variazioni di prezzo diventa la più forte.
Parametri dell'indicatore personalizzabili
L'impostazione dell'indicatore consiste nella selezione del parametro LRH in funzione dell'intervallo di tempo. L'intervallo di valori validi per questo parametro è compreso tra 1 e 350.
Più piccolo è questo parametro, più sensibile è l'indicatore e l'aumento dei falsi segnali è possibile. D'altra parte, questo parametro non dovrebbe essere impostato troppo alto, poiché l'indicatore diventerà meno sensibile e salterà i segnali.