ApeX Indicator ICT Concepts MT5
- Indicatori
- Versione: 2.80
- Attivazioni: 10

Eleven ICT tools on one chart — without turning your chart into a mess.
The drawings stay attached to price, remain transparent, and stay out of the way when you work with the chart.
Powered by ApeX ICT Concepts
A practical ICT toolkit built directly for MetaTrader 5.
____________________________________________
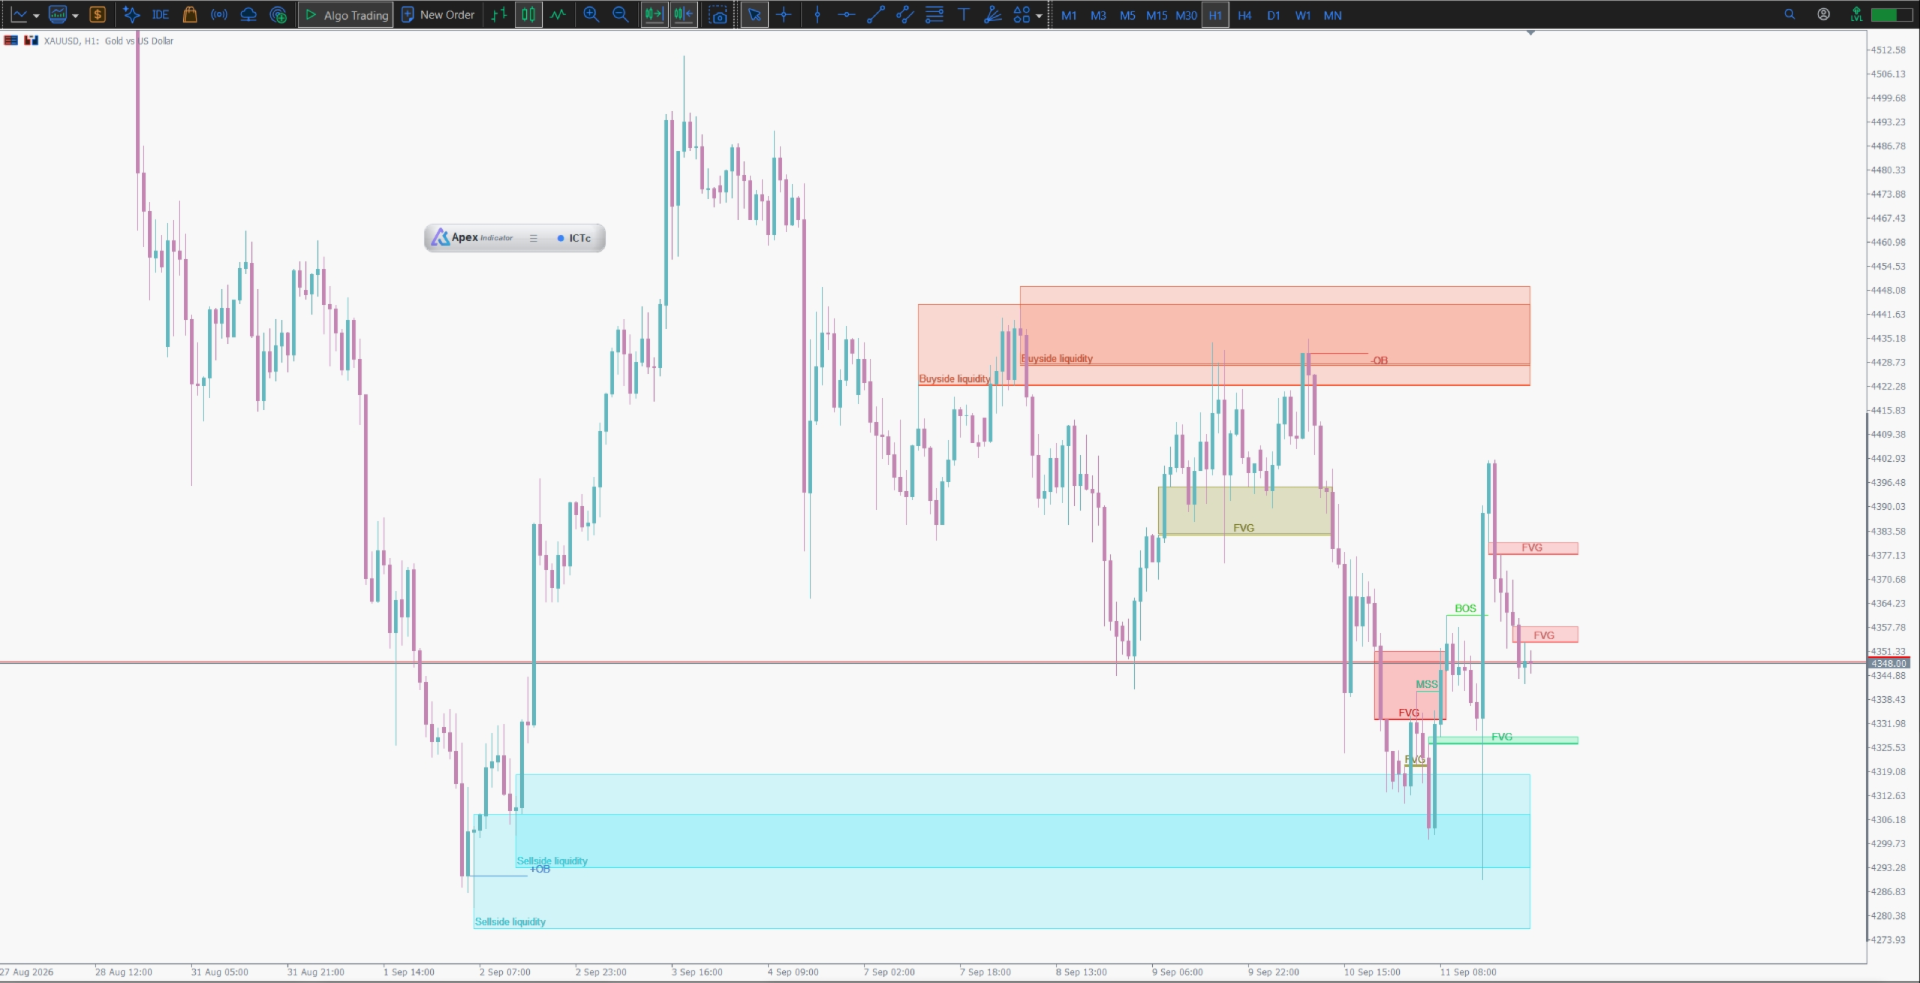
ApeX ICT Concepts is an ICT indicator for MetaTrader 5 that brings market structure, order blocks, liquidity, fair value gaps, volume imbalance, opening gaps, automatic Fibonacci and killzones together on one chart.
MSS and BOS are shown in separate colours, making it easier to see whether price is changing direction or continuing the current move. Order blocks can be based on the candle body or the full range, including the wick, with polarity flips available when you want to keep them on the chart.
You also get buyside and sellside liquidity, ATR-based liquidity zones, FVG and inversion FVG, balance price ranges, volume imbalance, new week and new day opening gaps, automatic Fibonacci and four killzones.
If ApeX Trading Console is running on the same terminal, the structure signals can also be passed to its Trade Engine.
_________________________________________________________
🚀 Launch Promotion — Lifetime License for $59
Special introductory price available for a limited time.
🔥 Part of the ApeX line.
ApeX ICT Concepts shares one toolbar with ApeX SMC, ICT Macros and Volume Profile. You can load any combination and still keep a single, clean toolbar on your chart.
Get the Lifetime License at the special launch price while it is available.
__________________________________________________
Demo Mode Notice
The built-in MQL5 Demo runs in the Strategy Tester. In that mode, the interactive toolbar and its picker cannot be clicked. This is expected behaviour, not a bug. The indicator drawings work normally. For the full interactive toolbar, run the indicator on a regular MT5 chart.
ℹ️ Good to know
ApeX ICT Concepts is an indicator. It draws and reports information on the chart — it does not place trades.
_________________________________________________________
Why this one?
- Your chart is still yours. The drawing objects are anchored to time and price and placed behind the candles at the lowest priority. If another chart object is underneath a zone, you can still select it.
- Draw normally with your mouse. While you are dragging to create a trendline, Fibonacci or another object, the indicator stays out of the way. Your second point remains where you put it.
- The drawings stay where they belong. You do not need to hide the indicator drawings every time you move around the chart.
- The settings are clear. For example, the liquidity Margin is a divisor, not a fixed distance. The indicator shows this clearly, and its default matches the value actually used by the calculation.
- The history is not rewritten. A box is judged at the time the signal happened, rather than being reinterpreted from what the chart looks like today.
- It can work with your trading workflow. When used with ApeX Trading Console, the same structure information can be used to build entries, stops and targets.
1. Structure and intent
- MSS and BOS — Shows the first break against the current move and the breaks that continue it. Bullish and bearish signals use separate colours so they are easy to distinguish at a glance.
- Displacement — Highlights candles that move far enough and fast enough to be treated as meaningful movement rather than normal market noise, using ATR as the reference.
- Automatic Fibonacci — Automatically drawn from the latest BOS, MSS or swing, then updated as new structure develops. No need to redraw it manually.
2. Where price may return
- Order blocks — Choose the candle body or the complete range including the wick. A swing lookback helps connect the block to the move that created it. You can keep one block per side, and polarity changes can also be kept and shown with hatching.
- Fair value gaps and inversion FVGs — Show regular FVGs, or focus on gaps that have been traded through and flipped. Balance price ranges are also available where opposing areas overlap.
- Volume imbalance — Shows the smaller body-to-body gaps that price often comes back to test.
- NWOG and NDOG — New Week Opening Gap and New Day Opening Gap, with separate colours for active and broken gaps.
3. Where liquidity may be
- Buyside and sellside liquidity — Finds areas around equal highs and lows where stops may be sitting. The zone width is based on ATR, so it adapts to the market instead of using the same fixed distance everywhere.
- Sweep detection — Checks whether liquidity was taken before the structure event. The lookback can extend far enough to capture earlier liquidity events when needed.
- Killzones — Includes New York, London Open, London Close and Asian sessions. Each can have its own colour and hours, with a broker-to-UTC offset so the sessions line up with your broker time.
4. Better together with ApeX Trading Console
- Structure can become a trade setup. A structure shift together with its order block can be used to create an entry, stop and staged targets, with position size based on the risk you set.
- The Console receives the full picture. Direction, order block, broken level, nearby FVG and liquidity sweep information can be passed together. The indicator reports the structure; the Console handles the trading decision.
- Choose how to enter. Use a draft zone for manual approval, create a pending order, or use a market entry.
- One toolbar for the ApeX line. ApeX SMC, ICT Concepts, ICT Macros and Volume Profile can share a single toolbar that docks with the Console panel and moves with it.
Getting started
- Drag ICT Concepts onto any chart.
- Set Killzone hours: broker time − UTC for your broker before using the session shading.
- Click the ● on the toolbar to show or hide the indicator drawings.
Good to know
- Works with MetaTrader 5, any broker, any symbol and any timeframe.
- It is an indicator: it draws and reports information, but never sends an order.
- Signals are published only for closed bars. A live candle can still change before it closes.
- The liquidity Margin is a divisor, not a point distance. The zone width is calculated as ATR ÷ Margin, so a smaller number creates a tighter zone.
- Killzone times depend on your broker's UTC offset, so set this before relying on the session shading.
- The Trade Engine, risk sizing and order execution are part of ApeX Trading Console and are sold separately. ICT Concepts by itself only draws and reports the signals.