VWAP Ribbons

VWAP RIBBON INTELLIGENCE

Institutional Rolling VWAP, Wilder ATR Volatility Ribbons & Live Breakout RSI Telemetry. 100% Free Forever.

Stop cluttering your charts with lagging moving averages that have no concept of volume or market volatility.

VWAP Ribbon Intelligence combines true Volume-Weighted Average Price (VWAP) math with dynamic Wilder ATR corridors and real-time Breakout RSI Telemetry.

Whether you trade Forex, Gold, Indices, or Crypto, this tool instantly maps institutional fair value, visualizes overextension zones, and prints exact RSI values at key breakout extremes.

No trial periods. No repainting closed bars. No DLLs. 100% Free for the MQL5 community.

CLAIM YOUR FREE COPY IN 1 CLICK

📲 GET INSTANT FREE ACCESS
Click the "Download" button on the right side of this page to add VWAP Ribbon Intelligence directly to your MetaTrader 5 terminal right now. Use it on unlimited live and demo accounts with zero restrictions.

THE PROBLEM WITH TRADITIONAL MOVING AVERAGES

Standard moving averages (SMA, EMA) treat every candle the same. A quiet 10-pip bar during the Asian session gets the exact same weight as a violent 100-pip institutional sweep during the London open.

This creates a massive blind spot: traditional lines lag behind real market value.

Furthermore, fixed channel indicators (like standard Keltner Channels) fail to adapt when market volatility shifts, leading to false breakout signals during volatility squeezes.

What if your baseline automatically weighted price by real tick volume, wrapped itself in dynamic Wilder volatility corridors, and tagged exact RSI readings at every major breakout peak?

THE SOLUTION: INSTITUTIONAL FAIR VALUE + VOLATILITY CORRIDORS

VWAP Ribbon Intelligence delivers three essential layers of market analysis in one ultra-clean indicator:

  1. Volume-Weighted Baseline (VWAP): Calculates true institutional fair value using continuous rolling hours or broker server daily resets.
  2. Wilder ATR Corridors: Wraps the VWAP in inner ( k k) and outer ( k + s t e p k+step) deviation bands using Wilder’s true ATR math to define statistical stretch boundaries.
  3. Dual-Stage RSI Telemetry: Measures momentum overextension and prints precise RSI text tags directly on your chart at historical breakout extremes and live forming candles.

INSTANT CHART CLARITY: THE MIDNIGHT GOLD DASHBOARD

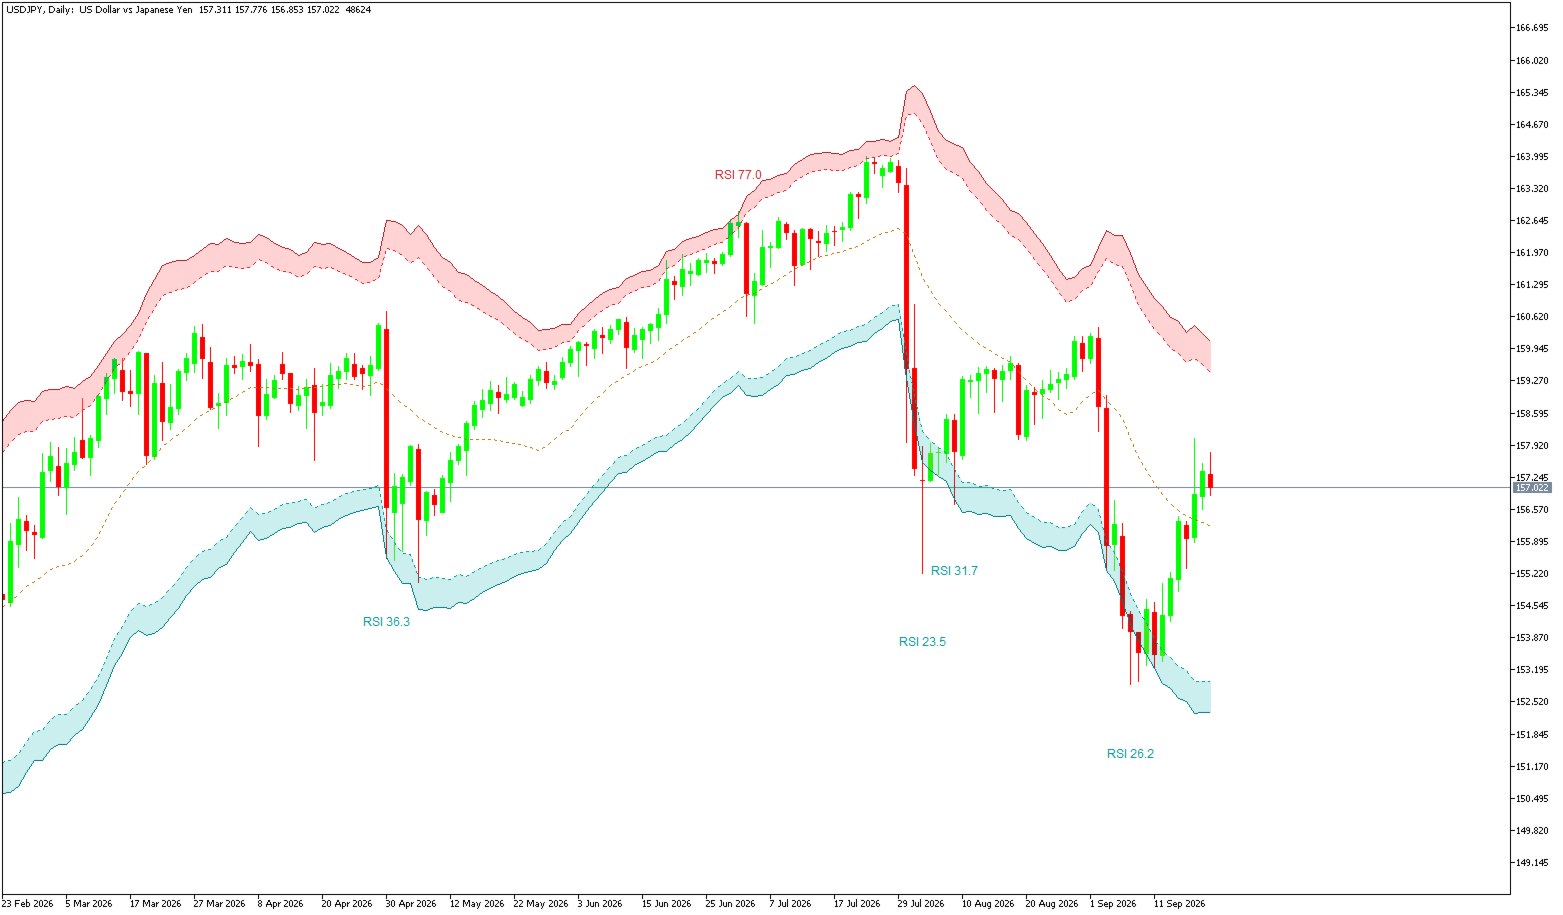
Visual clutter vanishes the moment you attach VWAP Ribbon Intelligence to your chart. Running on our built-in Midnight Gold institutional color profile, your workspace instantly transforms:

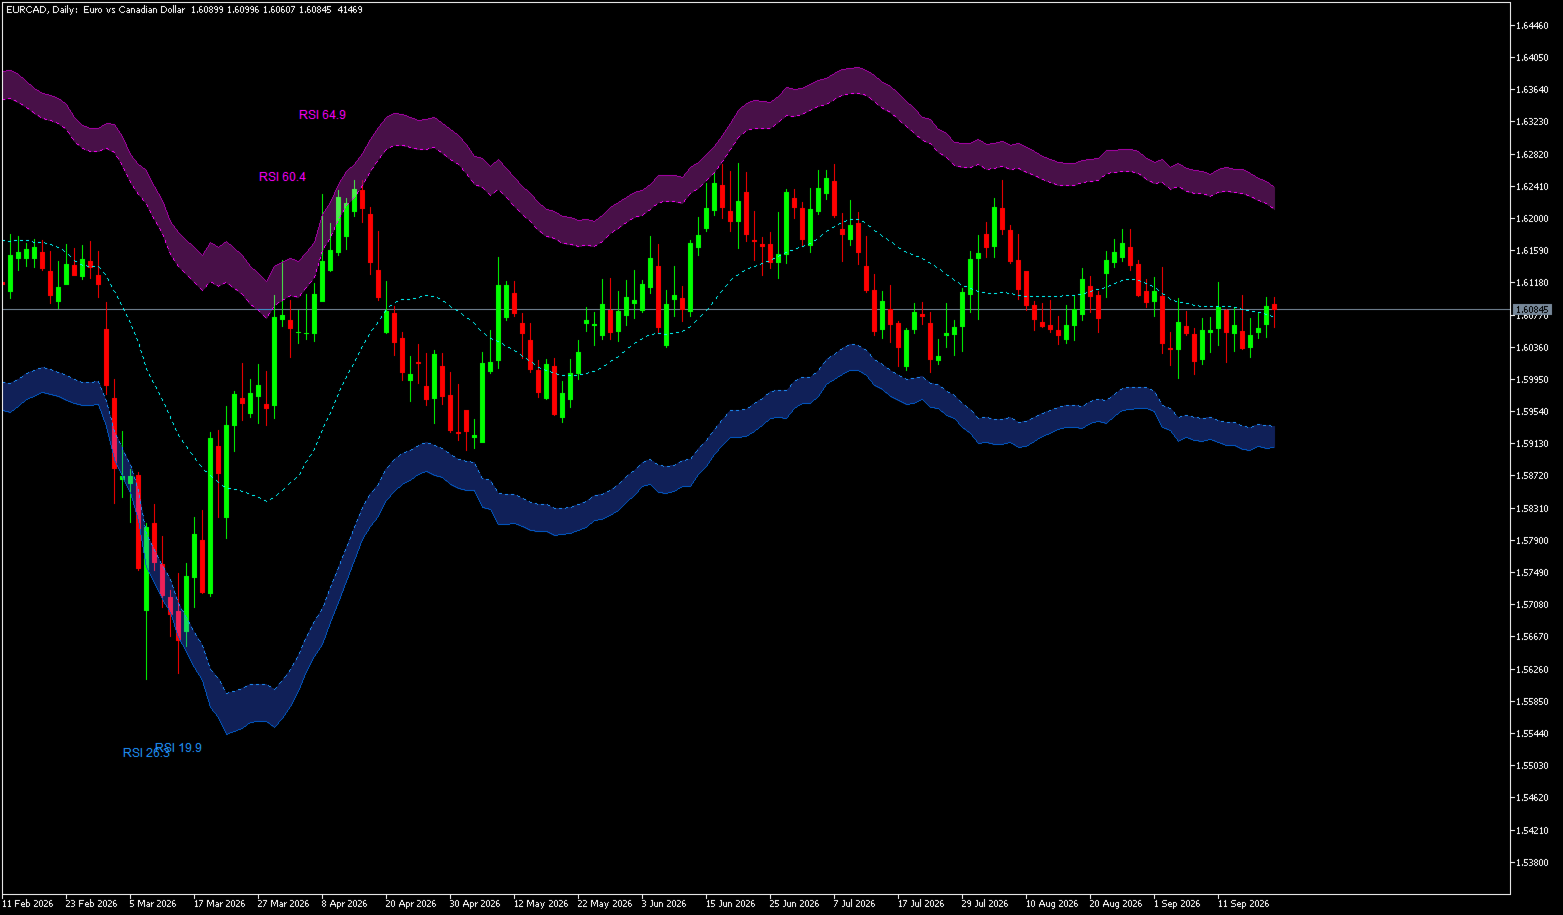
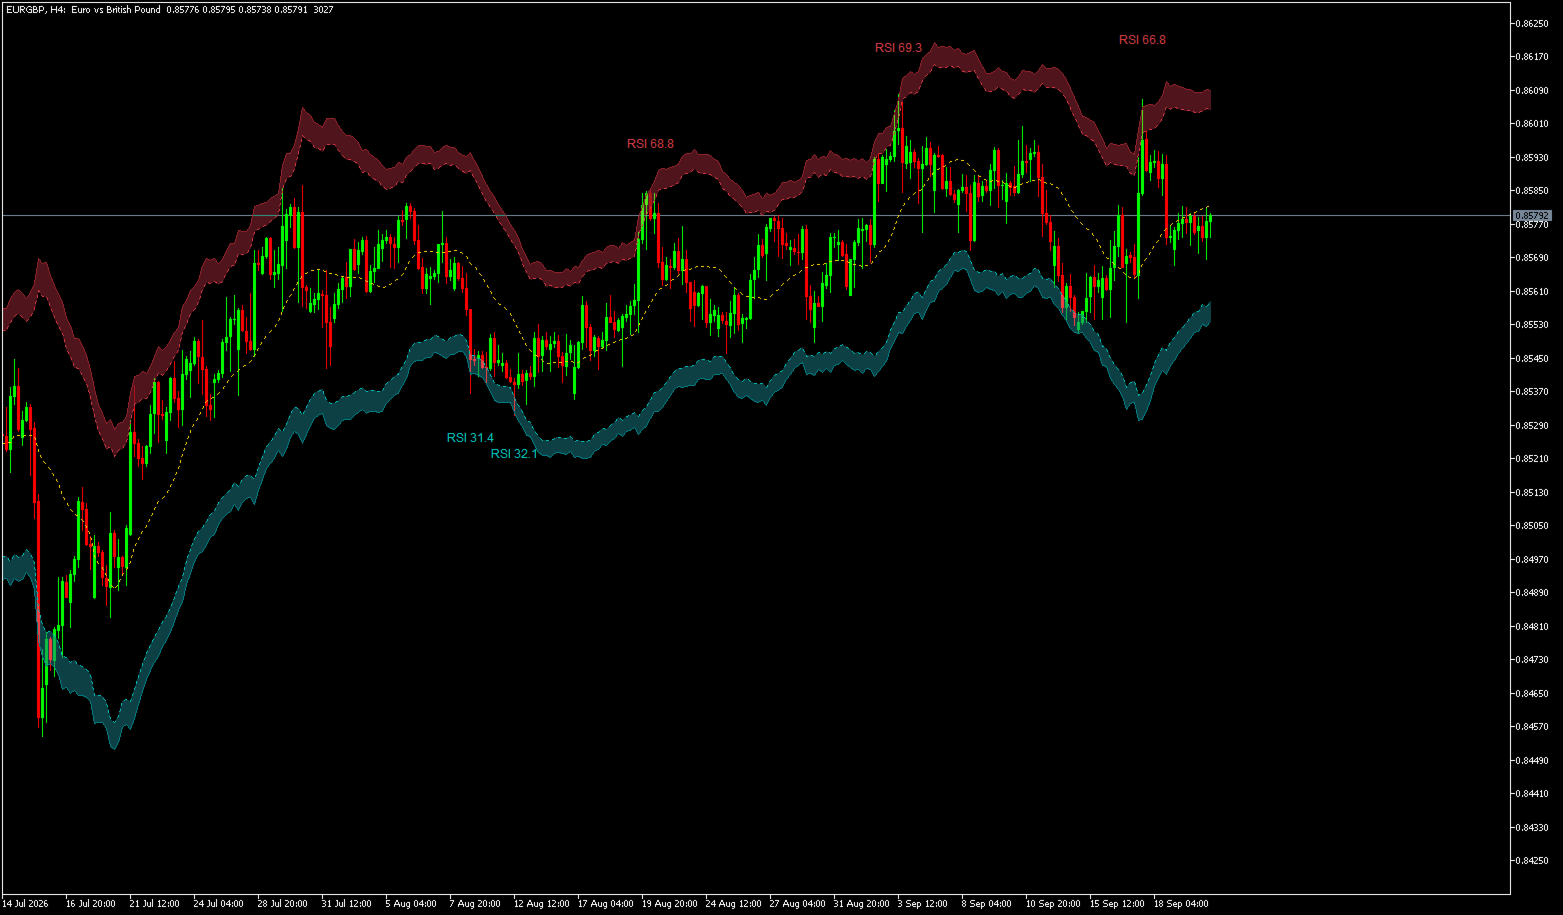
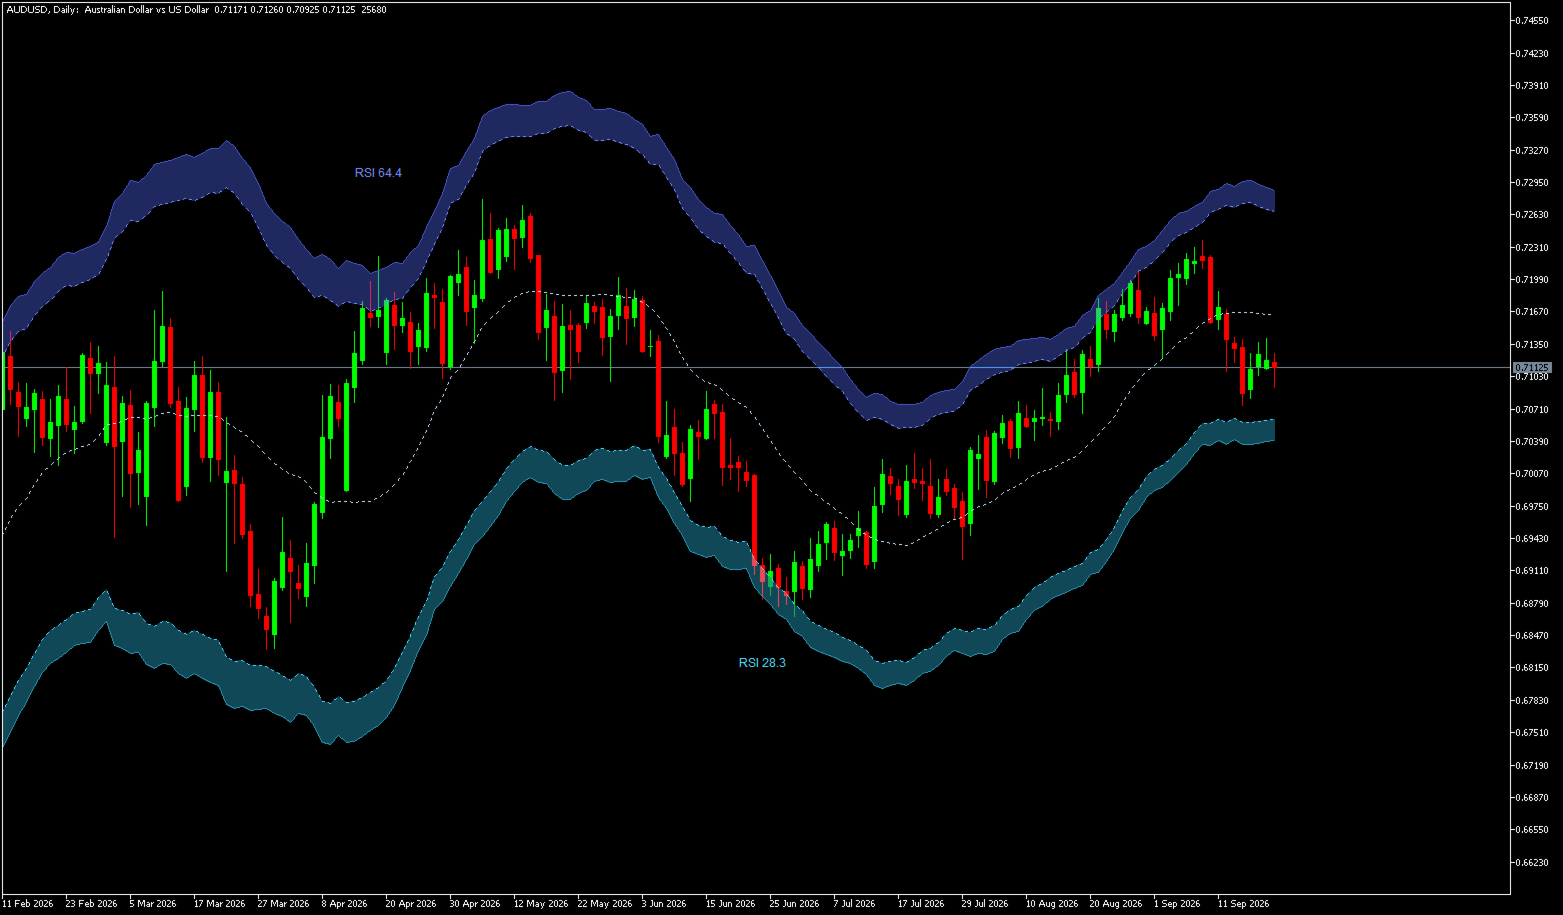
The Golden VWAP Baseline: A clean, central benchmark line tracking institutional fair value.
Dynamic Ribbon Fill: Soft, opacity-blended shading framing price action—crimson shading for extreme upper stretch, teal shading for lower oversold depletion.
Completed Breakout RSI Tags: Locked text labels printed at the exact extreme bar of historical ribbon breakouts (e.g., "RSI 78").
Live On-Tick RSI Telemetry: A real-time label tracking current forming-bar RSI momentum live as the active candle updates.

You assess market value, volatility corridors, and momentum stretch in under 3 seconds.

UNDER THE HOOD: 4 CORE ENGINES WORKING FOR YOU

1. Institutional VWAP Engine

  • Rolling Window Mode: Calculates continuous rolling VWAP (e.g., 24-hour lookback) using an ultra-fast O(1) algorithmic loop. Zero terminal lag.
  • Daily Session Mode: Resets volume accumulation precisely at the broker/server calendar-day boundary for daily benchmark alignment.

2. Wilder ATR Volatility Ribbons

  • Wilder Smoothing Math: Uses true Wilder ATR calculations for smooth, reliable volatility expansion corridors.
  • Native Chart Background Blending: Approximates smooth ribbon opacity by mathematically blending fill colors directly against your chart background without heavy GPU shaders.

3. Extreme-Bar RSI Telemetry Logic

  • Exact Peak RSI Memory: Unlike standard tools that tag the confirmation bar, our engine calculates and displays the RSI of the exact peak/valley candle where the price excursion occurred.
  • Historical Audit Trail: Stores the last N completed breakout labels on your chart so you can audit past overextension setups at a glance.

4. Live Forming-Bar On-Tick Tracking

  • Real-Time Momentum Readout: Live labels update on every single market tick, tracking current-bar RSI momentum while positioning the label dynamically at the active price extreme.

INSTITUTIONAL RIGOR & ZERO REPAINT GUARANTEE

100% Non-Repainting Closed Labels: Historical breakout labels and VWAP lines are locked permanently on bar close.
Works on ALL Assets: Fully optimized for Forex, Gold (XAUUSD), Indices (US30, NAS100, GER40), Commodities, and Crypto.
Multi-Timeframe Ready: Functions seamlessly on M1, M5, M15, H1, H4, and Daily timeframes.
Zero External Dependencies: 100% native MQL5 code—no external DLLs, no web requests, and zero terminal slowdowns.

YOUR SIMPLE 3-STEP DAILY WORKFLOW

  1. Attach the Indicator: Place VWAP Ribbon Intelligence on your chart (Default settings are optimized out-of-the-box).
  2. Monitor the Corridors: Watch price action relative to the golden central VWAP line and surrounding shaded ATR ribbons.
  3. Audit Momentum: Use the live on-tick RSI label and historical extreme RSI tags to confirm when price stretch has reached true exhaustion.

PARAMETER ARCHITECTURE OVERVIEW

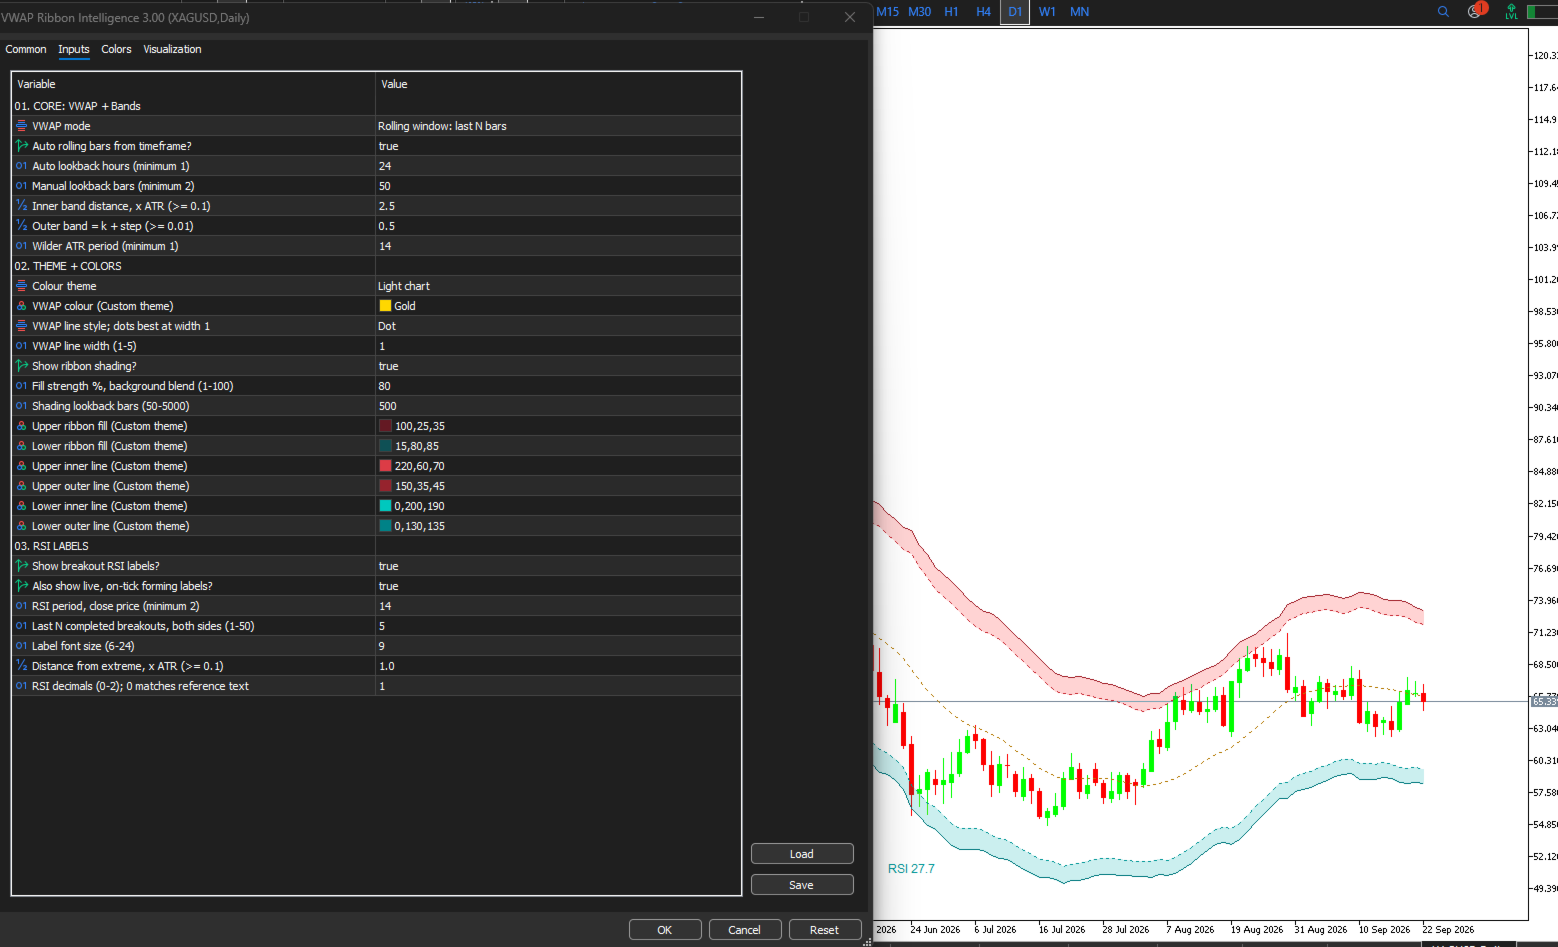
  • 01. CORE: VWAP + Bands: Choose VWAP calculation mode (Rolling Window or Daily Reset), lookback hours, Wilder ATR period, and inner/outer band distances ( k k).
  • 02. THEME + COLORS: Toggle between Midnight Gold, Neon, Ocean, Light Chart, or Custom settings. Adjust ribbon shading opacity and lookback depth.
  • 03. RSI LABELS: Enable/disable historical breakout RSI labels, live on-tick forming labels, font sizes, decimal precision, and ATR label offset distance.

READY TO TAKE YOUR TRADING FURTHER?

For traders looking for a complete institutional workspace:

VWAP Ribbon Intelligence provides foundational baseline and volatility structure. When you are ready to add automated execution setups, volume profile analytics, and signal alerts, explore our flagship tools:

🔥 VWAP SNIPER VOLUME PROFILE PRO
Adds a dynamic, ribbon-anchored tick-volume profile with Point of Control (POC), Value Area (VAH/VAL), High Volume Nodes (HVN), and draggable anchor controls.

🔥 VWAP SNIPER REVERSAL PRO
Adds multi-factor volume spike filters, wick/engulfing exhaustion detectors, 2-stage armed-to-confirmed signal arrows, and mobile push notifications.

🔥 CONSOLIDATION INTELLIGENCE PRO
Maps 5-tier range heatmaps and institutional order density across market consolidation phases.

ADD IT TO YOUR CHARTS FREE TODAY

Start analyzing market value with institutional precision.

📲 Click "Download" on the right side of this page to add VWAP Ribbon Intelligence to your MetaTrader 5 terminal right now—100% free, forever!

VWAP Ribbon Intelligence | Free VWAP Indicator | Wilder ATR Ribbons | MQL5 Free Tools | Breakout RSI Indicator | Non Repaint MT5 Indicator | Institutional Trading
Altri dall’autore
SWING VOLUME PROFILE Swing-Based Volume Profile + Fibonacci + RSI -------------------------------------------------- Auto-detected swings. Volume profile. Fibonacci. RSI. All-in-one. -------------------------------------------------- WHAT THIS INDICATOR DOES Swing Volume Profile (SVP) automatically detects structural swings and displays a volume profile for the most recent completed swing — with Fibonacci retracement and RSI overlay. No manual range selection needed. The indicator finds
SWING DETECTOR WITH RSI AND FIBONACCI Structural Swing Points + Fibonacci Retracement + RSI Overlay -------------------------------------------------- FREE INDICATOR Identify swings. See Fibonacci levels. Check RSI. All in one free indicator. -------------------------------------------------- WHAT THIS INDICATOR DOES This indicator automatically detects structural swing highs and lows using configurable depth and deviation filtering. It connects swings with trend lines, overlays standard
FREE
SWING HIGHS LOWS DETECTOR Swing Detection with Divergence Analysis -------------------------------------------------- Identify swings. Spot divergences. Trade with confluence. -------------------------------------------------- WHAT THIS INDICATOR DOES This indicator automatically detects structural swing highs and lows using configurable depth and deviation filtering. It then analyzes RSI and MACD to detect regular and hidden divergences between consecutive swings of the same type. Diver
FREE
SWING DETECTOR WITH RSI AND FIBONACCI Structural Swing Points + Fibonacci Retracement + RSI Overlay -------------------------------------------------- FREE INDICATOR Identify swings. See Fibonacci levels. Check RSI. All in one free indicator. -------------------------------------------------- WHAT THIS INDICATOR DOES This indicator automatically detects structural swing highs and lows using configurable depth and deviation filtering. It connects swings with trend lines, overlays standard
FREE
SWING HIGHS LOWS DETECTOR Swing Detection with Divergence Analysis -------------------------------------------------- Identify swings. Spot divergences. Trade with confluence. -------------------------------------------------- WHAT THIS INDICATOR DOES This indicator automatically detects structural swing highs and lows using configurable depth and deviation filtering. It then analyzes RSI and MACD to detect regular and hidden divergences between consecutive swings of the same type. Diver
FREE
FIXED RANGE VOLUME PROFILE Auto-Detecting Volume Profile Indicator with Real-Time Trendline Tracking -------------------------------------------------- FREE INDICATOR Volume distribution. Value areas. High-volume nodes. All from your trendline. -------------------------------------------------- WHAT THIS INDICATOR DOES Fixed Range Volume Profile (FRVP) displays volume distribution over a user-defined range — automatically detecting the latest trendline you draw or drag on the chart. No
FIXED RANGE VOLUME PROFILE Auto-Detecting Volume Profile Indicator with Real-Time Trendline Tracking -------------------------------------------------- Volume distribution. Value areas. High-volume nodes. All from your trendline. -------------------------------------------------- WHAT THIS INDICATOR DOES Fixed Range Volume Profile (FRVP) displays volume distribution over a user-defined range — automatically detecting the latest trendline you draw or drag on the chart. No manual range sel
ADAPTIVE SWING DENSITY HEAT MAP Structural Density + Participation Analysis -------------------------------------------------- See where price clusters. See where price fights. -------------------------------------------------- WHAT THIS INDICATOR DOES This indicator analyzes swing point density across price levels, then tracks how price actually interacts with each zone — measuring participation, acceptance, and rejection. The result is a heat map of structural zones, color-coded by den
CONSOLIDATION INTELLIGENCE PRO (MT4) Catch The Next Big Move! Stop Getting Chopped Up in Ranges. Map Institutional Order Density With 5-Tier Heatmaps. Up to 70% of retail losses happen inside messy consolidation ranges. Consolidation Intelligence Pro scans your MT4 charts for overlapping candle accumulation, measures body-to-wick density, and maps real-time 5-Tier Heatmaps directly over high-value consolidation zones. You instantly see where liquidity is stacked, where institutional orders are c
DONCHIAN MARKET & TREND INTELLIGENCE ENGINE (MT4) Multi-Factor Volatility, Trend Structure & Institutional Breakout Validation Dashboard MOST BREAKOUT INDICATORS ARE TRAPPING YOU. They Tell You THAT Price Broke Out. They Never Tell You IF It Will Hold. You have lived this scenario dozens of times: Price spends days coiling inside a tight Donchian band on your MT4 chart. A massive candle punches above the 20-period high. You buy the breakout — expecting momentum. Three candles later, price colla
BOLLINGER MARKET & TREND INTELLIGENCE — MT4 Edition STOP GUESSING WHICH BREAKOUTS ARE REAL. Most Bollinger breakouts fail. This engine tells you which ones won't — before you risk a single dollar. You get a quality score, a volatility percentile, and a post-breakout efficiency reading. All locked on bar close. No repainting. No guessing. The market gives you maybe three clean breakouts a week. This tool makes sure you catch them — and helps you avoid the twelve that would have stopped you out. T
VWAP RIBBON INTELLIGENCE (MT4 EDITION) Institutional Rolling VWAP, Wilder ATR Volatility Ribbons & Live Breakout RSI Telemetry. 100% Free Forever. Stop cluttering your MT4 charts with lagging moving averages that have no concept of volume or market volatility. VWAP Ribbon Intelligence MT4 combines true Volume-Weighted Average Price (VWAP) math with dynamic Wilder ATR corridors and real-time Breakout RSI Telemetry , engineered from the ground up to be ultra-lightweight and highly compatible with
FREE
ADAPTIVE SWING DENSITY HEAT MAP Structural Density + Participation Analysis See where price clusters. See where price fights. -------------------------------------------------- WHAT THIS INDICATOR DOES This indicator analyzes swing point density across price levels, then tracks how price actually interacts with each zone — measuring participation, acceptance, and rejection. The result is a heat map of structural zones, color-coded by density strength: - Red zones = Highest density (80-10
SWING VOLUME PROFILE Swing-Based Volume Profile + Fibonacci + RSI -------------------------------------------------- Auto-detected swings. Volume profile. Fibonacci. RSI. All-in-one. -------------------------------------------------- WHAT THIS INDICATOR DOES Swing Volume Profile (SVP) automatically detects structural swings and displays a volume profile for the most recent completed swing — with Fibonacci retracement and RSI overlay. No manual range selection needed. The indicator finds
CONSOLIDATION INTELLIGENCE PRO Catch The Next Big Move!Stop Getting Chopped Up in Ranges. Map Institutional Order Density With 5-Tier Heatmaps. Up to 70% of retail losses happen inside messy consolidation ranges. Consolidation Intelligence Pro scans your charts for overlapping candle accumulation, measures body-to-wick density, and maps real-time 5-Tier Heatmaps directly over high-value consolidation zones. You instantly see where liquidity is stacked, where institutional orders are concentrate
DONCHIAN MARKET & TREND INTELLIGENCE The Only Donchian Tool That Tells You WHY the Market Is Moving — Not Just Where Most Donchian indicators draw three lines and call it a day. You get an upper band. A middle band. A lower band. And when price pokes above the upper band, you're supposed to just... buy? That's not analysis. That's guessing with extra steps. THE PROBLEM EVERY DONCHIAN TRADER KNOWS You've seen it a hundred times. Price finally breaks above the 20-period high after days of compress
BOLLINGER MARKET & TREND INTELLIGENCE — MT5 Edition STOP GUESSING WHICH BREAKOUTS ARE REAL. Most Bollinger breakouts fail. This engine tells you which ones won't — before you risk a single dollar. You get a quality score, a volatility percentile, and a post-breakout efficiency reading. All locked on bar close. No repainting. No guessing. The market gives you maybe three clean breakouts a week. This tool makes sure you catch them — and helps you avoid the twelve that would have stopped you out. T
VWAP SNIPER REVERSAL PRO Stop Catching Falling Knives. Trade Institutional Reversals With Multi-Factor Exhaustion & RSI Telemetry. Most mean-reversion tools force you to guess where a market will turn. You buy an "oversold" indicator, only for price to crash through your stop-loss while staying oversold for hours. VWAP Sniper Reversal Pro v2.30 changes the game. It combines continuous rolling institutional VWAP baselines, dual-layer ATR volatility ribbons, volume/wick exhaustion filters, and a
Filtro:
Nessuna recensione
Rispondi alla recensione