Time Above Equilibrium Pattern
- Indicatori
-
Sofien Kaabar
 Quant Atlas 📈 builds quantitative market intelligence tools for traders and market researchers.
🔹Our work focuses on algorithmic support and resistance levels, market structure analytics, conviction frameworks, path probability, and decision support indicators for MetaTrader 5. - Versione: 1.0
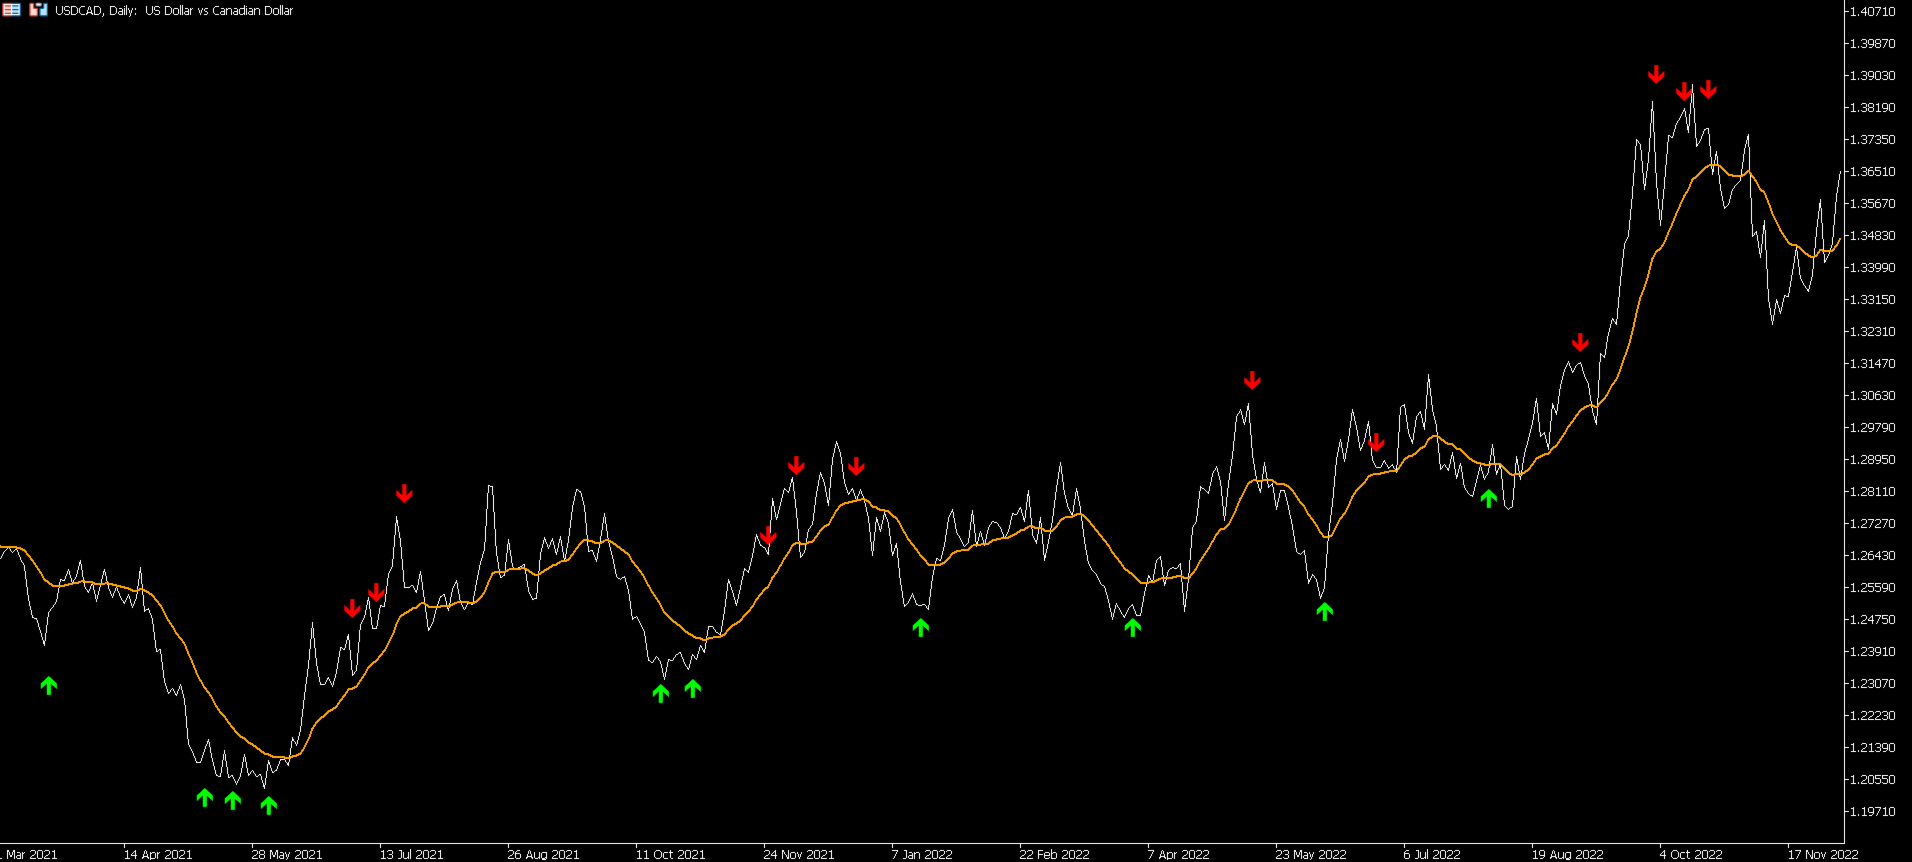
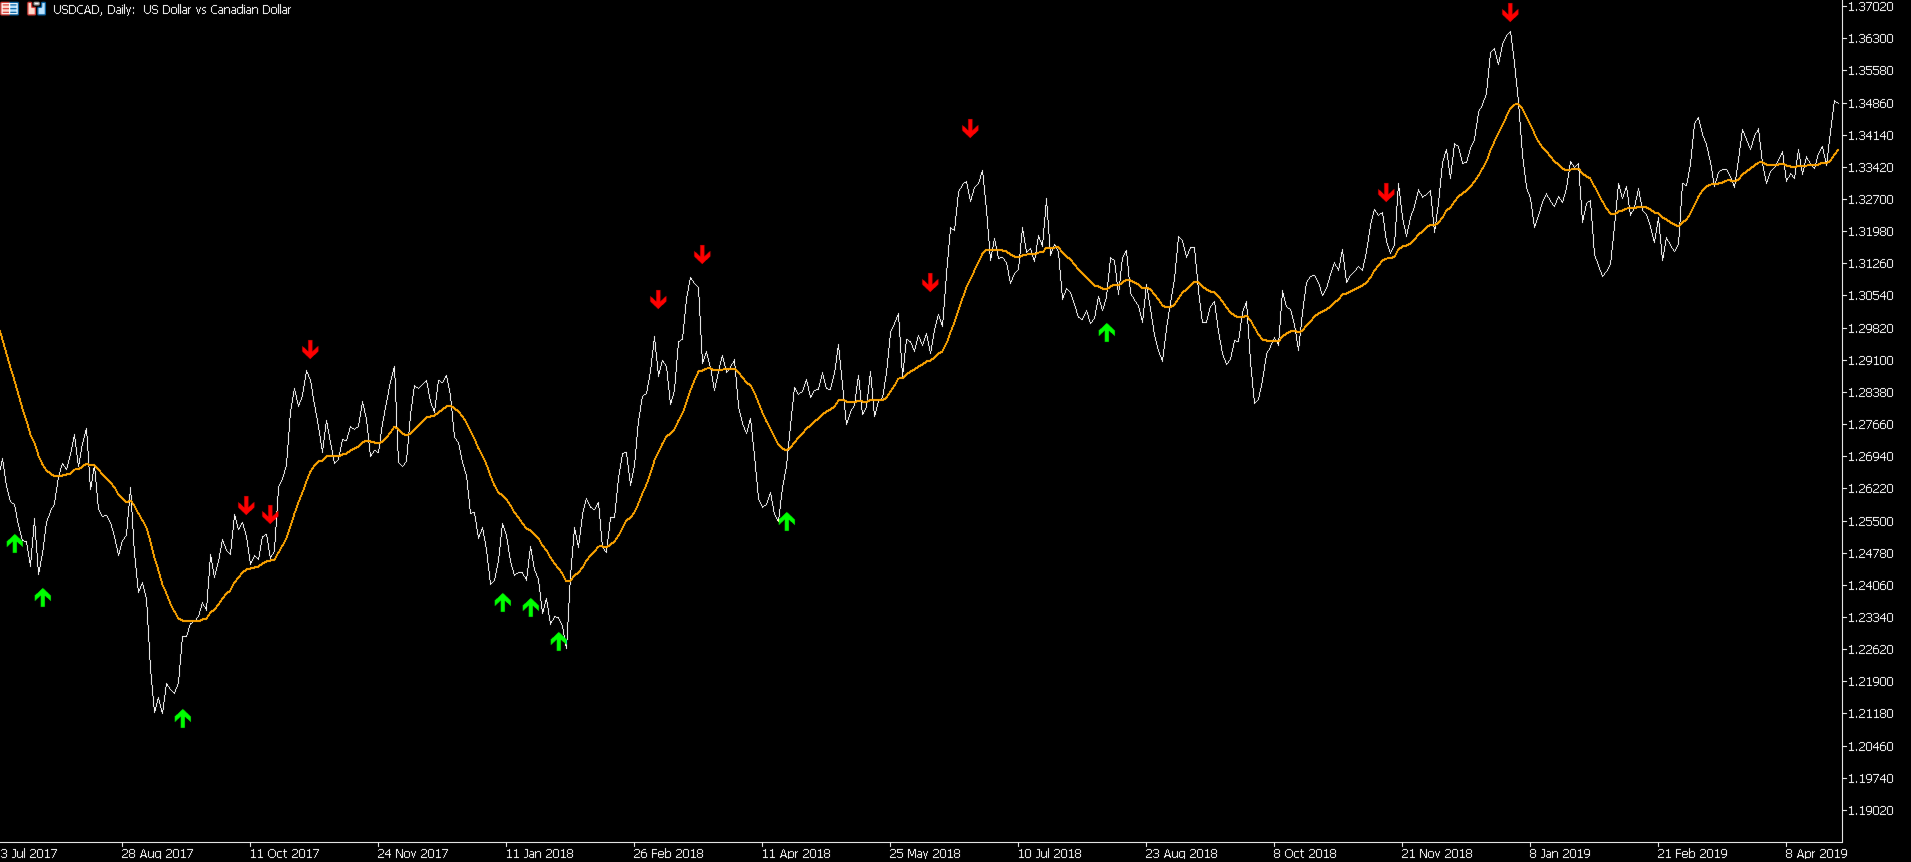
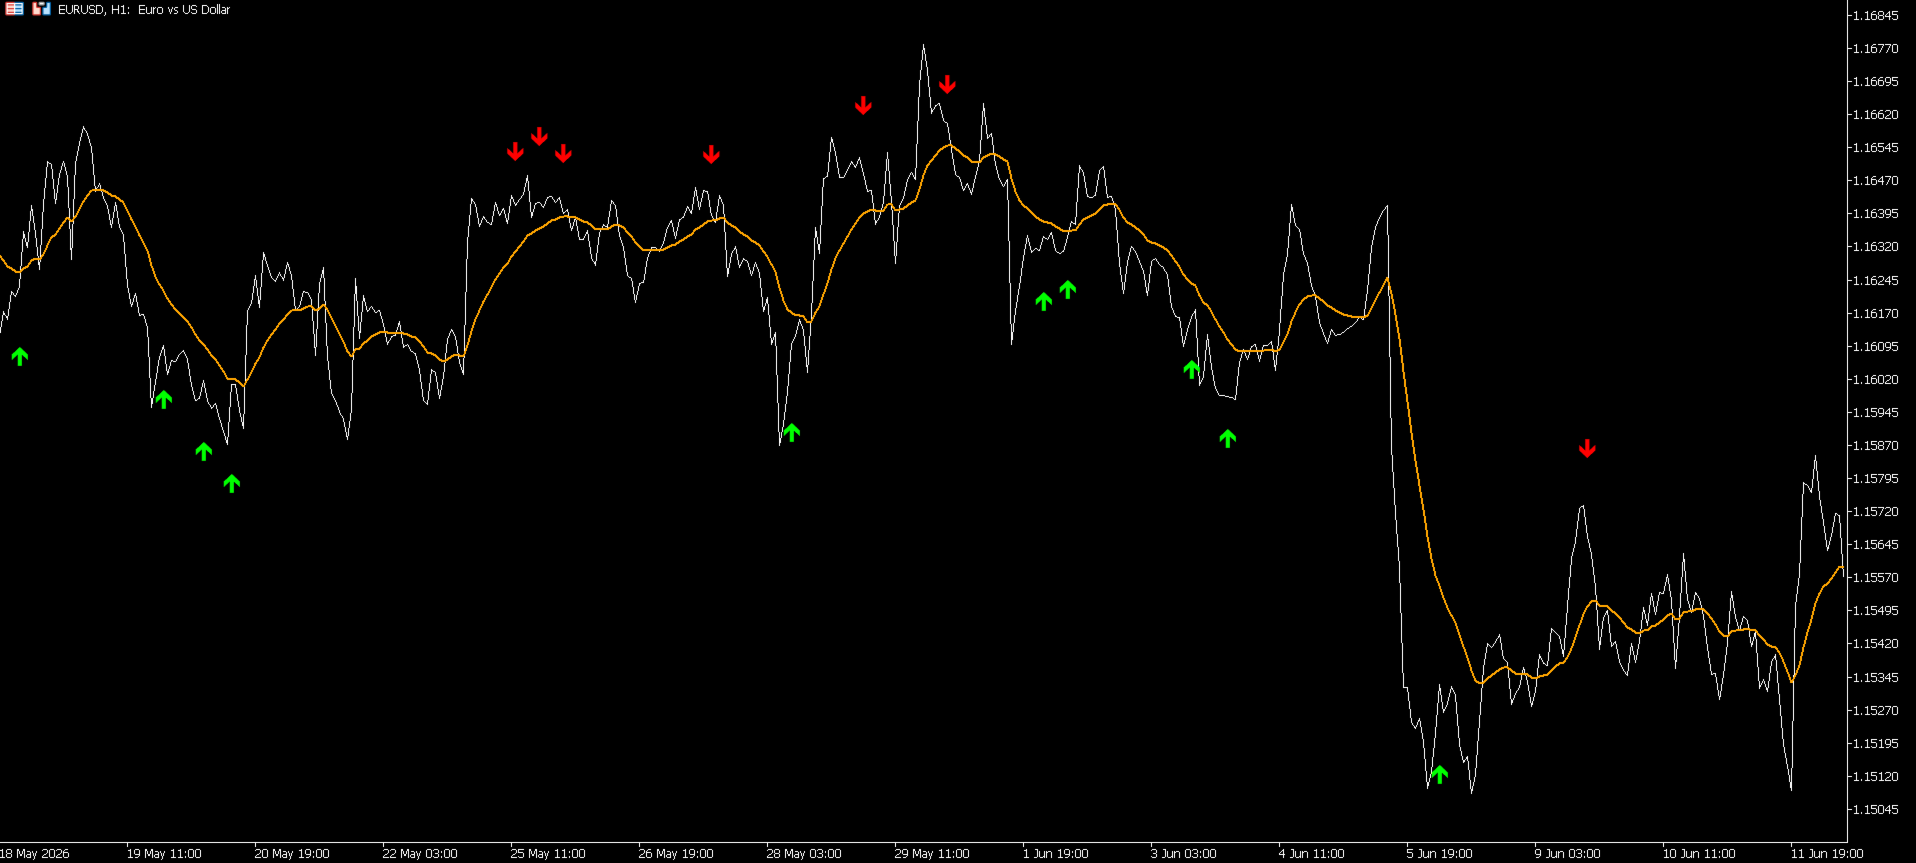
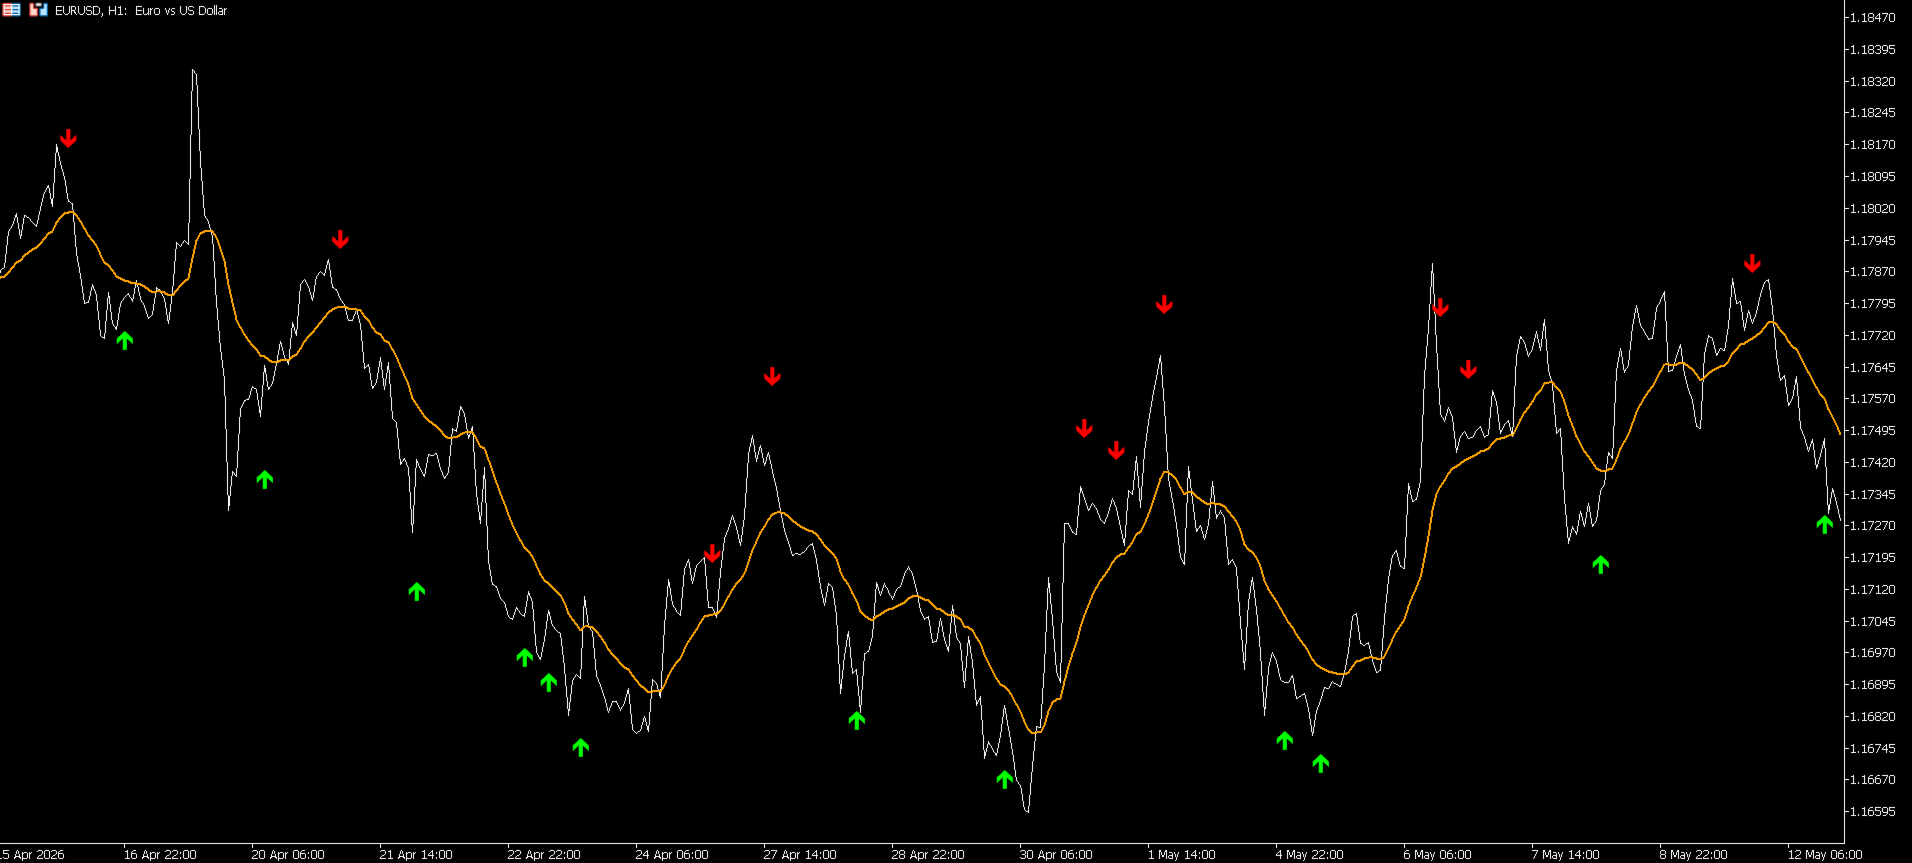
The Time Above Equilibrium Pattern identifies potential exhaustion points by measuring how long price remains above or below a dynamic equilibrium level.
Creator: https://www.quant-atlas.com/
The equilibrium line acts as a smoothed reference point for market balance. When price spends an extended period above this line, the indicator tracks the duration of that move and monitors whether upward support is beginning to weaken. A bearish exhaustion signal may appear when price has remained above equilibrium for a sufficient number of bars, the equilibrium slope is still positive but losing strength, and the distance between price and equilibrium begins to contract.
The same logic applies in reverse for bullish exhaustion. When price spends an extended period below equilibrium, the indicator tracks downside persistence and looks for signs that bearish pressure is fading. A bullish exhaustion signal may appear when price has remained below equilibrium for a sufficient number of bars, the equilibrium slope is still negative but weakening, and price begins moving closer to the equilibrium line.
The pattern is designed to capture moments where a directional move may be stretched, mature, or losing momentum. It does not attempt to predict every reversal. Instead, it highlights situations where time, slope behavior, and distance compression align around a dynamic market equilibrium.
To reduce signal clustering, the indicator includes a cooldown mechanism. After a signal appears, no new signal can appear for a defined number of bars. This helps avoid repeated alerts during noisy or sideways conditions.
The pattern can be used as a reversal-warning tool, a timing filter, or a confirmation layer alongside broader trend, momentum, support/resistance, or volatility analysis.