Synapse Indicator
- Indicatori
-
Sofien Kaabar
 Quant Atlas 📈 builds quantitative market intelligence tools for traders and market researchers.
🔹Our work focuses on algorithmic support and resistance levels, market structure analytics, conviction frameworks, path probability, and decision support indicators for MetaTrader 5. - Versione: 1.2
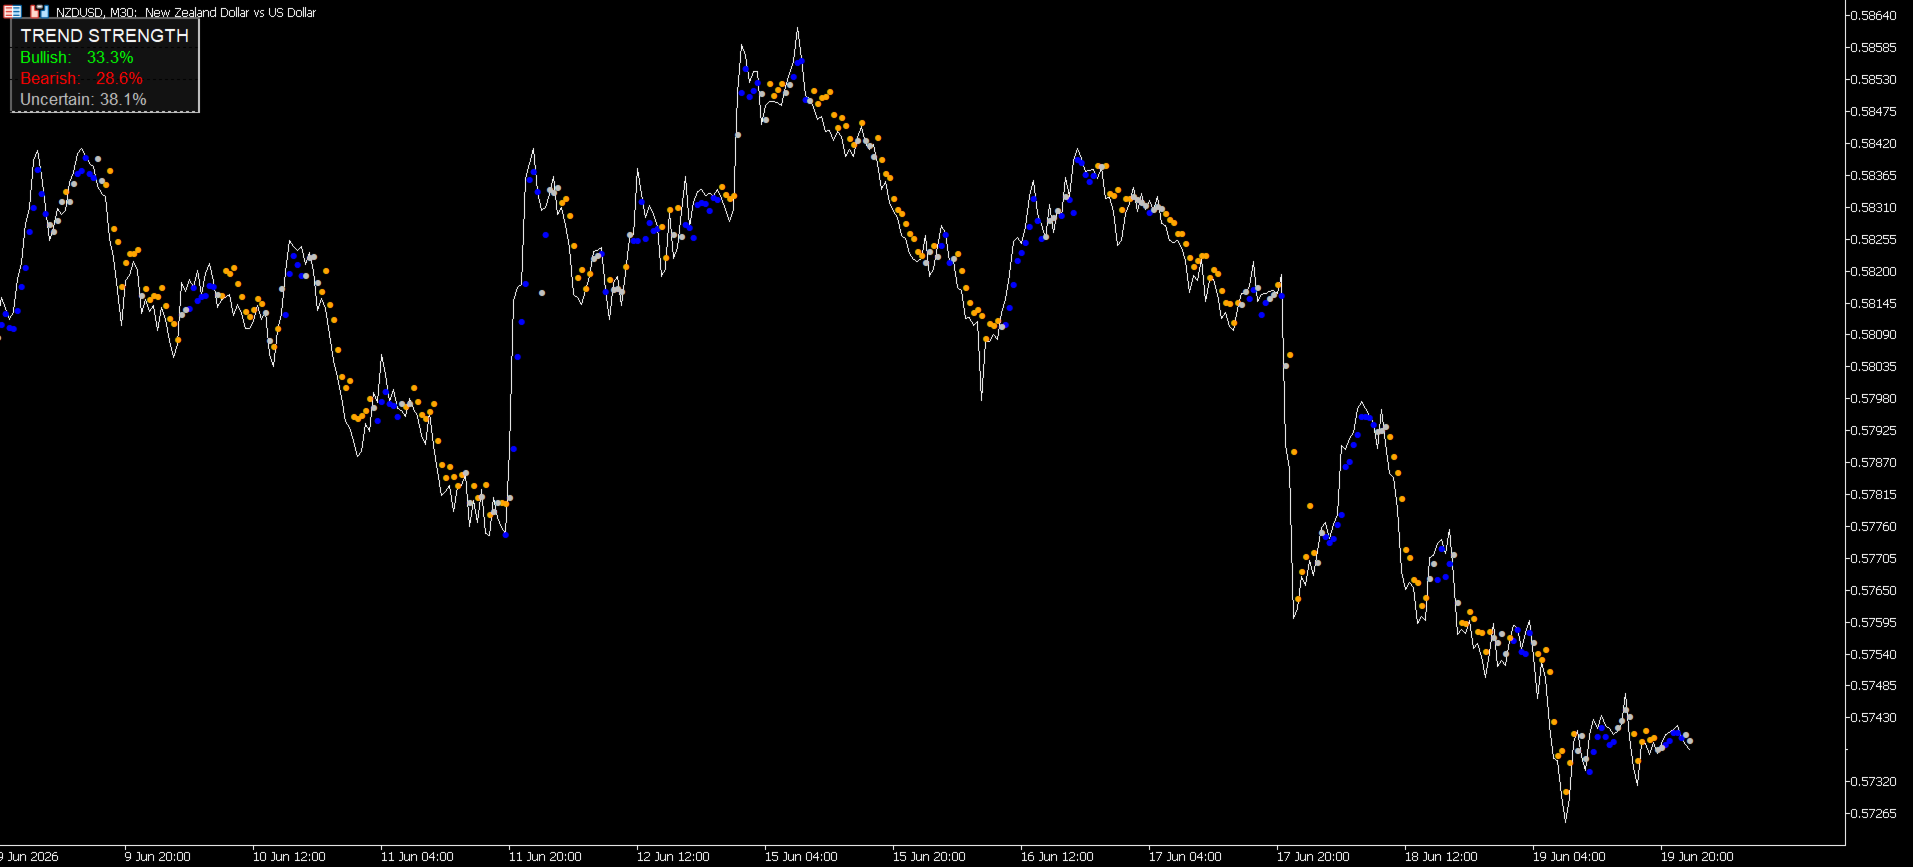
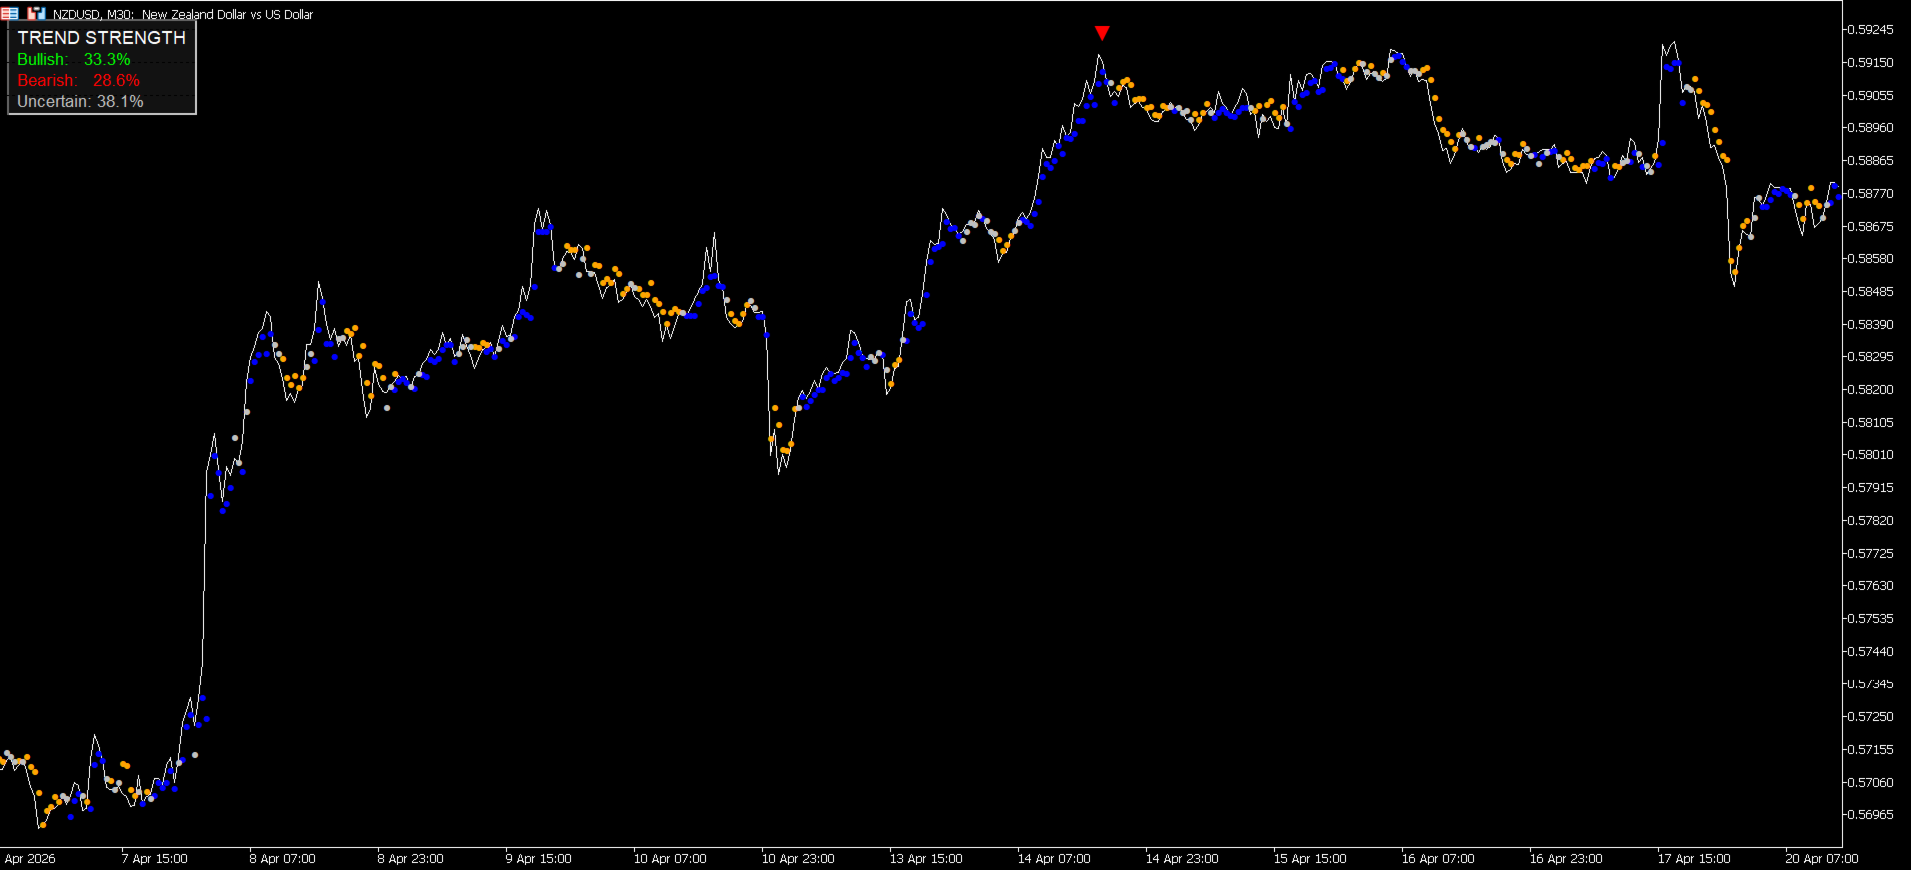
K's Synapse is a market structure indicator designed to provide a clear visual reading of bullish pressure, bearish pressure, and uncertainty directly on the price chart.
Creator: https://www.quant-atlas.com/
The indicator evaluates recent price structure across multiple reference points and converts the results into colored dots, rolling market surety percentages, and high intensity triangle signals.
Dot Structure
• Blue dots represent bullish price structure
• Red dots represent bearish price structure
• Grey dots represent uncertain or neutral conditions
The dots provide a bar by bar view of how the current market structure is developing.
Market Surety Summary
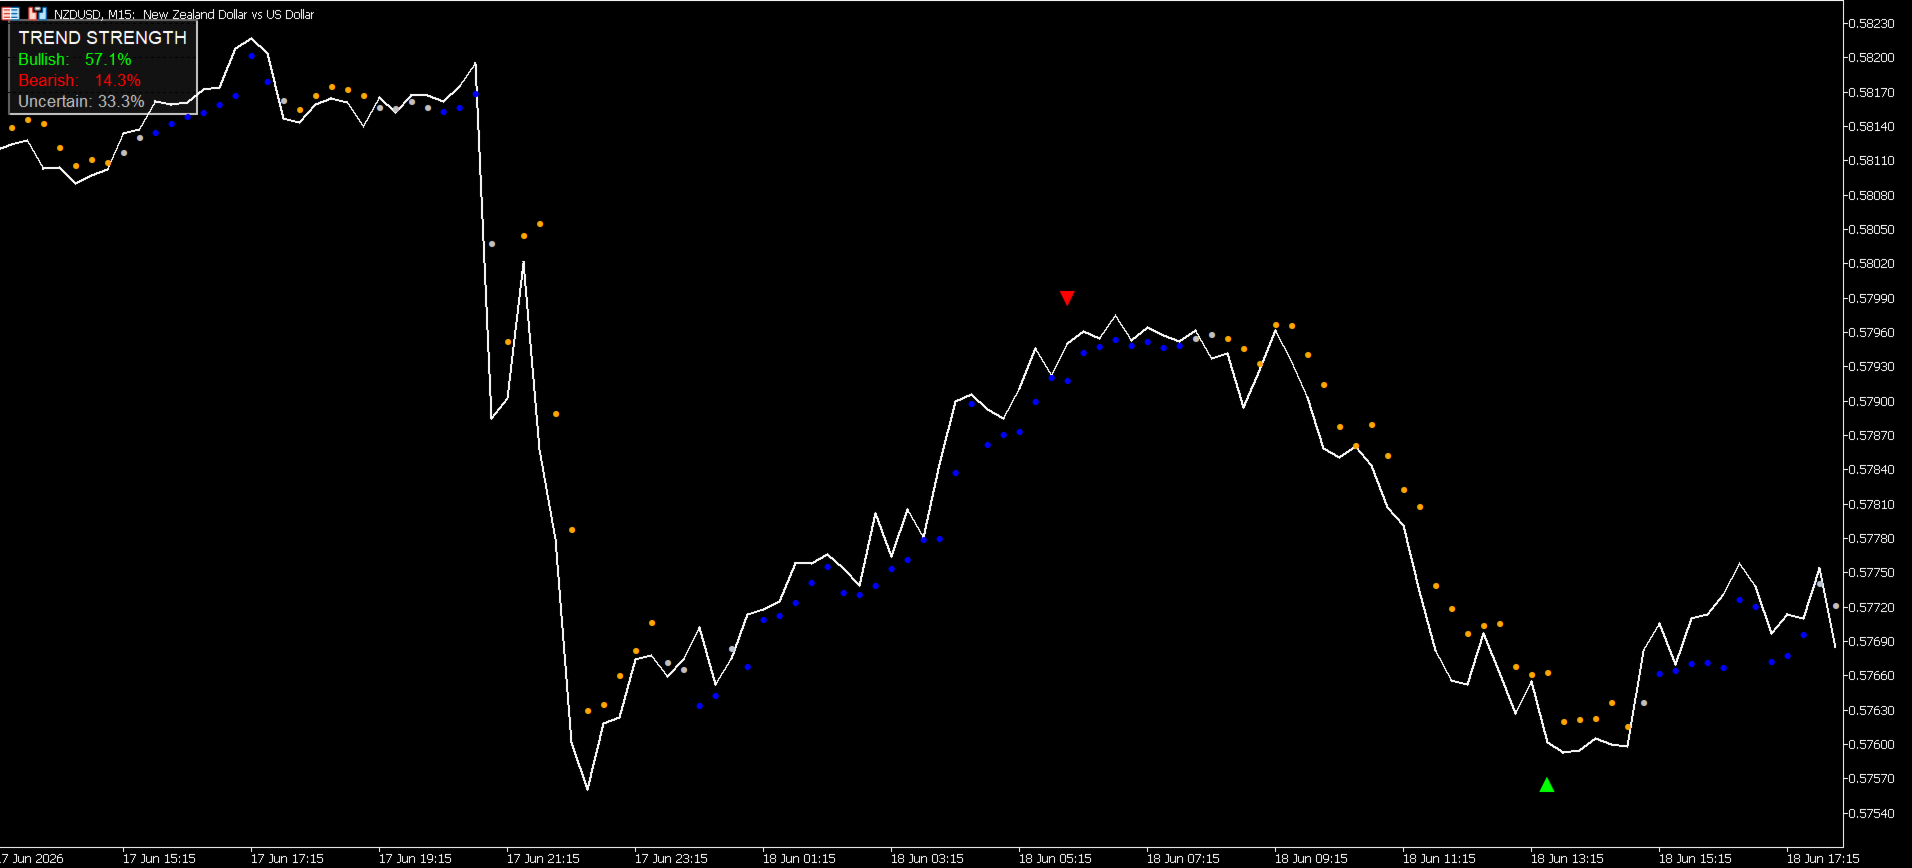
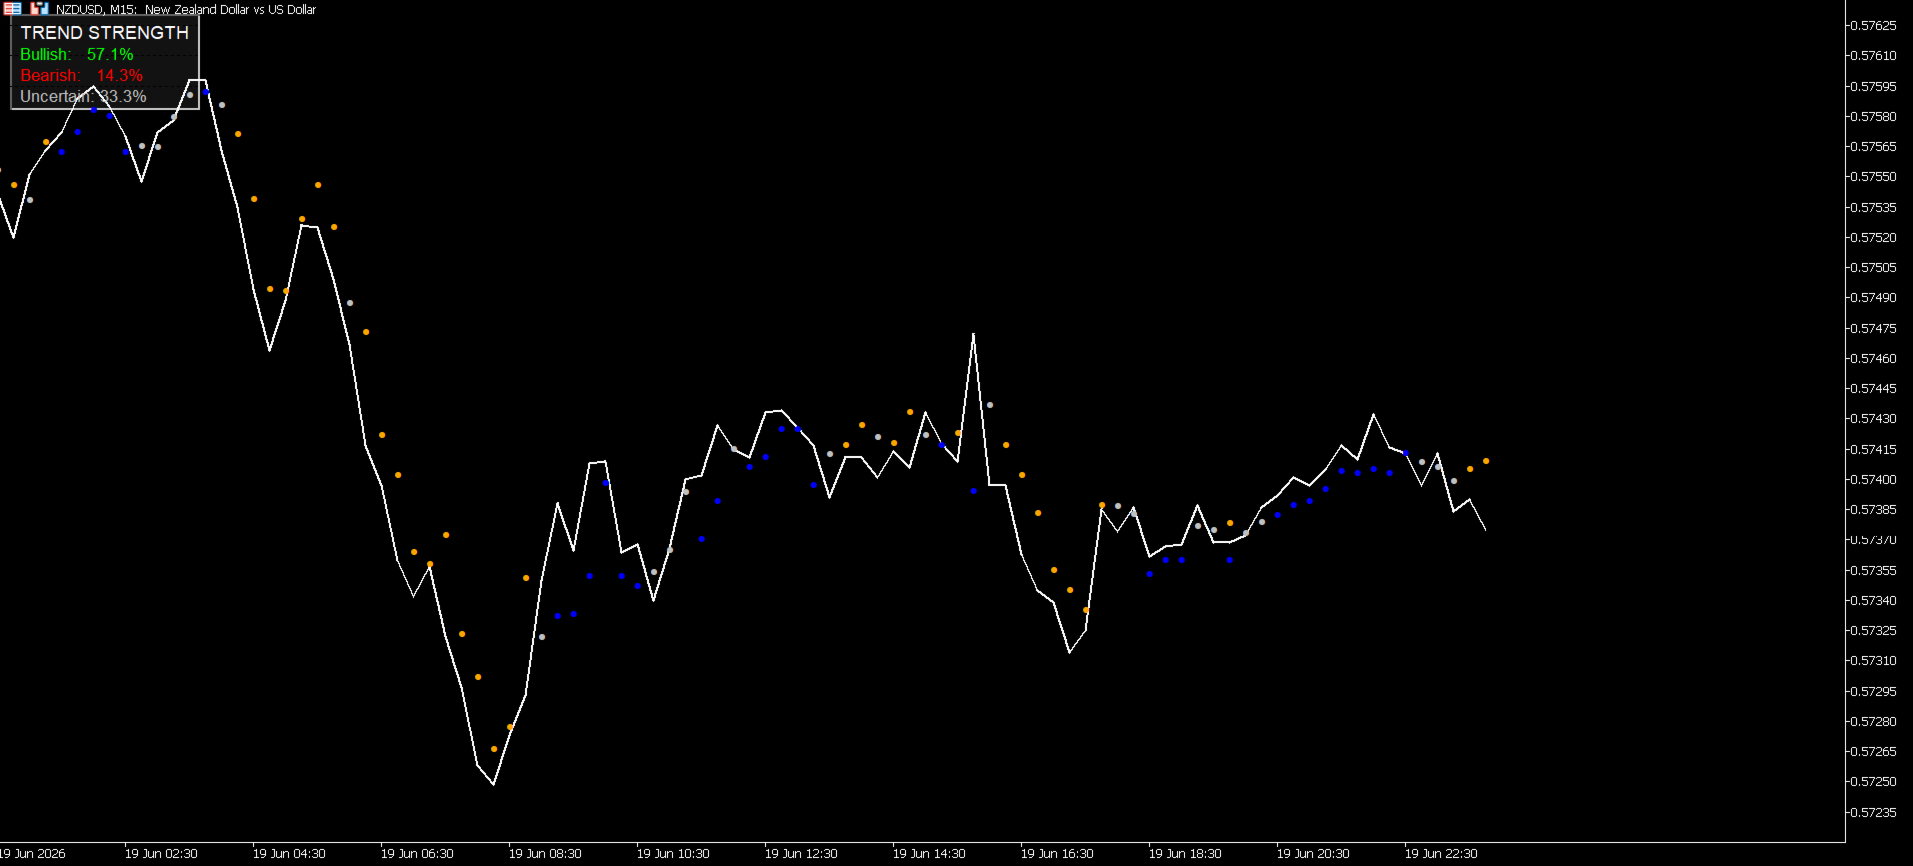
K's Synapse displays the recent proportion of bullish, bearish, and uncertain readings within its active analysis window.
This allows traders to see whether the current market environment is becoming increasingly one sided or remains structurally mixed.
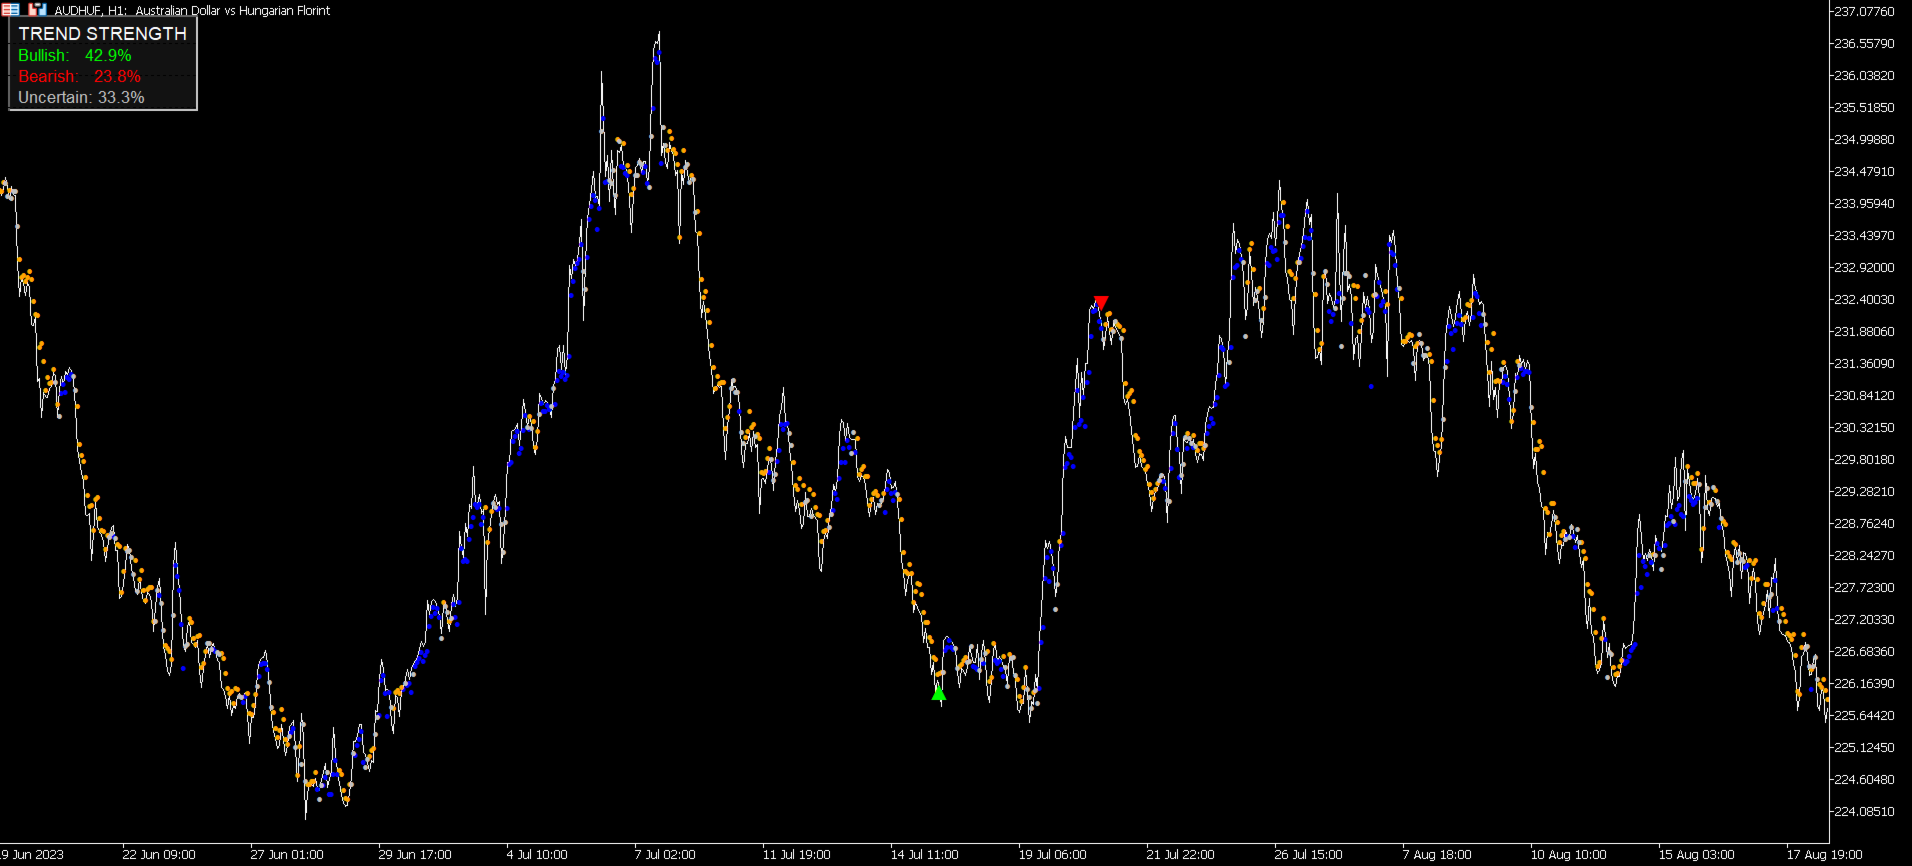
Triangle Signals
• Green upward triangle: potential bullish reversal or exhaustion event
• Red downward triangle: potential bearish reversal or exhaustion event
Triangle signals appear when the recent structure reaches a fully one sided condition. They are intended to highlight unusual extremes that may deserve closer attention.
Key Features
• Bullish, bearish, and neutral market structure dots
• Rolling market surety percentages
• High intensity green and red triangle signals
• Clean chart overlay
• Adjustable lookback and surety settings
• Adjustable dot and triangle appearance
• Hidden output buffers for additional analysis
• Optional signal alerts
• Suitable for different markets and timeframes
How to Use
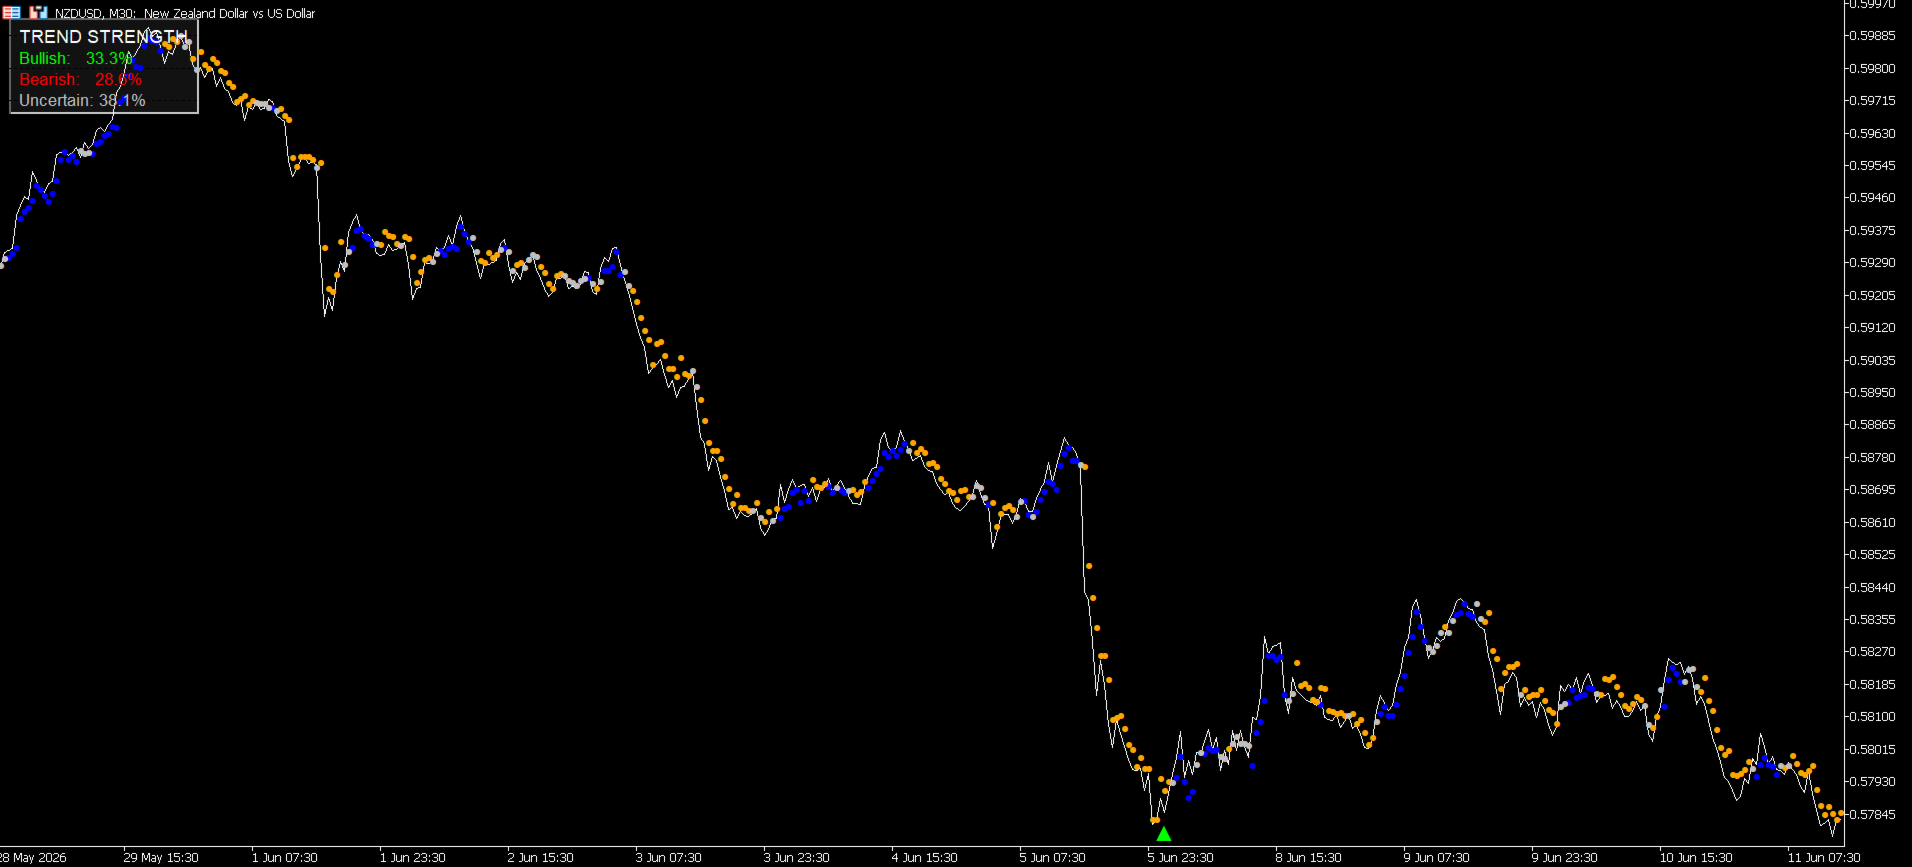
Blue and red dots can be used to follow shifts in short term market structure.
The surety summary can help traders assess whether one side of the market is becoming dominant.
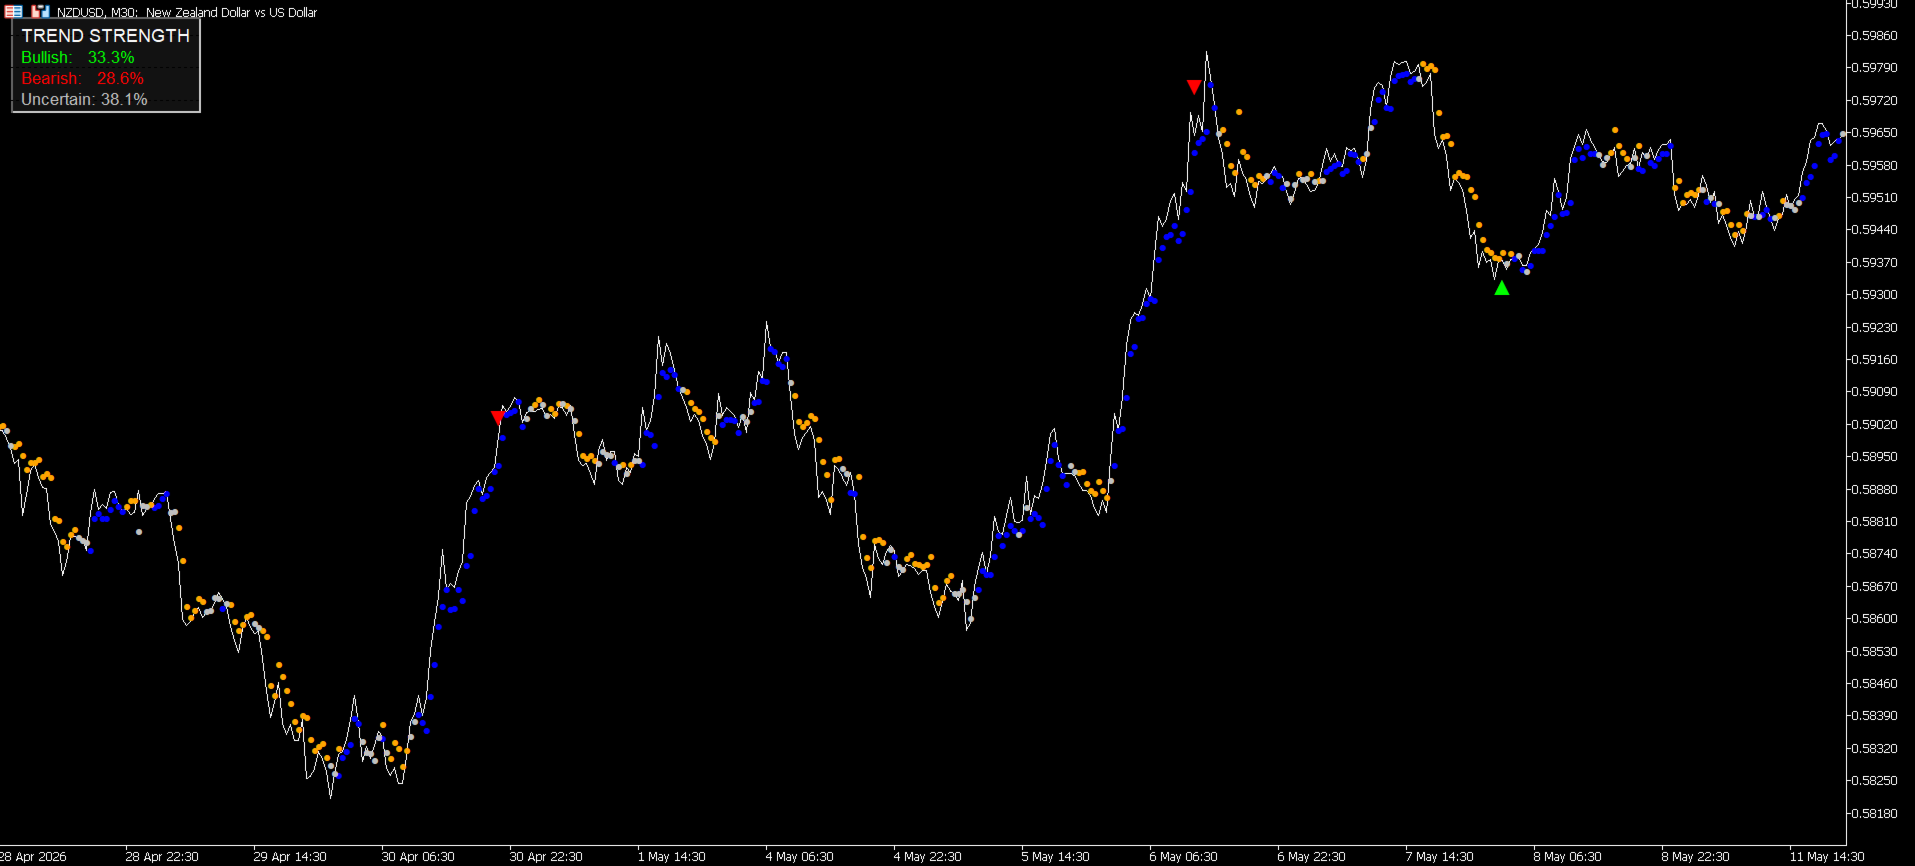
Green and red triangles highlight extreme structural conditions that may indicate exhaustion, reversal risk, or a possible change in market direction.
K's Synapse works best as an additional confirmation layer alongside trend analysis, support and resistance, volatility, price action, and risk management.
Important
K's Synapse is a decision support indicator. It does not guarantee future market direction and should not be used as a standalone trading system.