SmartZone Pro Sniper
- Indicatori
- Versione: 10.30
- Aggiornato: 12 luglio 2026
- Attivazioni: 5

Fai Trading di Domanda e Offerta Istituzionale con Precisione
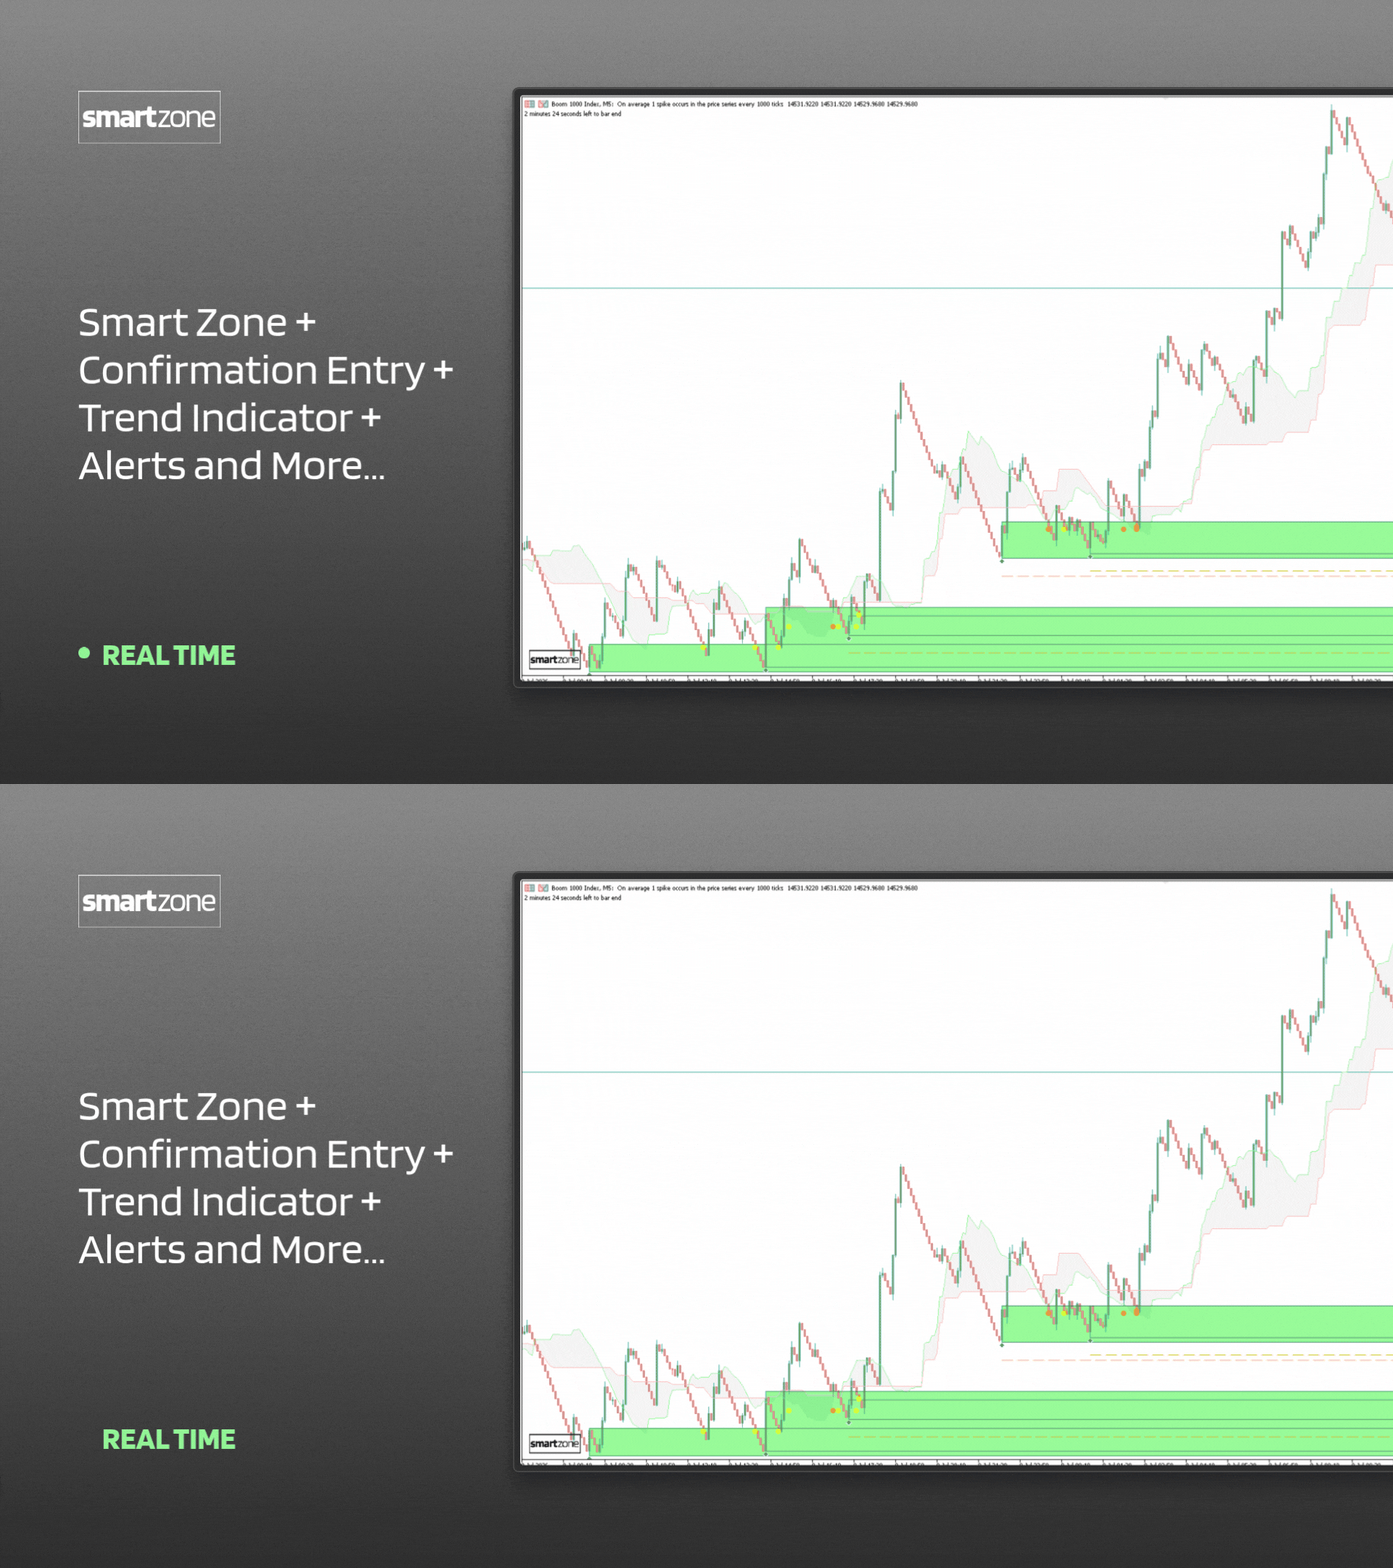
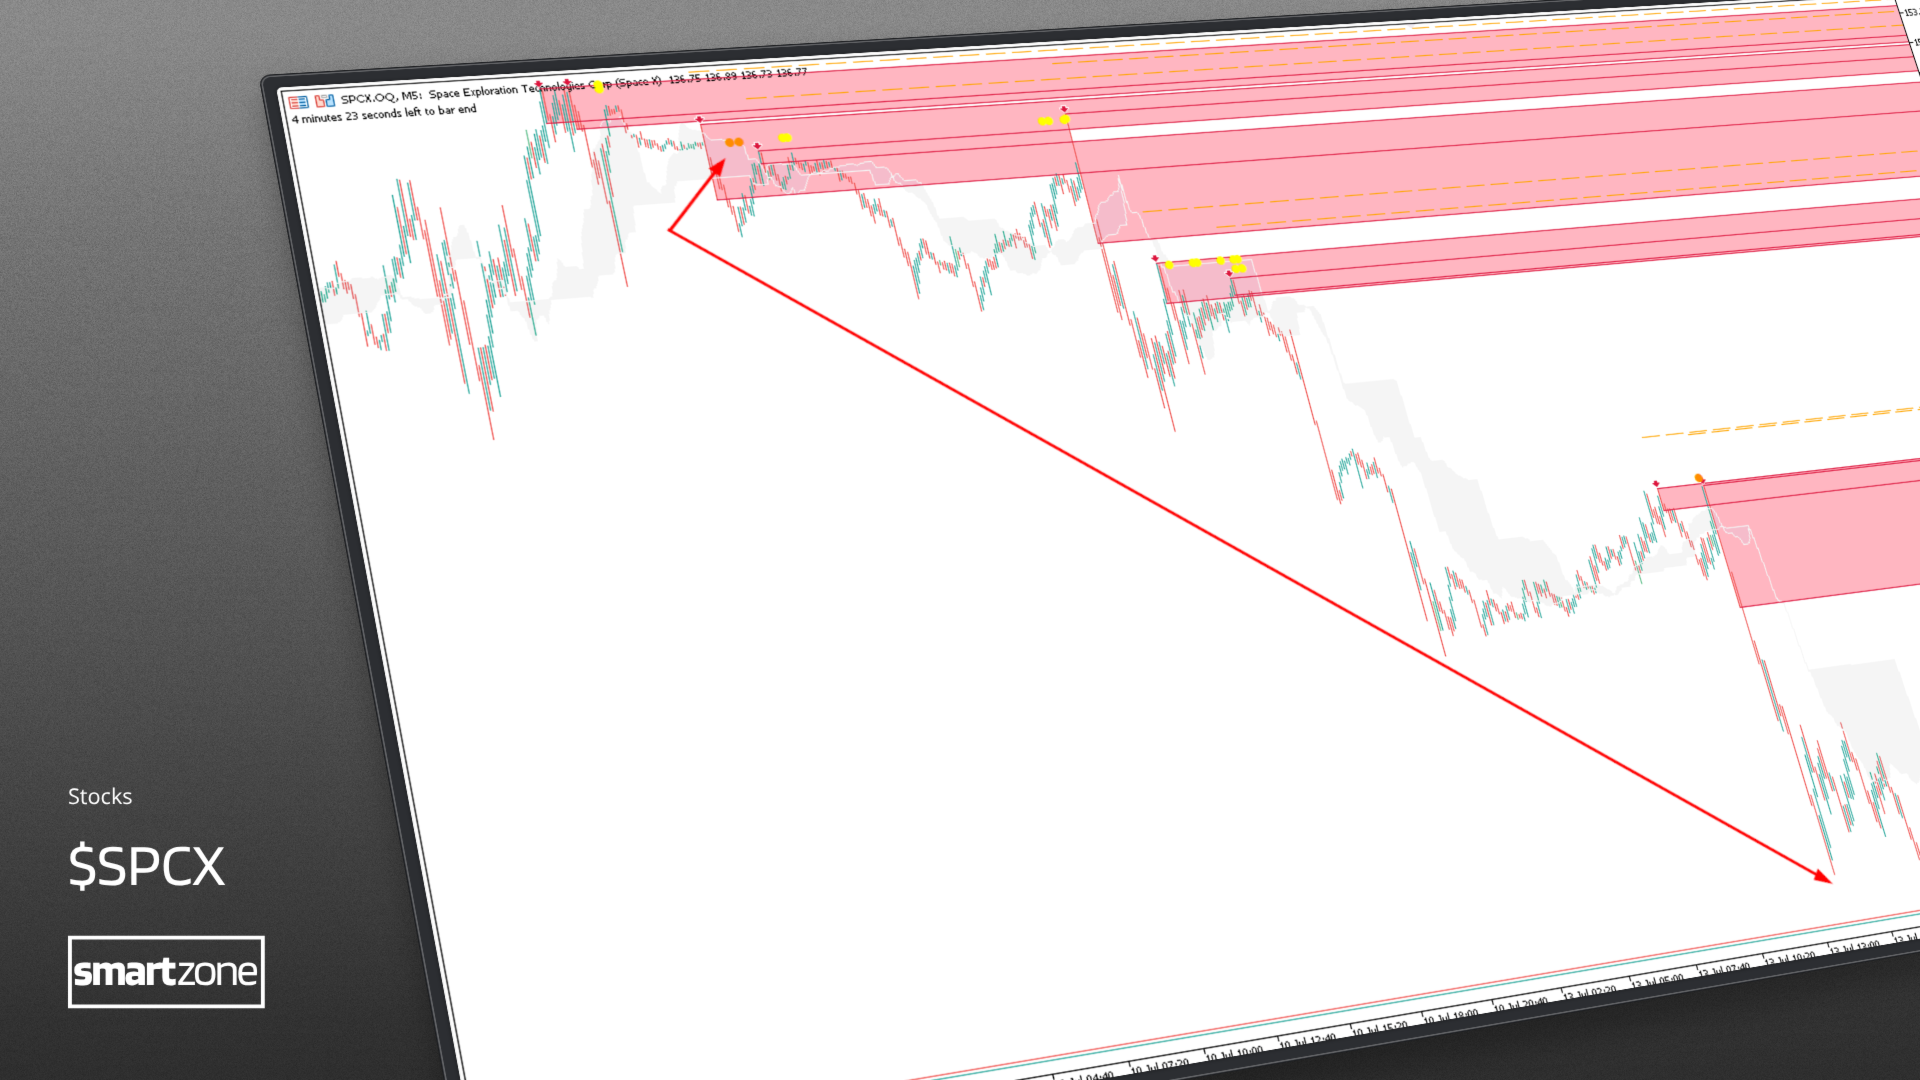
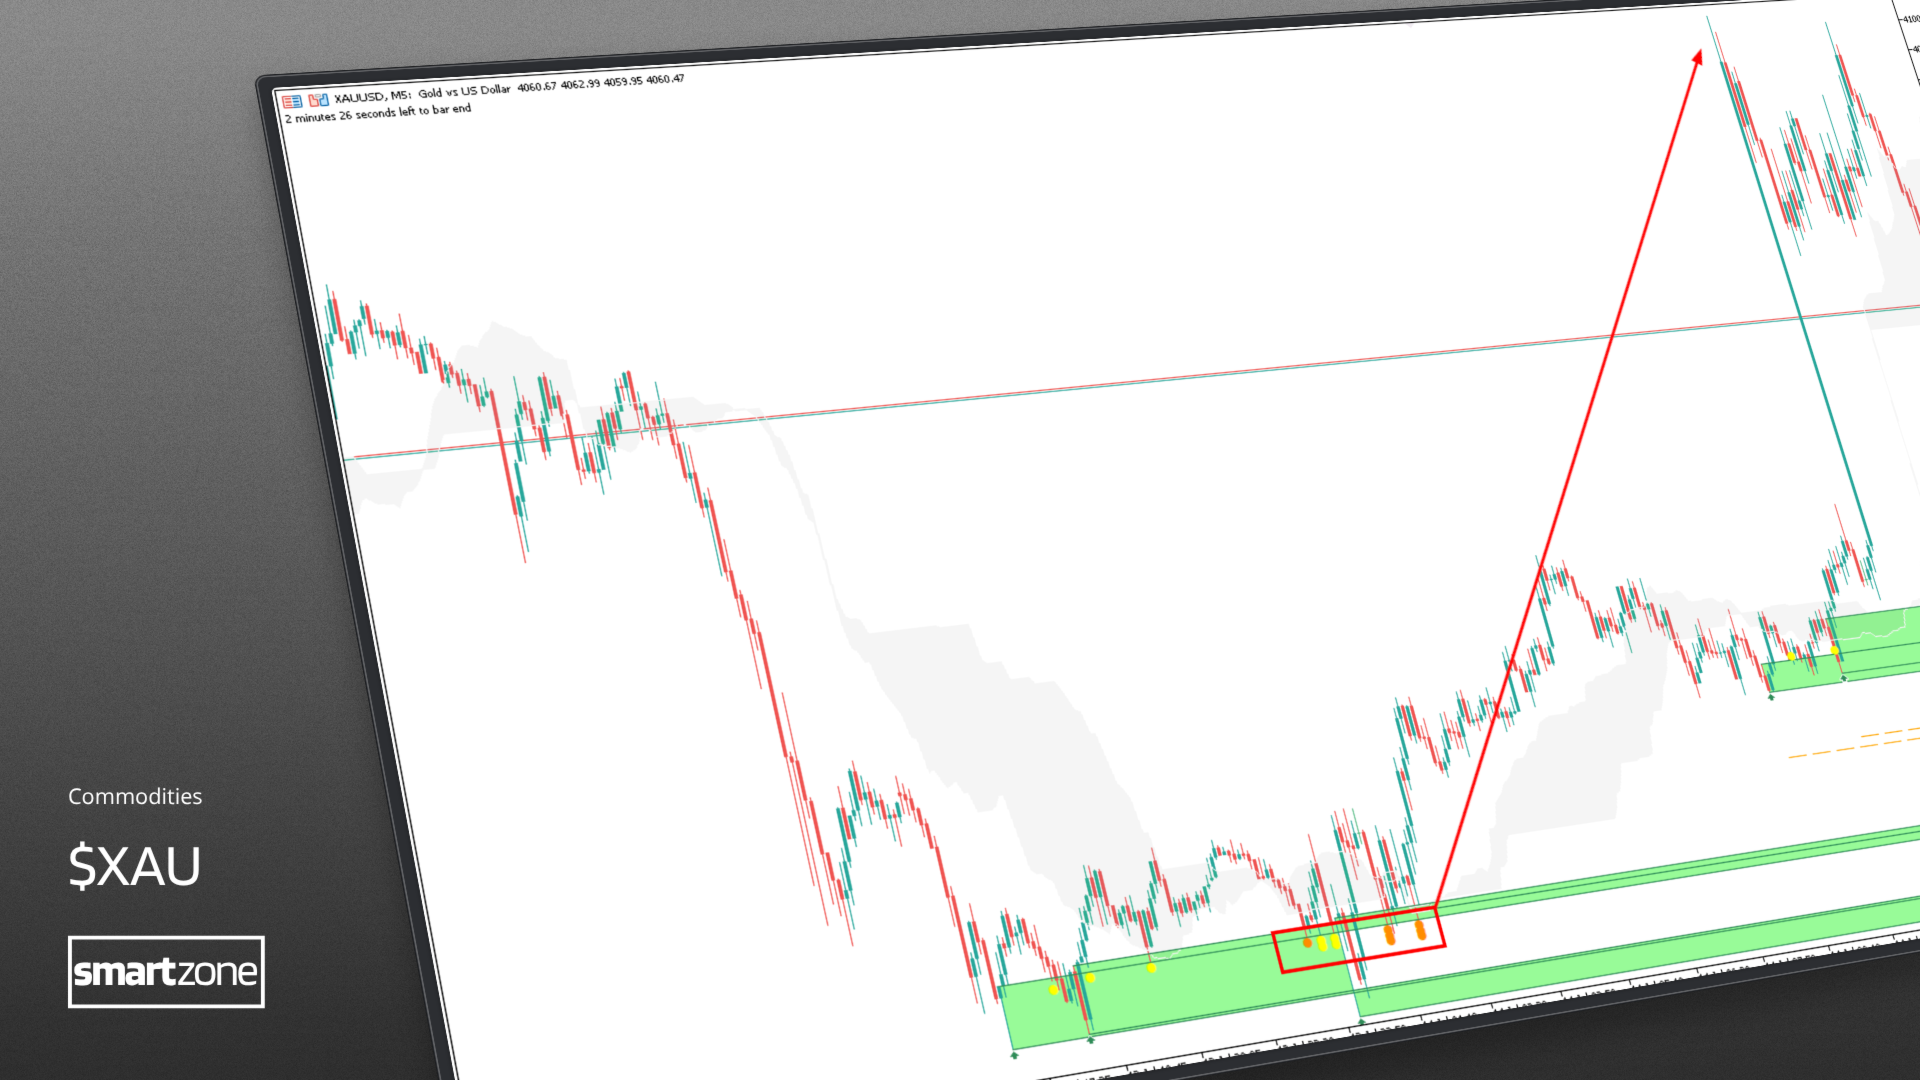
Smetti di affidarti a indicatori ritardatari. SmartZone Pro Sniper è un algoritmo avanzato di Price Action progettato per rilevare automaticamente le zone strutturali di domanda e offerta (Supply & Demand). Sviluppato per la massima precisione, questo strumento ti aiuta a identificare le aree in cui il mercato ha maggiore probabilità di reagire, facilitando una gestione efficace del tuo rapporto Rischio/Rendimento (R:R).
Compatibilità Universale con i Mercati
L'algoritmo si adatta in modo dinamico a diverse condizioni di mercato e intervalli temporali. Funziona su:
-
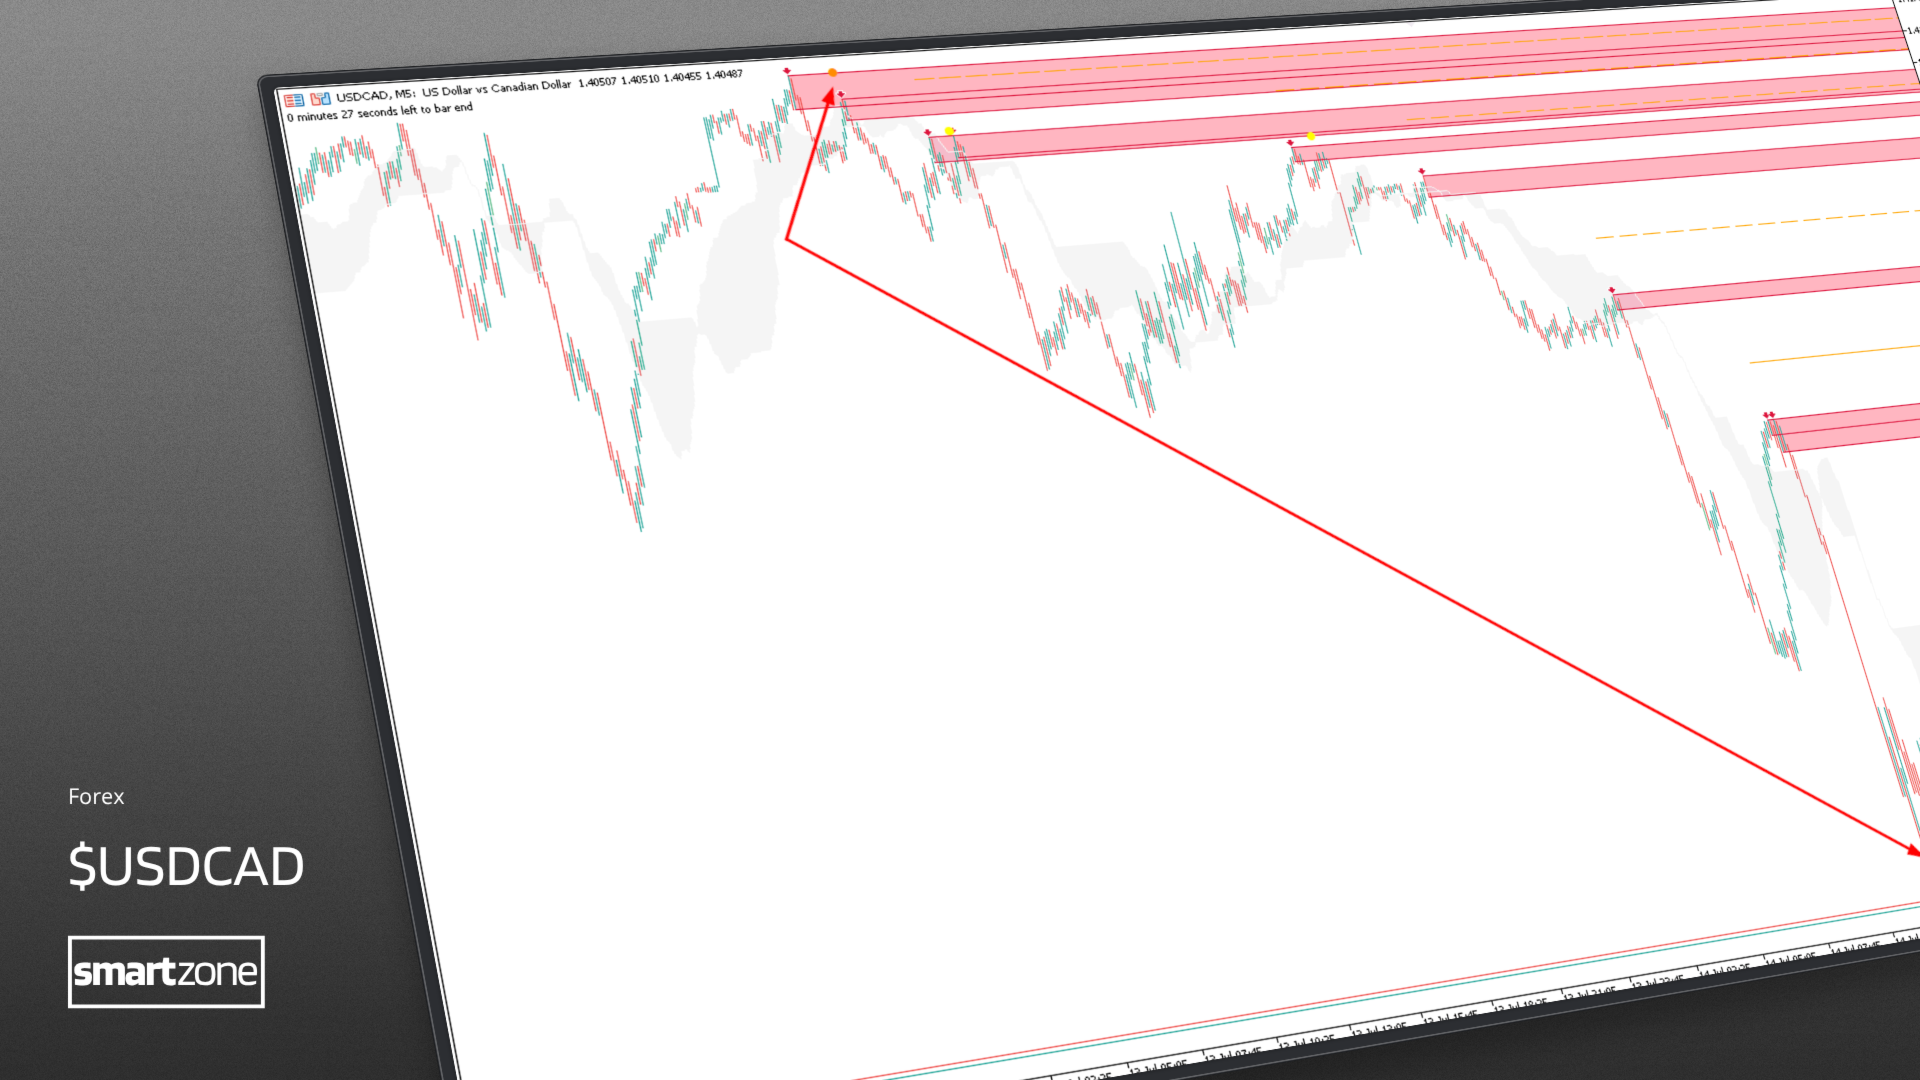
Forex e Valute: Coppie principali (major) e secondarie (minor).
-
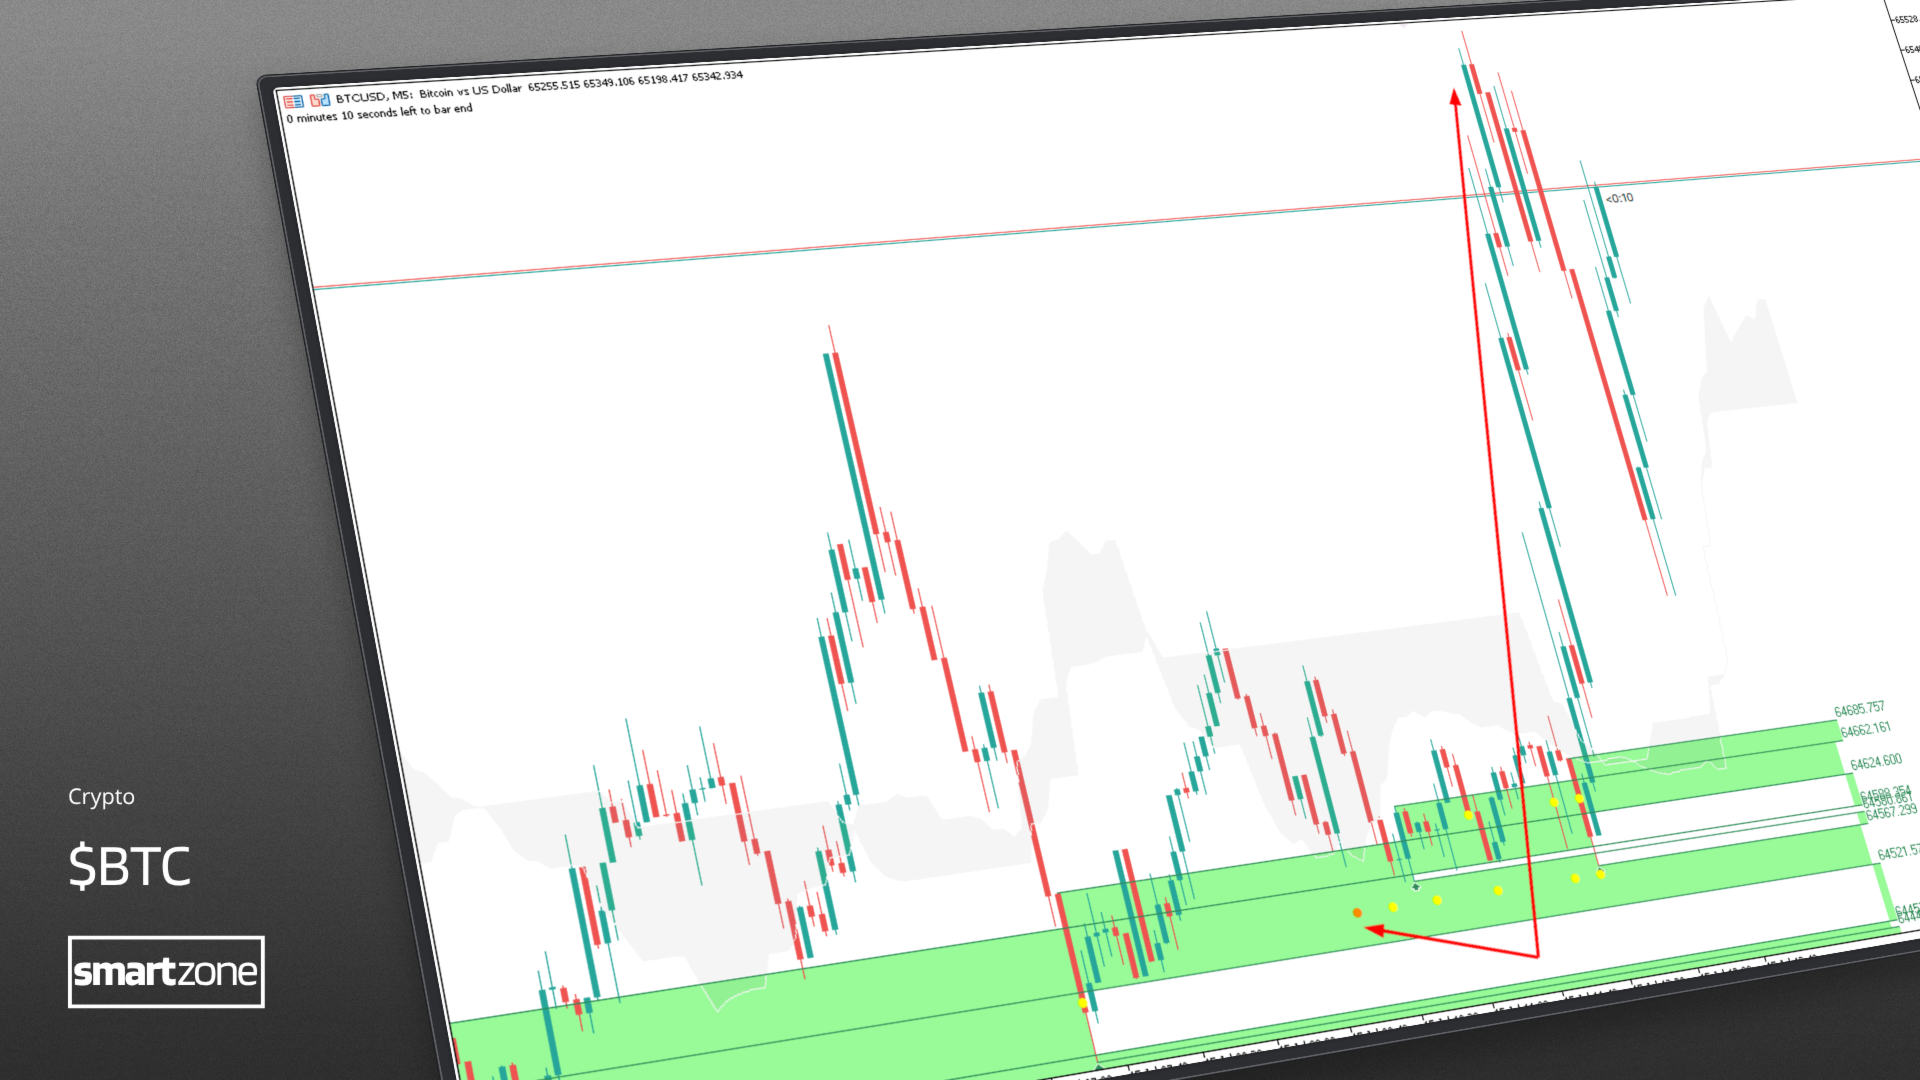
Criptovalute: BTC/USD, ETH/USD, ecc.
-
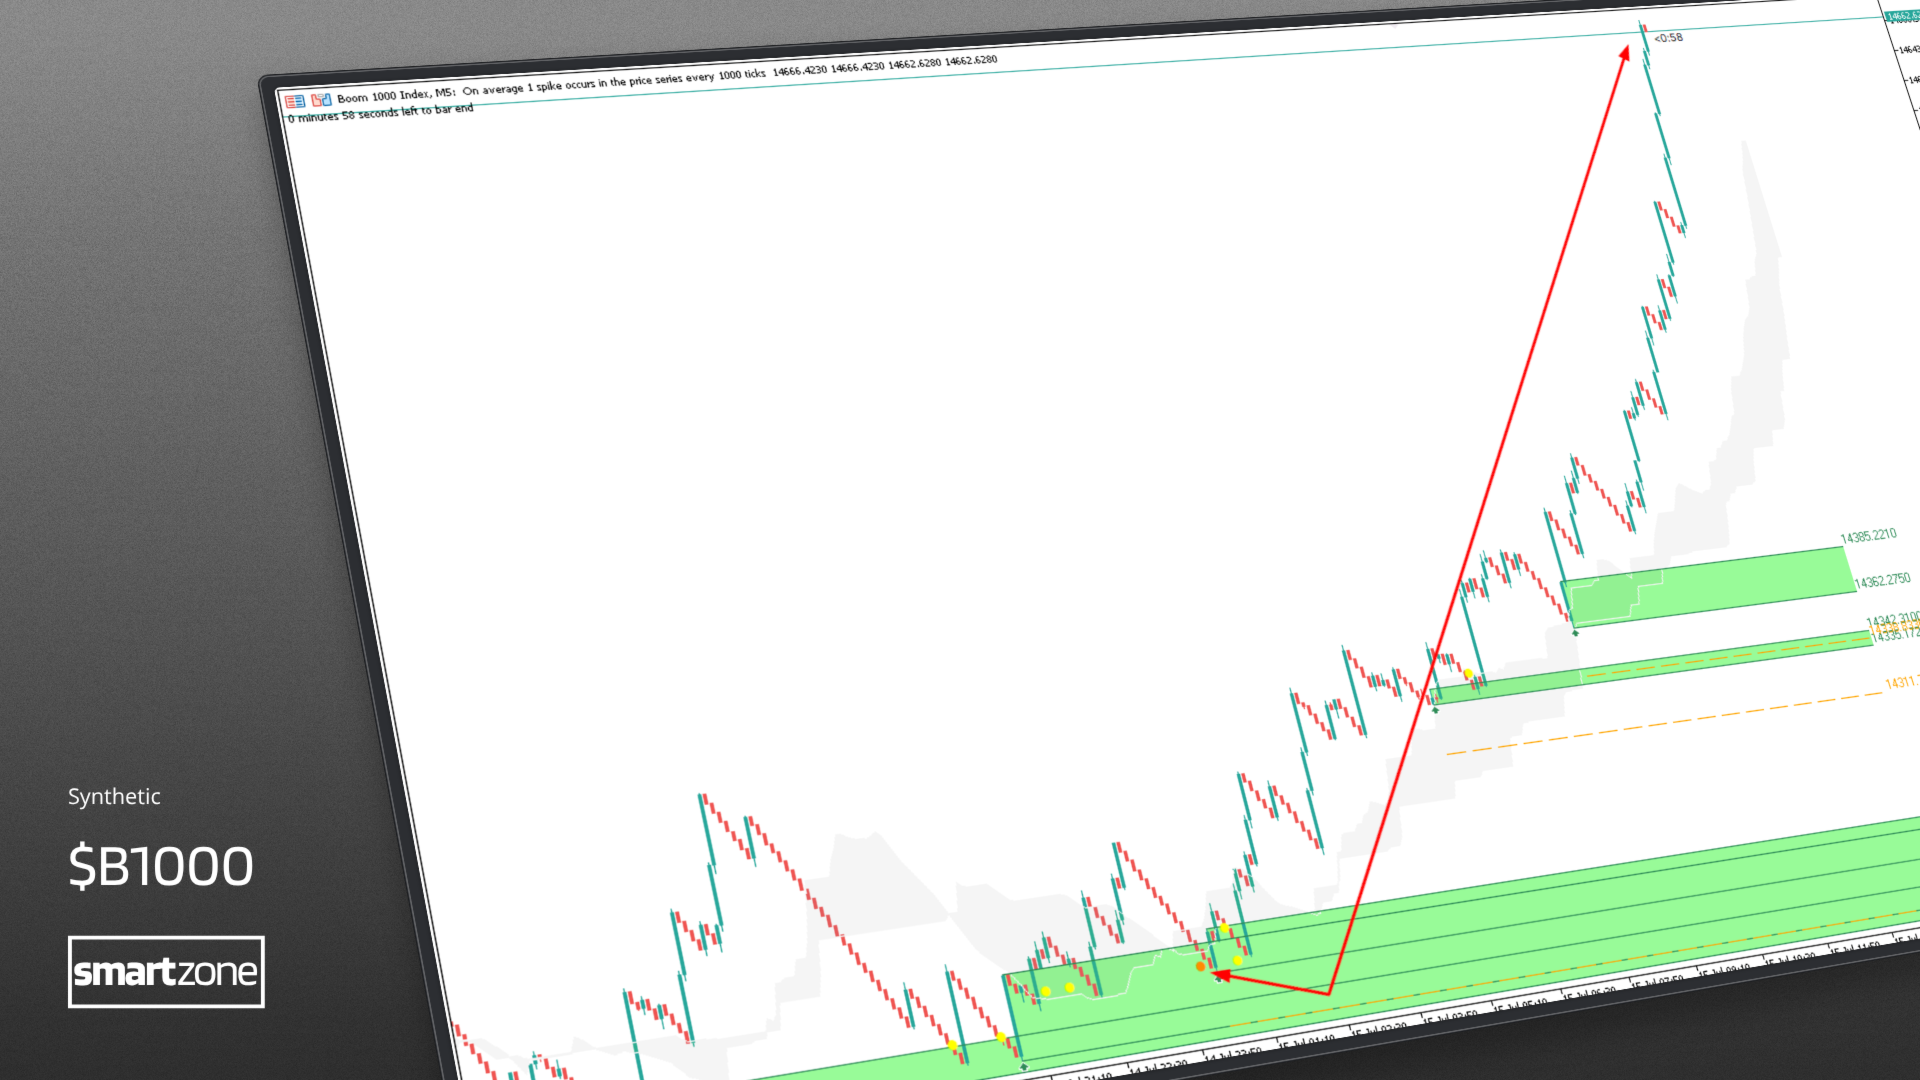
Indici Sintetici: Ottimizzato per Boom & Crash e Indici di Volatilità.
-
Materie Prime e Metalli: XAU/USD (Oro), WTI (Petrolio).
-
Azioni e Indici: US30, NAS100.
Obiettivo e Trasparente
A differenza degli indicatori standard che intasano il grafico, SmartZone Pro Sniper si concentra rigorosamente su massimi e minimi di oscillazione (swing highs/lows) verificati.
-
Stop Loss Dinamico: Calcola automaticamente uno Stop Loss consigliato in base alla volatilità del mercato (ATR) o a un margine fisso (buffer) per supportare la gestione del rischio.
-
Sistema di Rientro: Monitora ogni volta che il prezzo tocca una zona attiva (T1, T2, T3...). Traccia un chiaro indicatore visivo e invia un avviso quando si verifica un'opportunità di rientro (re-entry).
-
Rigorosamente Senza Ricalcolo (Non-Repainting): Una volta che una zona o una freccia viene confermata e la candela si chiude, rimane lì in modo permanente sul grafico.
Come Utilizzarlo
-
Per i Principianti: Attendi che l'algoritmo tracci una nuova zona di Acquisto (Verde) o di Vendita (Rossa). Quando il prezzo ritorna nella zona (pullback), l'indicatore ti avviserà (tramite pop-up o segnale acustico). Valuta l'operazione nella direzione della zona, considera di posizionare lo Stop Loss dove suggerito dalla linea tratteggiata dell'indicatore e punta a un rapporto Rischio/Rendimento logico.
-
Per i Trader Avanzati: SmartZone Pro Sniper può essere utilizzato come strumento di confluenza (confluence). Identifica il macro trend su intervalli temporali più alti (H1 o H4) e usa questo indicatore su intervalli più bassi (M5 o M15) per eseguire ingressi all'interno di aree strutturali più ampie. Si abbina perfettamente a profili di volume (Volume Profile), ritracciamenti di Fibonacci o divergenze RSI per convalidare la tua tesi di trading.
Caratteristiche Chiave
-
Rilevamento Intelligente delle Zone: Identifica automaticamente le aree pivot di supporto e resistenza istituzionale.
-
Interfaccia Personalizzabile: Regola completamente colori, profondità di ricerca (depth) e barre storiche nel grafico.
-
Sistema di Avvisi Multipli: Ricevi notifiche istantanee per i rientri sullo schermo (Pop-up) e tramite segnali acustici.
-
Tecnologia Grafico Pulito: Le zone vecchie o rotte vengono rimosse automaticamente (opzionale) per mantenere lo spazio di lavoro libero da elementi visivi superflui.
-
Nuvola di Ichimoku Integrata e Motore "Perfect Entry": Aggiunge una nuvola di Ichimoku opzionale e integrata nel grafico. L'algoritmo monitora automaticamente l'allineamento del trend; quando si verifica un tocco di zona in perfetta confluenza con il trend di Ichimoku (incrocio Tenkan/Kijun e posizione rispetto alla nuvola), traccia una stella arancione di "Rientro Perfetto" (Perfect Reentry) e attiva un avviso premium.
-
Codice Altamente Ottimizzato: Sviluppato con controllo di versione per zone e sovrapposizioni di colore. I calcoli vengono elaborati solo quando una zona cambia (e non a ogni tick), garantendo zero rallentamenti della piattaforma anche durante la scansione di uno storico di oltre 2.000 barre.