Alpha Liquidity Map
- Indicatori
- Versione: 1.0

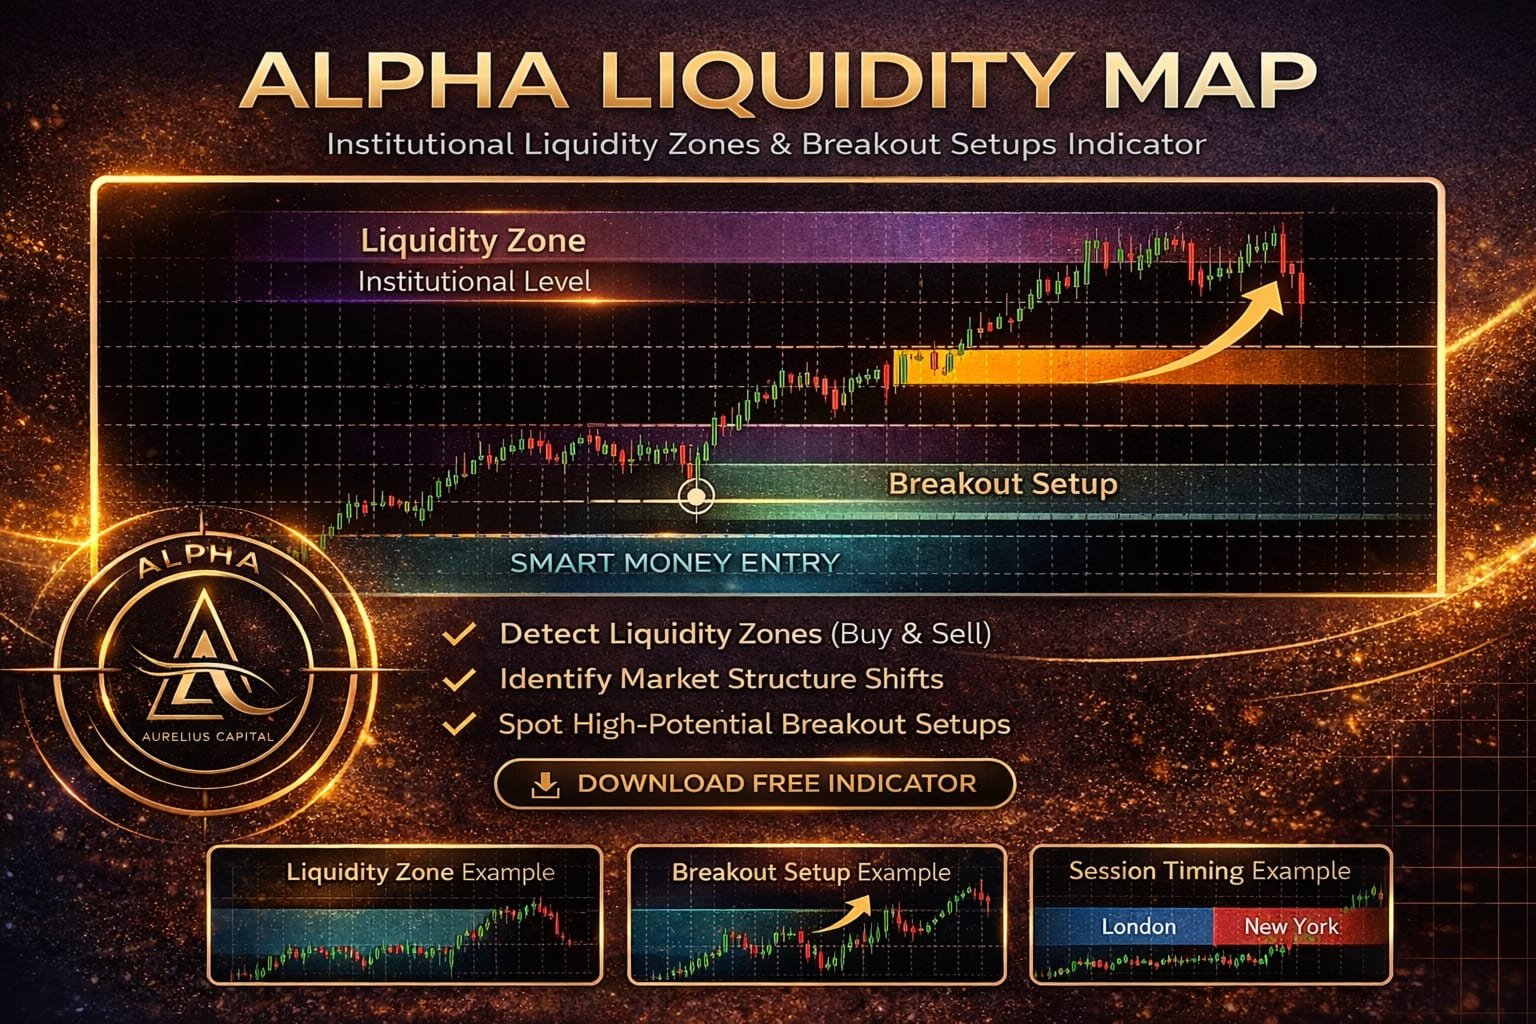
🔥 ALPHA LIQUIDITY MAP – Smart Money Indicator
Alpha Liquidity Map is a professional Smart Money Concept (SMC) indicator designed to reveal institutional liquidity zones, compression areas, and high-probability trading zones.
This tool helps traders understand how the market truly moves — driven by liquidity and institutional behavior, not retail signals.
🎯 CORE FEATURES
- ✔ Detect Buy & Sell Liquidity Zones
- ✔ Identify Smart Money Accumulation Areas
- ✔ Highlight Compression Zones before breakout
- ✔ Visualize London & New York Killzones
- ✔ Works on all pairs (Best on XAUUSD, Forex majors)
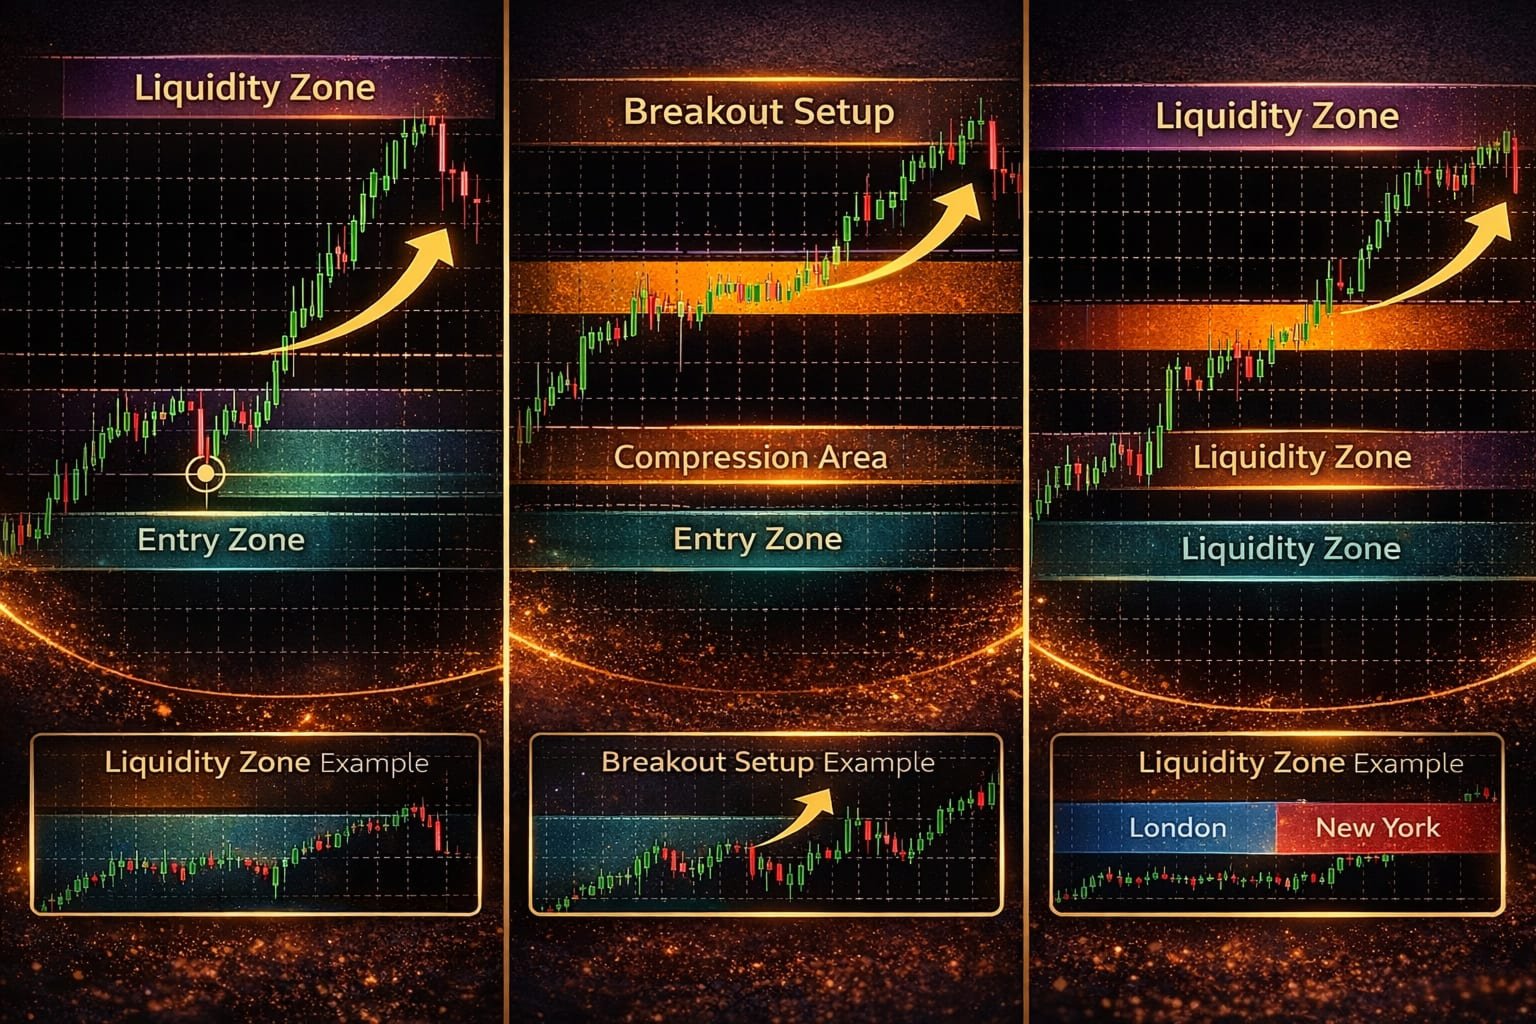
🎨 ZONE COLOR EXPLANATION
🟣 SELL LIQUIDITY ZONE (Purple)
Represents areas where liquidity is concentrated above price. Typically filled with stop losses from buyers.
- ➡ Potential reversal zone (bearish)
- ➡ Smart Money hunts liquidity before moving down
- ➡ Look for SELL setups after confirmation
🟢 BUY LIQUIDITY ZONE (Dark Green)
Represents areas where liquidity is concentrated below price. Usually contains stop losses from sellers.
- ➡ Potential reversal zone (bullish)
- ➡ Institutional accumulation area
- ➡ Look for BUY setups after confirmation
🟠 COMPRESSION ZONE (Orange)
Indicates a tight range where price is consolidating. This is where Smart Money builds positions before a breakout.
- ➡ High probability breakout zone
- ➡ Expect strong movement after consolidation
- ➡ Trade breakout direction
🔵 LONDON KILLZONE (Blue)
Marks the London session — where volatility begins to increase.
- ➡ Often contains fake moves (liquidity grab)
- ➡ Wait for confirmation before entry
🔴 NEW YORK KILLZONE (Tomato)
Represents the New York session — continuation or reversal phase.
- ➡ Strong directional moves
- ➡ Ideal for trend continuation entries
⚙️ HOW TO USE
✅ Recommended Timeframe Setup:
- M1 – M5 → Entry execution
- M15 – M30 → Market structure confirmation
- H1 → Overall trend direction
🔥 Trading Workflow:
- Identify Liquidity Zones (Buy or Sell)
- Wait for price to reach the zone
- Observe price reaction (rejection / breakout)
- Enter on lower timeframe confirmation
- Place Stop Loss outside the zone
📈 SIMPLE STRATEGY EXAMPLES
- Price enters SELL zone → Look for rejection → Enter SELL
- Price enters BUY zone → Look for bounce → Enter BUY
- Price consolidates in Compression → Wait breakout → Follow momentum
⚠️ IMPORTANT NOTES
- This is NOT an automatic signal indicator
- Always combine with price action & market structure
- Use proper risk management
💡 BEST PRACTICES
- ✔ Trade during London & New York sessions
- ✔ Focus on 1–2 instruments for consistency
- ✔ Avoid trading in unclear sideways conditions
🚀 Want Full Automation?
This indicator is part of a complete institutional trading system.
👉 Want auto trading version?
👉 Alpha Revolution PRO (EA)
https://www.mql5.com/en/market/product/170840
🚀 FINAL NOTE
Alpha Liquidity Map gives you the ability to read the market like institutional traders.
Not just an indicator — this is your Smart Money insight tool.