Master Pattern Indicator
- Indicatori
- Versione: 1.0
- Attivazioni: 7

In trading, the Master Pattern (sometimes called the market master pattern) is a conceptual framework describing how price typically moves as capital flows through markets. It is not a rule-set, but a recurring structural sequence driven by institutional behaviour, liquidity, and crowd psychology.
Different trading schools describe it with different names, but the underlying logic is largely the same.
Core Idea
Markets tend to move through a repeating cycle:
Accumulation → Expansion → Distribution → Contraction (or Reversal)
This cycle exists across all timeframes, from minutes to months.
Why It’s Called “Master”
Because almost every strategy fits somewhere inside this pattern:
-
Breakout trading → Expansion phase
-
Range trading → Accumulation / Distribution
-
Trend following → Expansion
-
Mean reversion → Distribution / Contraction
-
Smart Money Concepts → Accumulation & Distribution
-
Wyckoff Method → Entire pattern
The 4 Phases of the Master Pattern
1. Accumulation/Contraction (Smart Money Entry)
What happens
-
Large players (banks, funds) quietly build positions
-
Price moves sideways in a tight range
-
Volatility is low, volume may increase subtly
Key characteristics
-
Range-bound price
-
False breakouts (liquidity grabs)
-
Retail traders lose interest or get chopped
Trader’s objective
-
Identify the range
-
Anticipate the directional move that follows
2. Expansion (Markup / Trend Phase)
What happens
-
Price breaks out of accumulation
-
Strong directional movement begins
-
Momentum indicators expand
Key characteristics
-
Higher highs / higher lows (or opposite for downtrend)
-
Increasing volatility
-
Trend-following strategies perform best
Trader’s objective
-
Enter early in the breakout or pullbacks
-
Ride the trend, not fade it
3. Distribution/Trend (Smart Money Exit)
What happens
-
Institutions offload positions to late entrants
-
Price slows and starts ranging again
-
Volatility becomes erratic
Key characteristics
-
Choppy price near highs (or lows in a downtrend)
-
Failed continuations
-
Divergences often appear
Trader’s objective
-
Stop chasing the trend
-
Prepare for reversal or range trading
4. Contraction / Reversal (Markdown or Reset)
What happens
-
Trend breaks
-
Price returns to value or enters a new accumulation
-
Weak hands are forced out
Key characteristics
-
Sharp counter-moves
-
Stop-loss cascades
-
Volatility spikes, then fades
Trader’s objective
-
Avoid emotional trading
-
Wait for the next accumulation phase
Comparison to Other Indicators
| This Indicator | Repainting | Lag | Best For |
|---|---|---|---|
| Master Pattern Indicator | Mild-Moderate | Moderate | Swing trading, pattern confirmation |
| RSI | None | Low | Overbought/oversold |
| Moving Average | None | High | Trend following |
| MACD | None | High | Momentum shifts |
| ZigZag | Severe | Extreme | Historical analysis only |
| Pivot Points | None | None | Intraday levels |
| Bollinger Bands | None | Moderate | Volatility |
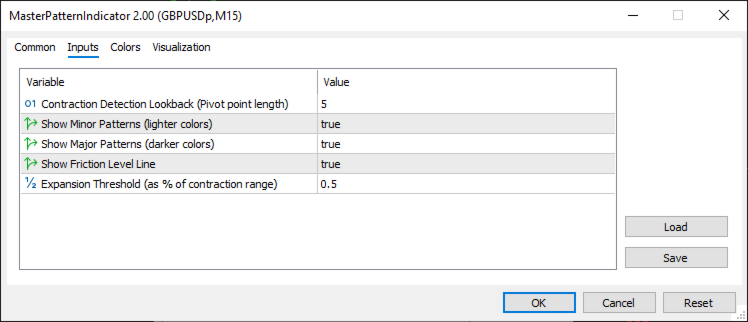
Input parameters guide
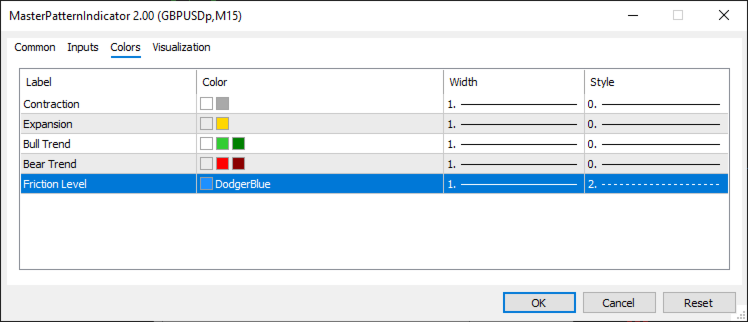
Contraction Detection Lookback : How many bars on each side of a potential high/low must be smaller/larger to confirm it as a pivot point.
Example value = 3:
97 98 99 100 99 98 97 ← Need 3 bars lower on EACH side
↑ ↑ ↑ ↑ ↑ ↑
Left bars Center Right bars
Center bar (100) is a PIVOT HIGH because:
- 3 bars to left are lower
- 3 bars to right are lower
Real-world meaning:
value 1-2: Sensitive, detects small swings, more signals, more noise.
4-5+: Only catches significant swings, fewer signals, more reliable.
Recommended settings:
- Scalping (M5-M15): 2
- Day Trading (M15-H1): 3 (default)
- Swing Trading (H4-D1): 4-5
- Position Trading (D1-W1): 5-7
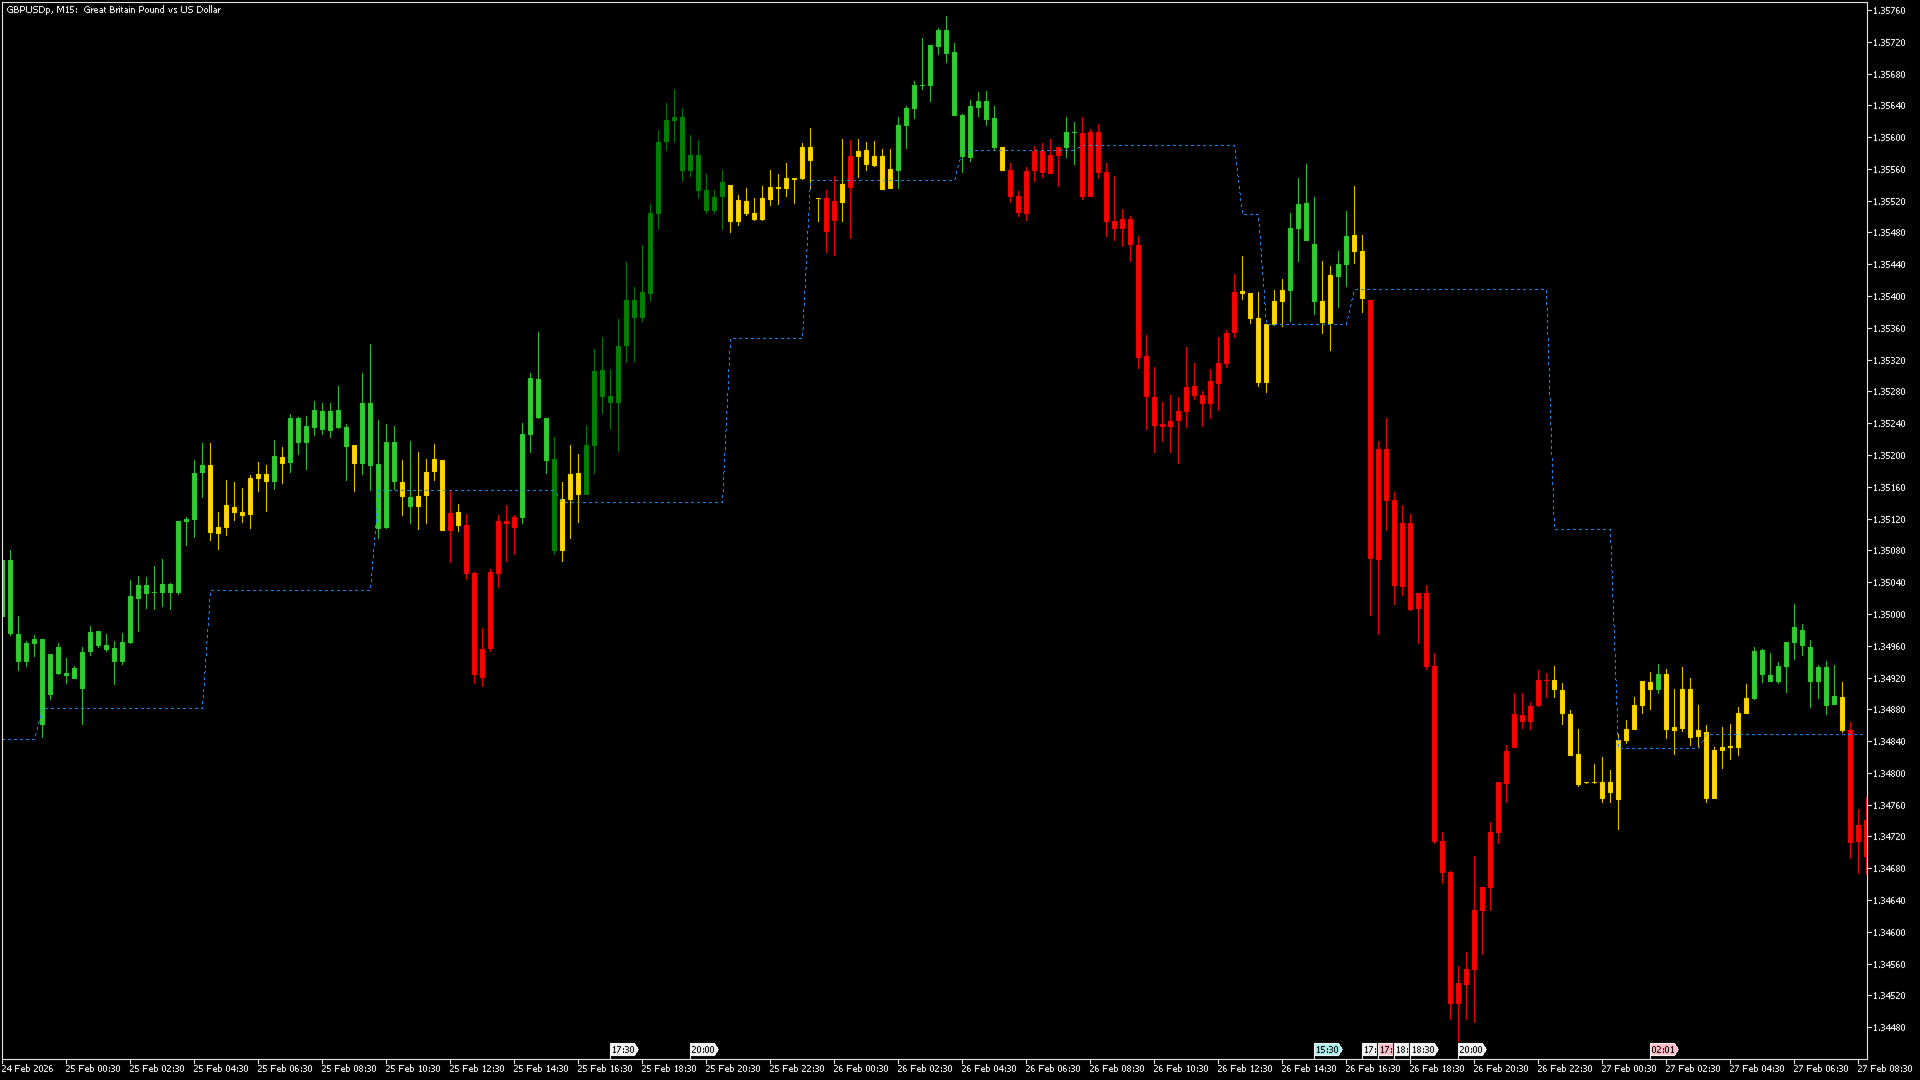
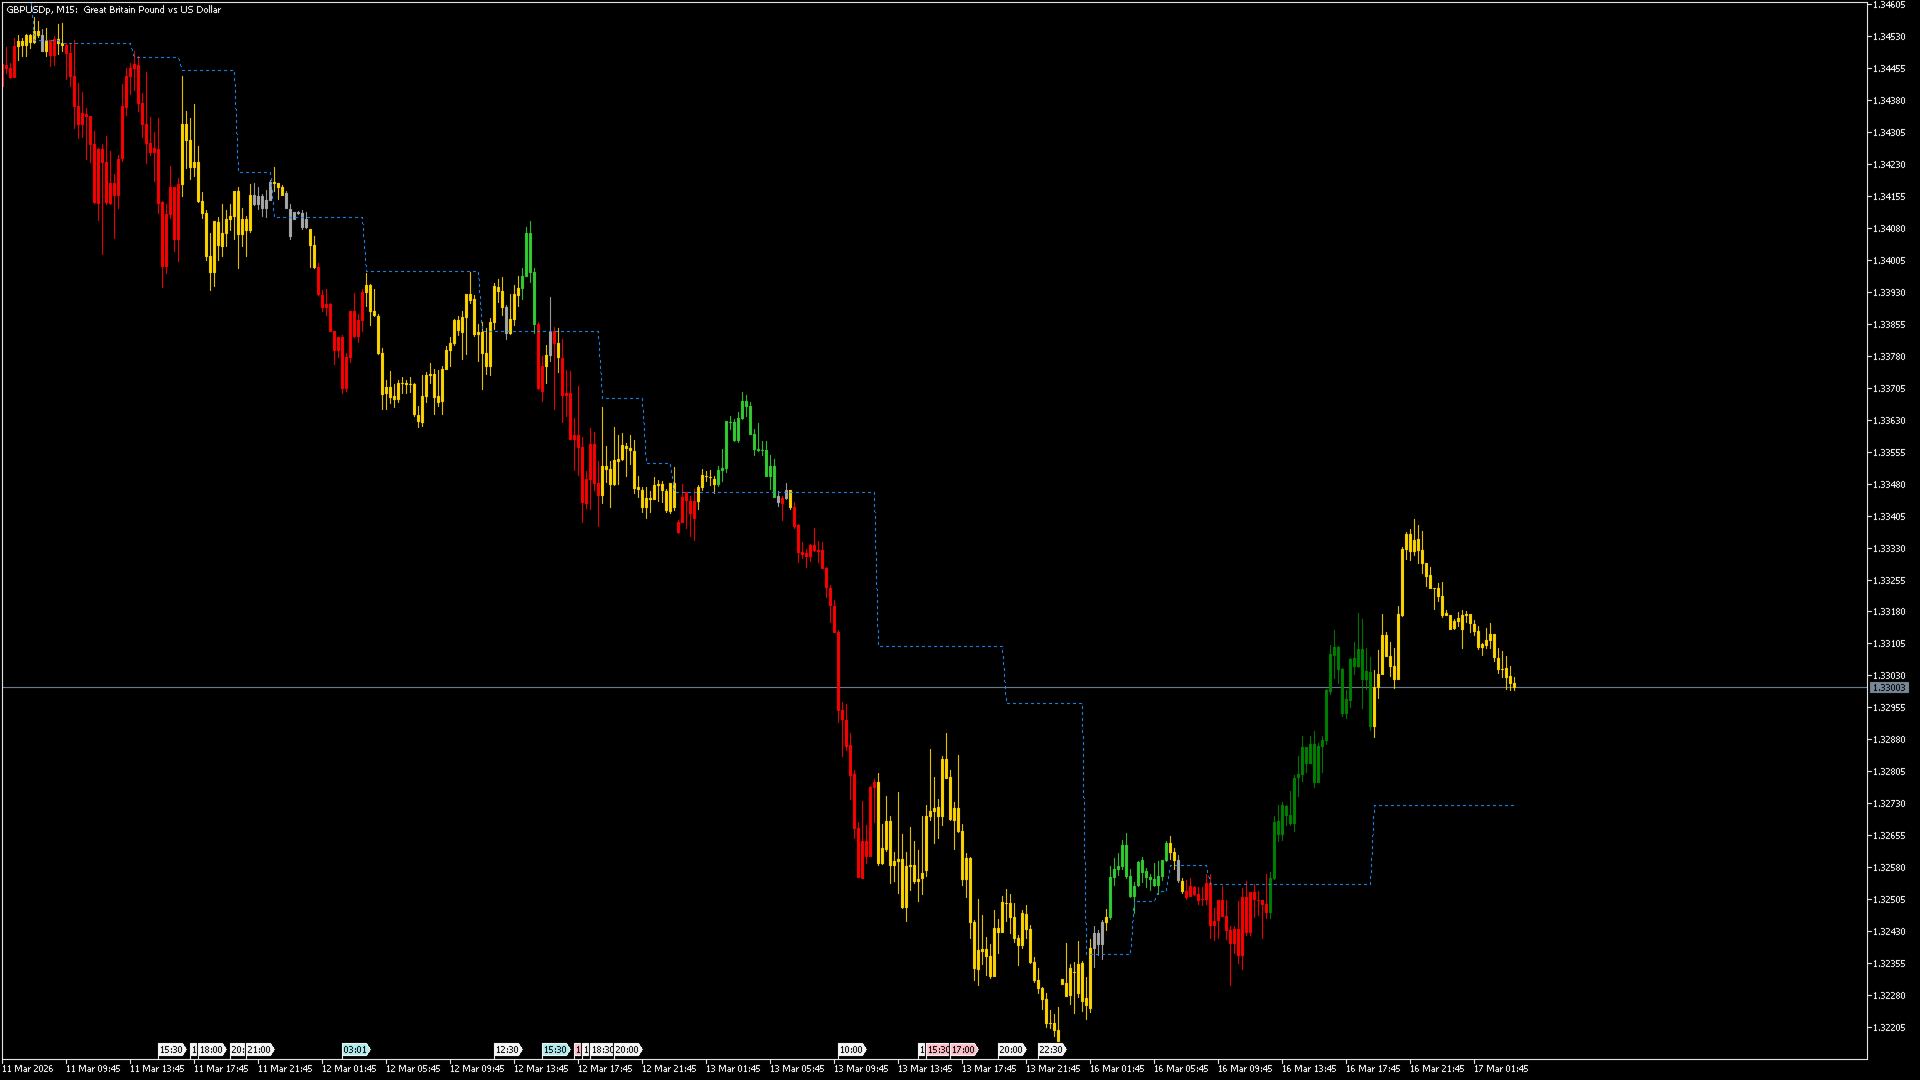
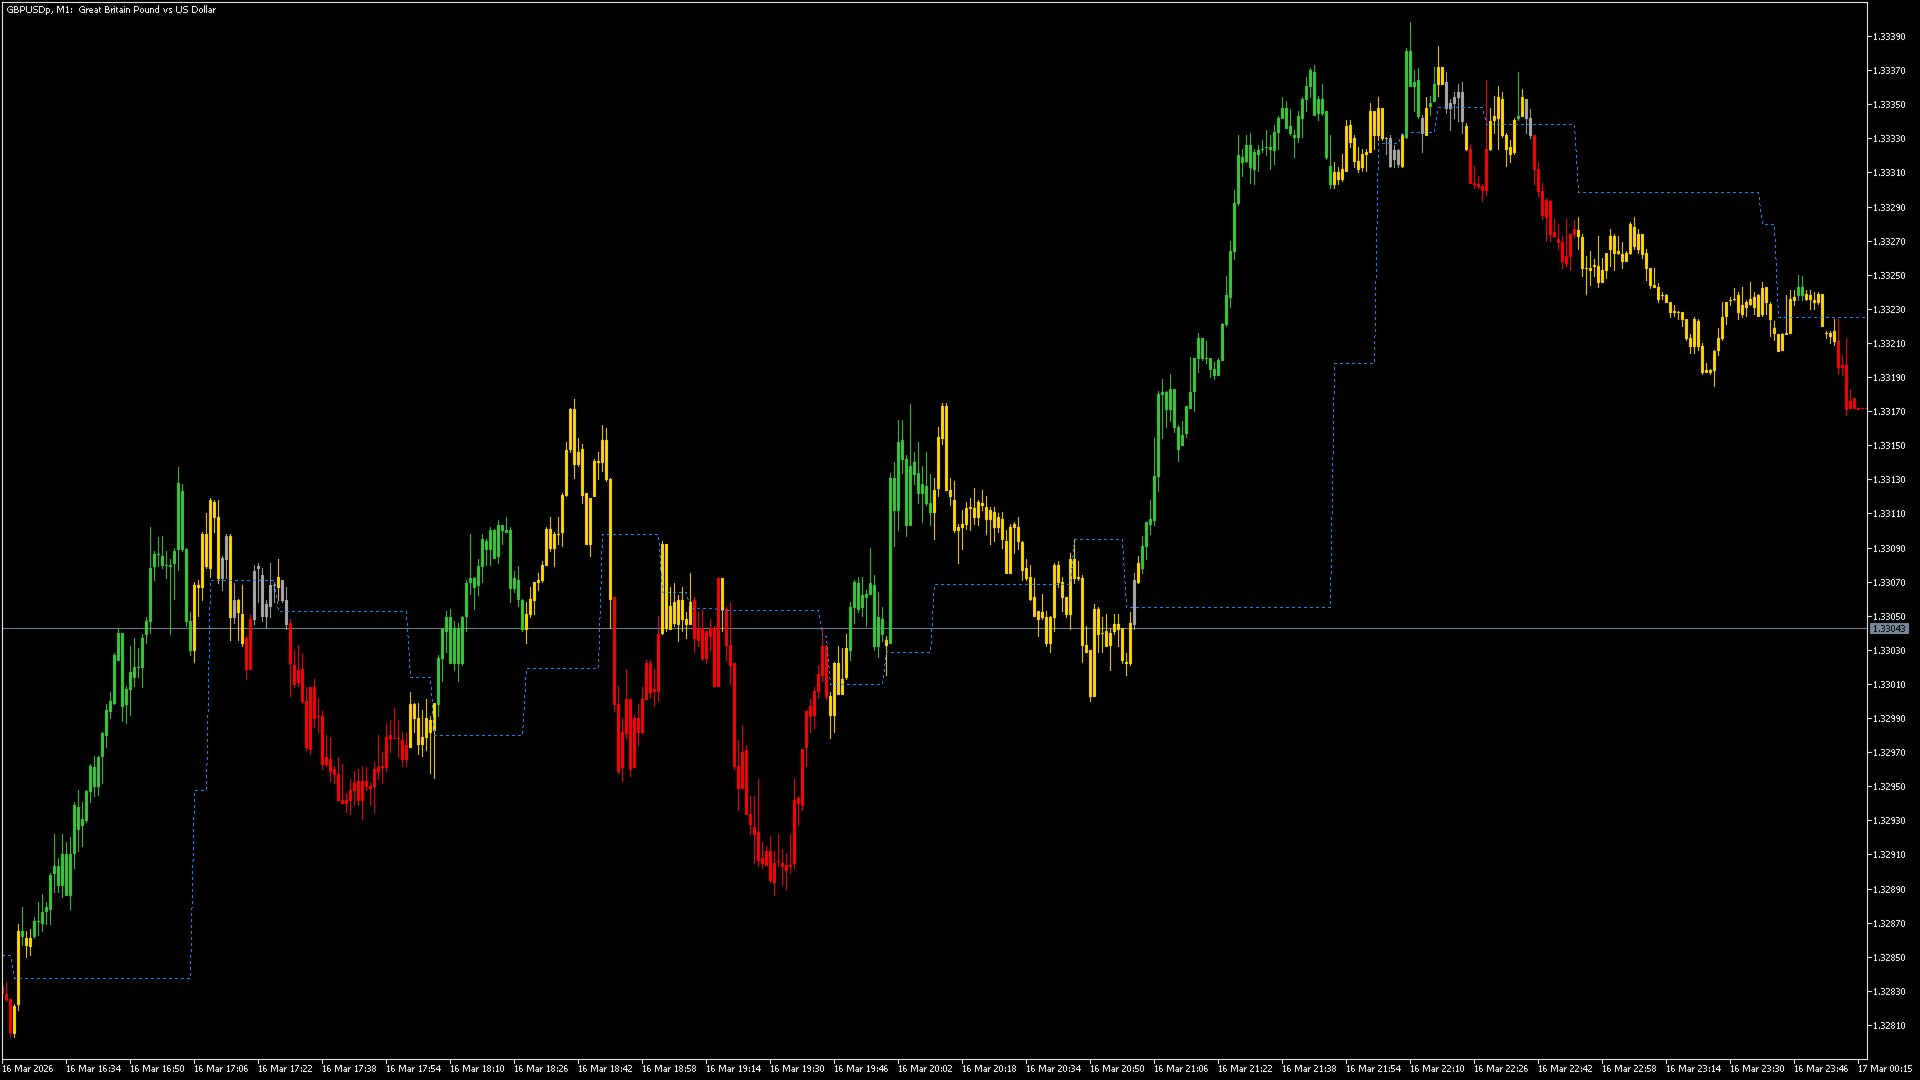
Show Minor Patterns (lighter colors) : Display light-colored breakouts (unconfirmed trends)
Show Major Patterns (darker colors) : Display dark-colored breakouts (retested/confirmed trends)
Show Friction Level Line : Display midpoint line of contraction zones
Contraction detected:
Top = 100
Btm = 90
Friction Line = (100 + 90) / 2 = 95
↑
Equilibrium point
The friction level line it's the balance point where bulls and bears are in equilibrium. Price "bounces" or "sticks" to this level like friction, hence the name friction line.
Expansion Threshold (as % of contraction range) : How close to boundaries triggers expansion phase
Real-world meaning:
Lower threshold (0.1-0.2 or 10-20%):
Effect: - Expansion phase triggers LATE (very close to breakout) - Most bars are grey (contraction) - Gold candles = imminent breakout
Higher threshold (0.4-0.5 or 40-50%):
Effect: - Expansion phase triggers EARLY - Many bars are gold - Early warning but less precise
Quick Setup Guide by Trading Style
Scalper (M5-M15):
Contraction Detection Lookback= 2
Show Minor Patterns (lighter colors) = true
Show Major Patterns (darker colors) = true
Show Friction Level Line = true
Expansion Threshold (as % of contraction range)= 0.4 (early warning)
Day Trader (M15-H1):
Contraction Detection Lookback= 3 (default)
Show Minor Patterns (lighter colors) = true
Show Major Patterns (darker colors) = true
Show Friction Level Line = true
Expansion Threshold (as % of contraction range)= 0.3 (balanced)
Swing Trader (H4-D1):
Contraction Detection Lookback = 4
Show Minor Patterns (lighter colors) = false (only major)
Show Major Patterns (darker colors) = true
Show Friction Level Line = true
Expansion Threshold (as % of contraction range)= 0.2 (precision)
Position Trader (D1-W1):
Contraction Detection Lookback= 5
Show Minor Patterns (lighter colors) = false
Show Major Patterns (darker colors) = true
Show Friction Level Line = true
Expansion Threshold (as % of contraction range)= 0.2