Quantum MA Grid MT5
- Indicatori
- Versione: 2.0
- Attivazioni: 10
# Multi-Timeframe Moving Average Grid Indicator
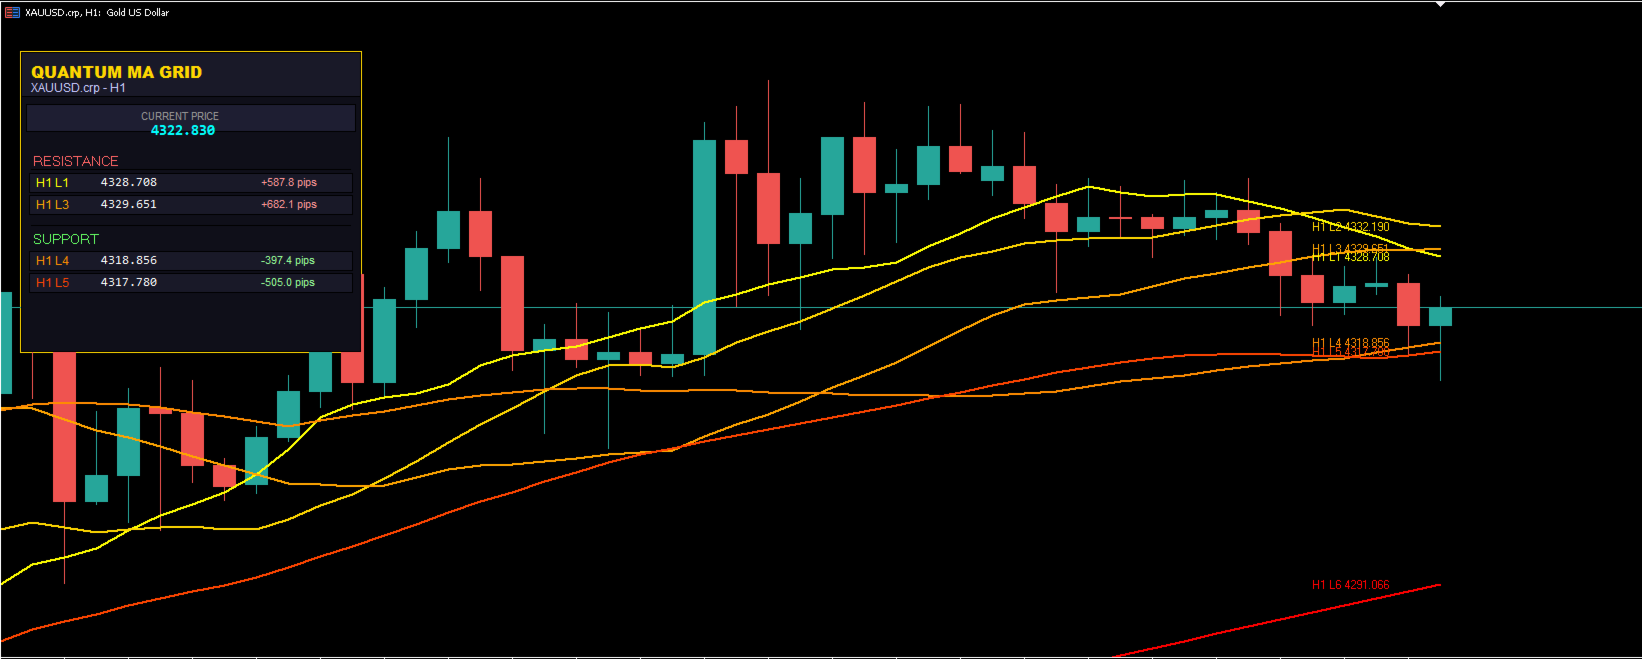
## Product Overview This indicator displays multiple moving average lines across different timeframes on a single chart. It includes a dashboard that shows the nearest support and resistance levels based on the moving averages.
The indicator is designed to help traders analyze price action relative to moving averages from multiple timeframes simultaneously.
does the same job as Money Map Grid
--- ## Key Features
### Multi-Timeframe Display - Displays up to 7 moving average lines with Fibonacci-based periods (13, 21, 34, 55, 89, 144, 233)
- Supports 9 timeframes: M1, M5, M15, M30, H1, H4, D1, W1, MN1
- Lines are rendered as smooth curves following price action
- Color-coded gradient system for easy visual identification
### Dashboard
- Shows current price
- Displays nearest support and resistance levels
- Calculates distance to each level in pips
- Combines levels from all enabled timeframes
- Color-coded by timeframe for clarity
### Customization Options
- 4 MA calculation methods: SMA, EMA, SMMA, LWMA
- Individual color control for each MA line
- Separate colors for each timeframe
- Adjustable line width and style
- Configurable dashboard position
- Toggle labels, prices, and dashboard independently
### Additional Timeframe Display
- Show higher timeframe MAs on lower timeframe charts
- Configurable minimum line setting
- Dotted line style for additional timeframes
- Useful for multi-timeframe analysis
--- ## Trading Applications The indicator can be used for various trading approaches:
### Trend Following Traders may use MA levels as potential support or resistance areas.
When price approaches a moving average, it may react to that level.
### Crossover Analysis The indicator allows observation of fast and slow MA crossovers, which some traders use as potential entry signals.
### Breakout Trading Price consolidation between MA levels can be monitored. Breakouts from these areas may indicate potential trading opportunities.
### Scalping The dashboard shows exact pip distances to nearby levels, which can be useful for short-term trading decisions.
### Reversal Trading Major MA levels (L6, L7) may act as significant support or resistance after extended price moves.
--- ## Visual Features
### Color System
- L1 (13): Yellow - L2 (21): Gold - L3 (34): Orange - L4 (55): Dark Orange - L5 (89): Orange Red - L6 (144): Red - L7 (233): Dark Red
### Dashboard Elements
- Header showing symbol and active timeframe
- Current price display
- Resistance section showing levels above current price
- Support section showing levels below current price
- Distance display in pips
--- ## Technical Specifications **Indicator Type:** Chart Overlay **Buffers Used:** 8 **Compatible With:** All currency pairs, indices, commodities, cryptocurrencies **Timeframes:** M1, M5, M15, M30, H1, H4, D1, W1, MN1 **Resource Usage:** Optimized for low CPU usage **Alerts:** Optional level touch alerts (disabled by default)
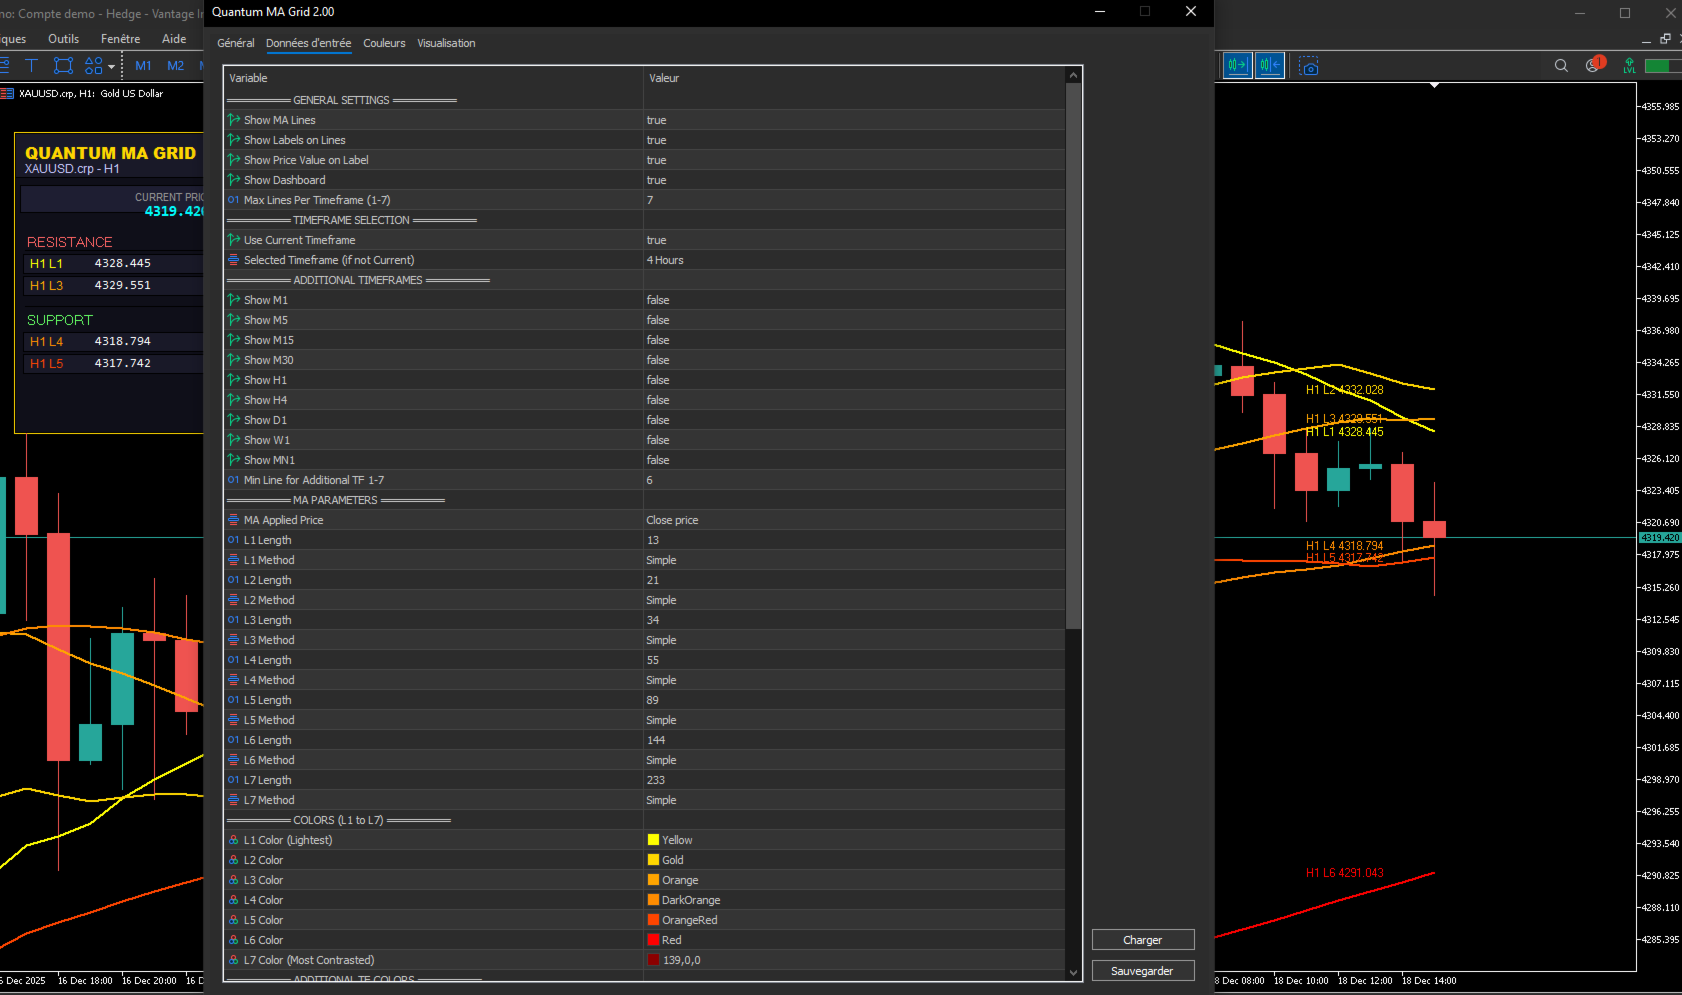
--- ## Input Parameters
### General Settings
- ShowMa: Enable or disable MA lines - ShowLabels: Show price labels on lines - ShowDashboard: Display dashboard - MaxLinesPerTF: Limit number of MA lines (1-7)
### Timeframe Selection
- UseCurrentTF: Use chart's current timeframe
- SelectedTF: Choose specific timeframe
- Show_M1 through Show_MN1: Enable additional timeframes
- MinLineForAdditionalTF: Minimum line for additional timeframes
### MA Parameters - L1_Length through L7_Length: MA periods - L1_Method through L7_Method: Calculation method (0=SMA, 1=EMA, 2=SMMA, 3=LWMA) - ma_applied_price: Price type (1=Close, 2=Open, 3=High, 4=Low)
### Colors - L1_Color through L7_Color: Individual MA line colors - M1_Color through MN1_Color: Additional timeframe colors
### Dashboard Settings - DashboardX, DashboardY: Position on chart - NearestLevelsCount: Number of levels to show (1-3)
### Alert Settings - EnableAlerts: Enable level touch alerts (default: false) - AlertOnScreen: Show alert popup - AlertSound: Play sound on alert - AlertEmail: Send email notification - AlertPush: Send push notification - AlertSoundFile: Sound file name - AlertSensitivity: Alert trigger distance in pips
--- ## Usage Recommendations
1. Start with the current timeframe only before adding additional timeframes
2. The default Fibonacci periods are commonly used in technical analysis
3. EMA method provides faster reaction to price changes compared to SMA
4. The dashboard automatically identifies the nearest levels
5. Multiple timeframe analysis can provide additional context
6. Color coding helps quickly assess price position relative to MAs
--- ## Suitable For - Day traders analyzing intraday support and resistance - Swing traders using multi-timeframe trend analysis - Scalpers requiring precise pip distance information - Position traders following major MA levels - Traders who analyze multiple timeframes - Both beginner and experienced traders
## Comparison with Standard MA Indicators | Feature | Standard MA | This Indicator | |---------|-------------|----------------| | Multiple Timeframes | No | Yes (9 timeframes) | | Dashboard | No | Yes | | Distance Calculation | No | Yes (in pips) | | Fibonacci Defaults | No | Yes | | Visual Gradient | No | Yes | | Curved Line Rendering | No | Yes | | Level Sorting | No | Yes (by distance) | | Alert System | Limited | Comprehensive |
--- ## Risk Disclaimer Trading financial instruments involves substantial risk of loss. This indicator is a technical analysis tool and does not provide trading signals or recommendations. It displays moving average data for informational purposes only. Users should: - Understand that past performance does not indicate future results - Use proper risk management techniques - Apply appropriate position sizing - Set stop losses on all trades - Not rely solely on any single indicator for trading decisions - Test the indicator on a demo account before live trading The author is not responsible for any trading losses incurred while using this indicator.
--- ## Support and Updates - Author: HIADSI - Version: 2.0 - Updates: Regular improvements and bug fixes - Support: Available through MQL5 messaging system --- ## Installation 1. Download the indicator file 2. Copy to MetaTrader 4 Indicators folder 3. Restart MetaTrader 4 4. Attach to chart 5. Configure parameters as needed
--- ## What is Included - Indicator file (.ex4 format) - This user guide --- **Copyright 2025 HIADSI. All rights reserved.**
**Note:** This indicator is provided as-is without warranty of any kind. Users are responsible for their own trading decisions.