Structure Plotter
- Indicatori
- Versione: 1.0

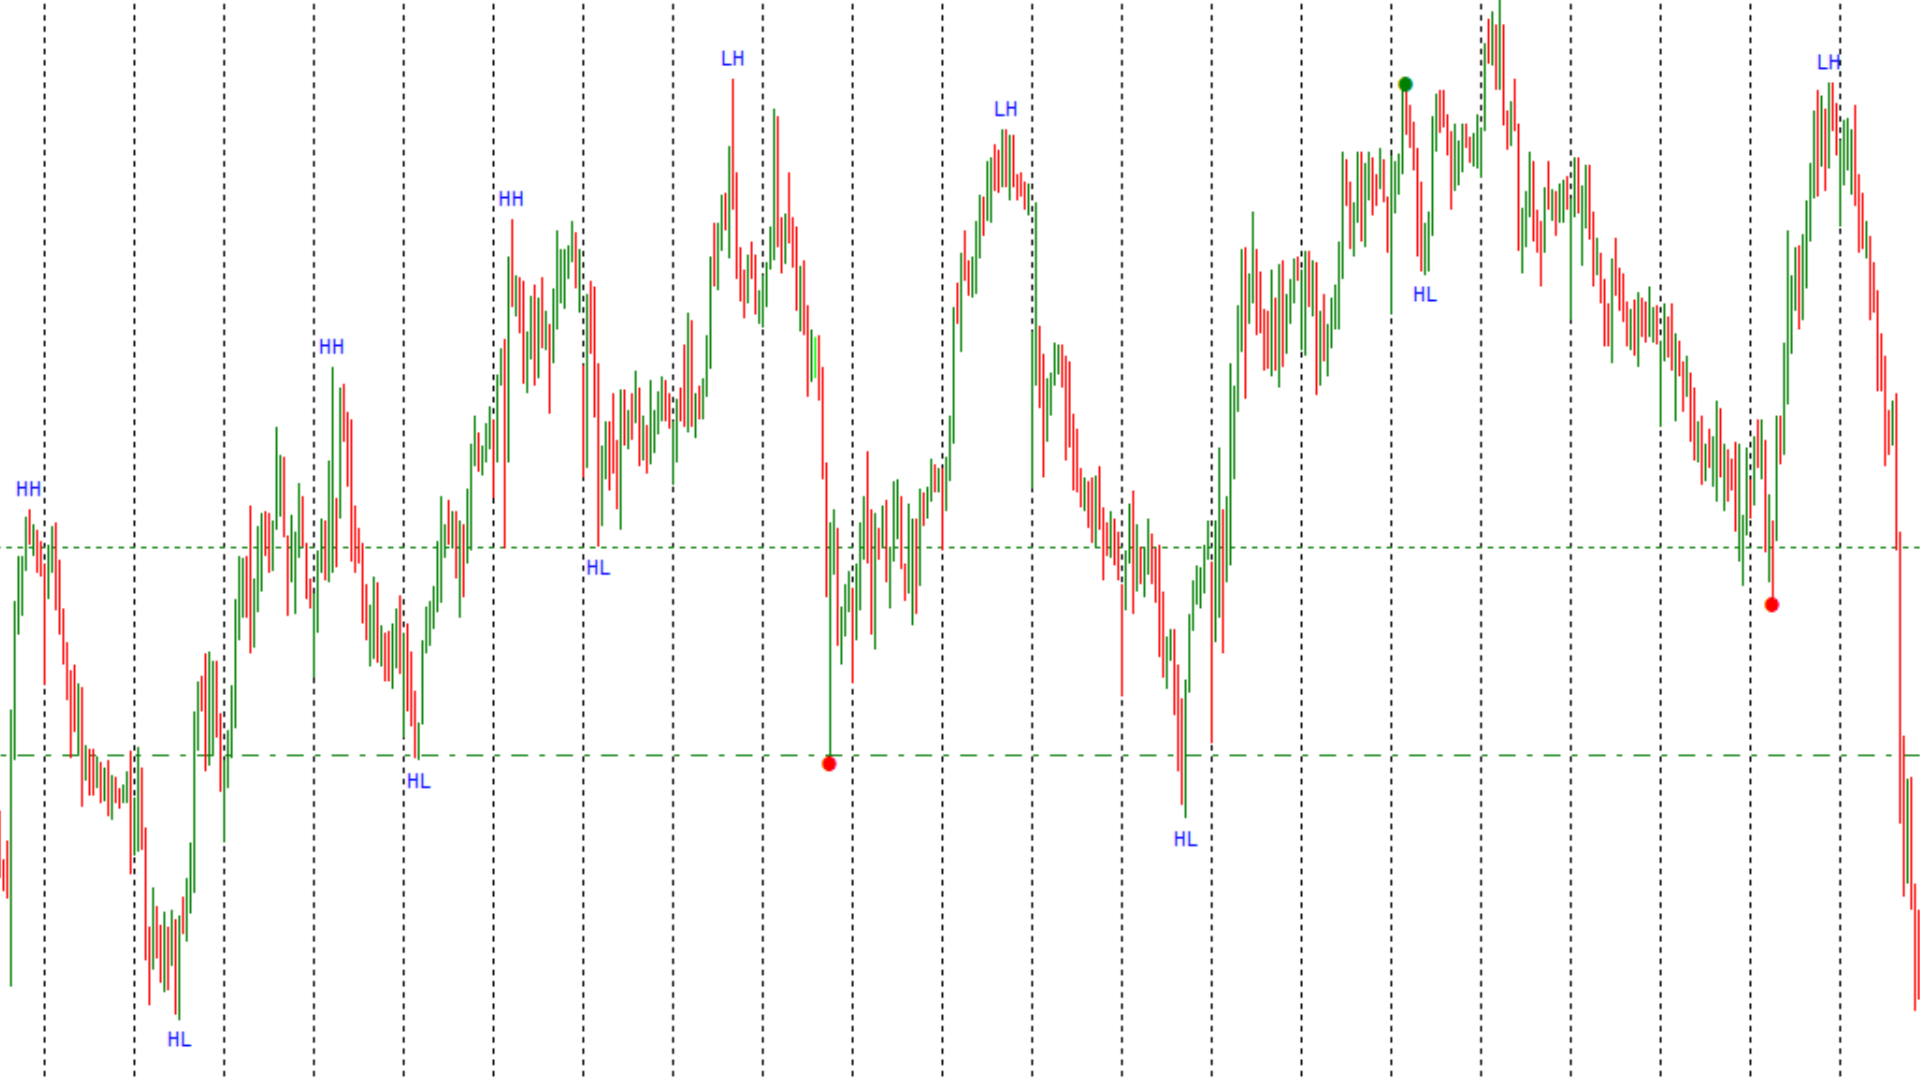
This indicator is designed to automate the process of identifying and visualizing market structure, a cornerstone of price action and Smart Money Concepts (SMC) trading. It intelligently maps the flow of the market by plotting Higher Highs (HH), Higher Lows (HL), Lower Highs (LH), and Lower Lows (LL) directly on your chart.
How It Works
The indicator's logic is based on detecting pivot swing points using a configurable number of bars to the left and right of a candle. It then uses these pivots to build a complete picture of the trend. Unlike basic zigzag tools, this indicator understands the context of the market:
-
Trend Continuation: It identifies when a trend is maintained by creating a new HH in an uptrend or a new LL in a downtrend.
-
Change of Character (CHoCH): It detects the earliest signs of a potential trend reversal by looking for a break of the last HL or LH. To ensure reliability and reduce false signals from "stop hunts," a CHoCH is only confirmed after a candle body closes beyond the structure point.
Key Features
-
Automatic Structure Mapping: Plots clear, color-coded labels for HH, HL, LH, and LL.
-
Visual Zigzag: Draws trend lines between structure points, providing an instant and clear visual of the current market flow.
-
High-Confidence Reversal Signals: Uses candle-close confirmation for CHoCH detection, giving you more reliable signals.
-
Intelligent Pivot Logic: The algorithm ensures that every swing point is a confirmed pivot, preventing it from skipping over price action and drawing inaccurate lines.
-
Customizable Alerts: Receive terminal alerts for every confirmed CHoCH, so you never miss a potential shift in the market.
-
Clean Visuals: All labels are automatically offset from the price to avoid overlapping with candle wicks, keeping your chart clean and readable.
Every "coffee" you buy here is literally helping to power my late-night creative sessions: https://buymeacoffee.com/vercel