MTF ATR

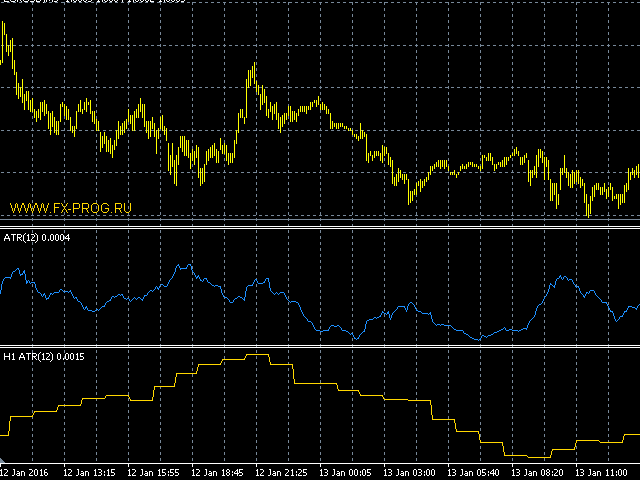
The indicator displays the data of the Average True Range (ATR) from a higher timeframe on the chart. It allows you to see the scope of the movement without having to switch to another screen terminal


The indicator parameters

  • TimeFrame - time frame of the data (drop-down list) can not be lower than current
  • AtrPeriod - period of the Average True Range indicator a higher timeframe range
Prodotti consigliati
Alpha Trend sign has been a very popular trading tool in our company for a long time. It can verify our trading system and clearly indicate trading signals, and the signals will not drift. Main functions: Based on the market display of active areas, indicators can be used to intuitively determine whether the current market trend belongs to a trend market or a volatile market. And enter the market according to the indicator arrows, with green arrows indicating buy and red arrows indicating se
How TrendMaster Works TrendMaster is a trading indicator designed to streamline and enhance your chart analysis. Using algorithmic logic, it reviews historical price data to generate a dynamic reference line. When price action crosses this line, a "BUY" or "SELL" signal is displayed on your chart. The goal is to assist in identifying potential shifts in price behavior with a clear and user-friendly visual approach. Why Use TrendMaster? The TrendMaster MT4 Indicator helps highlight potential tre
Infinity Trend Pro
Yaroslav Varankin
1 (1)
This is a trend indicator without redrawing Developed instead of the binary options strategy (by the color of the Martingale candlestick) Also works well in forex trading When to open trades (binary options) A signal will appear in the place with a candle signaling the current candle It is recommended to open a deal for one candle of the current timeframe M1 and M5 When a blue dot appears, open a deal up When a red dot appears, open a trade down. How to open trades on Forex. When a signal is rec
Trend PA
Mikhail Nazarenko
5 (3)
The Trend PA indicator uses   Price Action   and its own filtering algorithm to determine the trend. This approach helps to accurately determine entry points and the current trend on any timeframe. The indicator uses its own algorithm for analyzing price changes and Price Action. Which gives you the advantage of recognizing, without delay, a new nascent trend with fewer false positives. Trend filtering conditions can be selected in the settings individually for your trading style. The indicator
Spread and Close MT4
Alexander Denisovich Jegorov
Spread & Candle Close Timer Indicator for MT4  Optimize your trading with this lightweight and efficient indicator, designed to display the real-time spread and candle close countdown directly on your MT4 chart. Features: Live Spread Monitoring – Instantly see market conditions. Candle Close Timer – Stay prepared for the next price movement. Simple & Non-Intrusive Design – No unnecessary settings, just clear and accurate data. Ideal for scalpers, day traders, and those who need real-time exec
Price reach indicator. It also serves as the perfect term for supports and resistance. I use it in two experts. The basic tool for professional trading. The indicator analyzes the last 500 bar and uses this to determine the levels ( but it doesn't predict the future ) . Personally, I use it on TF H1.  It is very simple. Four lines on chart and that's all. Only two input parameters.  Thousands of indicators. Why this? Is good ? No! Is very good. Please test the indicator prior to purchasing.
"Adjustable Fractals" - è una versione avanzata dell'indicatore frattale, uno strumento di trading molto utile! - Come sappiamo, l'indicatore mt4 Standard fractals non ha impostazioni, il che è molto scomodo per i trader. - Adjustable Fractals ha risolto questo problema, ha tutte le impostazioni necessarie: - Periodo regolabile dell'indicatore (valori consigliati: superiori a 7). - Distanza regolabile dai massimi/minimi del prezzo. - Design regolabile delle frecce frattali. - L'indicatore è do
AW Heiken Ashi
AW Trading Software Limited
AW Heiken Ashi — Indicatore intelligente di trend e livelli di TP. Indicatore avanzato basato sul classico Heiken Ashi, adattato ai trader, con maggiore flessibilità e chiarezza. A differenza dell'indicatore standard, AW Heiken Ashi aiuta ad analizzare il trend, a determinare gli obiettivi di profitto e a filtrare i falsi segnali, fornendo decisioni di trading più affidabili. Guida all'installazione e istruzioni - Qui / Versione MT5 - Qui Vantaggi di AW Heiken Ashi: Funziona su qualsiasi risorsa
NostradamusMT4
Andrey Spiridonov
1 (1)
NostradamusMT4 is a powerful indicator from the set of professional trader. The indicator is based on Andrei Spiridonov's original price calculation method (ESTIMATED PRICE) for the current candle price. Advantages The indicator does not redraw. It works on any timeframes. Works with any trading instruments. Perfectly suitable for scalping and trading binary options. Parameters Color - color of the ESTIMATED PRICE FUTURE line. How to work with the indicator The indicator forms the ESTIMATED P
The indicator allows you to trade binary options. The recommended time frame is М1 and the expiration time is 1,2,3 minutes. The indicator suitable for auto and manual trading. A possible signal is specified as a arrows above/under a candle. You should wait until the candle closes! Arrows are not re-painted Trade sessions: TOKYO section (Half-end) Currency pairs: USD/JPY Working time frame: M1 Expiration time: 1,2,3 minutes. The indicator also shows good results when using the martingale strateg
FREE
Naturu MT4
Ivan Stefanov
“Naturu” è un indicatore manuale che utilizza la simmetria della natura come algoritmo. Conquista il mercato con una strategia semplice e saggezza nascosta! Quando carichi l’indicatore, vedrai due linee: Top e Bottom. Clicca una volta su una linea per attivarla. Per spostarla, basta cliccare sulla candela dove vuoi posizionarla. Definisci un punto alto e un punto basso, e l’indicatore calcola automaticamente: Una zona magenta che mostra dove gli interessi di tori e orsi sono più vicini, ossia l’
L'indicatore costruisce le quotazioni attuali, che possono essere confrontate con quelle storiche e su questa base fanno una previsione del movimento dei prezzi. L'indicatore ha un campo di testo per una rapida navigazione fino alla data desiderata. Opzioni: Simbolo - selezione del simbolo che visualizzerà l'indicatore; SymbolPeriod - selezione del periodo da cui l'indicatore prenderà i dati; IndicatorColor - colore dell'indicatore; HorisontalShift - spostamento delle virgolette disegnate d
The main idea of this indicator is rates analysis and prediction by Fourier transform. Indicator decomposes exchange rates into main harmonics and calculates their product in future. You may use the indicator as a standalone product, but for better prediction accuracy there is another related indicator - FreqoMaster - which uses FreqoMeterForecast as a backend engine and combines several instances of FreqoMeterForecast for different frequency bands. Parameters: iPeriod - number of bars in the ma
The BarsOldTimeFrame indicator is designed to analyze bar formation on a higher timeframe, projecting bars from it onto the current timeframe. The indicator draws higher timeframe bars on the current chart as rectangles with filled candlestick bodies and transparent shadows. The higher timeframe and fill colors for bullish and bearish bar bodies are selected in the settings.
Inrex Indicator
Inrexea Limited
4.36 (11)
InrexEA Indicator Professional Multi-Timeframe Market Analysis for MetaTrader 5 Overview InrexEA Indicator is a clean, professional chart overlay that combines 5 EMA trend lines , a real-time Market Dashboard ranking 8 symbols by daily strength, and a white background chart theme — all in one lightweight indicator. Stop switching between tools. See everything at a glance. Key Features 5 EMA Lines — Trend Analysis EMA 10 / 20 / 50 / 100 / 200 drawn on chart. Identify trend direction, dynamic
FX Flow
Eva Stella Conti
FX Flow   indicator can be used as an anticipator of the next trend, preferably confirmed by Price Action or another oscillator (RSi, Stochastic ..). It takes the money flows of the major currencies USD EUR GBP AUD NZD CAD CHF JPY into account, and processes them. Excellent tool for indices, but also for correlations between currencies. Works on each timeframes.  Blue line: Bull market Yellow line: Bear market Note : if the indicator opens the window, but does not draw lines, load the historie
Auto Fibo Pro m
DMITRII GRIDASOV
Indicatore "Auto FIBO Pro" Crypto_Forex: è un ottimo strumento ausiliario nel trading! - L'indicatore calcola e posiziona automaticamente sul grafico i livelli di Fibo e le linee di tendenza locali (colore rosso). - I livelli di Fibonacci indicano le aree chiave in cui il prezzo può invertirsi. - I livelli più importanti sono 23,6%, 38,2%, 50% e 61,8%. - Puoi usarlo per lo scalping di inversione o per il trading di zone grid. - Ci sono molte opportunità per migliorare il tuo sistema attuale us
Golden Gendut
Anthonius Soruh
5 (1)
Gendel Gendut is Binary Option Indicator From @realTatino Trade with expaired time Pairs : All Forex Pair Time Frame : M5 only Trade Time All Time Alert : Alert Message, Alert Email, Alerts Push Buffer : 4 Buffer (0,2 (Buy) || 1,3 (Sell) Broker Suitable : All Broker Binary With Forex Pair Auto Trade : Yes Repaint : NO Delay : NO Other Binary Indicator : https://www.mql5.com/en/market/product/70915 https://www.mql5.com/en/market/product/71054 https://www.mql5.com/en/market/product/57755 etc IND
Scalping Modulator
Andrey Kozak
5 (1)
Scalping Modulator is a scalping trading system. The indicator consists of several analytical modules. It automatically analyzes the market and shows the trader all the necessary information for trading. Scalping Modulator draws two trend lines on the chart. One line shows the long-term direction of the price, the second line shows the medium-term direction of the price. The indicator also draws red and blue dots on the chart. They indicate a likely change in price movement. In order to open a
Stepping Trend
Mpendulo Chiliza
The Stepping Trend Indicator     The Steppi ng Trend indicator uses the  average true range  (ATR indicator) in its calculation. This gives you control to set your own average true range period, I set the Default as 10.   Indicator Details. Green Arrow Up: This means you are at the starting point of a new bullish trend, it’s time to buy.   Red  Arrow  Down : This means you are at the starting point of a new  bearish  trend, it’ s time to sell .   What if you miss the Arrow Signal?   No prob
ReboltDelta
David Theodore Caro-greene
Rebalance Overlay Technology (Rebolt) enables the trader to visualize the flow of money from one chart to another chart. Rebolt Delta (ReboltDelta) indicates the probable price change that will occur in the target chart based on changes in the source chart. ReboltDelta is designed for use in cooperation with Rebolt Probability. La tecnología de superposición de reequilibrio (Rebolt) permite al operador visualizar el flujo de dinero de un gráfico a otro gráfico. Rebolt Delta (ReboltDelta) indica
VR Cub
Vladimir Pastushak
VR Cub è un indicatore per ottenere punti di ingresso di alta qualità. L'indicatore è stato sviluppato per facilitare i calcoli matematici e semplificare la ricerca dei punti di ingresso in una posizione. La strategia di trading per la quale è stato scritto l'indicatore ha dimostrato la sua efficacia per molti anni. La semplicità della strategia di trading è il suo grande vantaggio, che consente anche ai trader alle prime armi di commerciare con successo con essa. VR Cub calcola i punti di apert
ShvedSupDem Pro Zone
Andrey Shvedov
4.6 (5)
Let us analyze what supply and demand are, and how relevant the expression "market memory" is. The screenshots show the operation of the SupDem-Pro custom indicator, it is the improved version of my previously created Shved Supply and Demand indicator. In order to create it, I gave up trading for almost 3 years and studied a lot of literature, I have not traded during this time, but only analyzed the behavior of the price in different situations. It took me quite a long time to correctly formula
Trendiness Index
Libertas LLC
5 (3)
"The trend is your friend" is one of the best known sayings in investing, because capturing large trendy price movements can be extremely profitable. However, trading with the trend is often easier said than done, because many indicators are based on price reversals not trends. These aren't very effective at identifying trendy periods, or predicting whether trends will continue. We developed the Trendiness Index to help address this problem by indicating the strength and direction of price trend
FutureTrade
Andrey Spiridonov
3 (2)
FutureTrade is one of the few indicators that predicts the price right on the price chart. The indicator calculation algorithm is based on the fast Fourier transform. Given the oscillatory behavior of the price, the Fourier function predicts its future behavior. The indicator should be attached in the usual way to a chart with the trading instrument specified symbol and with the M15 timeframe. This timeframe is the most optimal for working with any symbols. Once started, the indicator calculates
Distinctive
Tatiana Savkevych
Distinctive is a forex trending arrow indicator for identifying potential entry points. I like it, first of all, because it has a simple mechanism of work, adaptation to all time periods and trading tactics. Created on the basis of a regression channel with filters. Plotting the Lawrence indicator signals on a price function chart using a mathematical approach. How it works - when the price breaks out in the overbought / oversold zone (channel levels), a buy or sell signal is generated. Everyt
Simple to read and powerful, no fancy lines and drawings to clutter your chart or distract you. The trend probability oscillator estimates how likely a trend will continue in a certain period. The cummulator period controls how many bars in the past to use and is a proxy for the timescale the trend probability should hold. The use of a Max Line improves this further by indicating when a trend is likely to reverse. In most cases a trend must lose momentum before reversing. Hence, a trend probabil
[ZhiBiCCI] indicators are suitable for all cycle use, and are also suitable for all market varieties. [ZhiBiCCI] Green solid line is a reversal of bullish divergence. The green dotted line is a classic bullish divergence. [ZhiBiCCI] The solid line to the red is a reverse bearish divergence. The red dotted line is a classical bearish divergence. [ZhiBiCCI] can be set in the parameters (Alert, Send mail, Send notification), set to (true) to send instant signals to the alarm window, email, insta
This indicator is another variant of the famous powerful indicator Fibonacci-SS https://www.mql5.com/en/market/product/10136 but has different behaviour in placing Pending Order and TP Line. Automatically places Fibonacci retracement lines from the last highest and lowest visible bars on the chart with: An auto Pending Order (Buy/Sell). Taking Profit 1, Taking Profit 2 is pivot point and Taking Profit 3 for extended reward opportunity. The best risk and reward ratio. Simple and powerful indicat
I make this indicator to help you for setting effective stoploss and getting more signals from following trends. This indicator helps to tell the trends and sideway, when 2 lines stand above of blue cloud, it means uptrend. When 2 lines stand above red cloud, it means down trend, the other else, it means sideway market. For taking order, you have to wait the arrows. You also need to see the cloud position, if the cloud's res, you have to wait the yellow arrow for selling order. If the cloud's bl
Gli utenti di questo prodotto hanno anche acquistato
Gann Made Easy
Oleg Rodin
4.83 (157)
Gann Made Easy è un sistema di trading Forex professionale e facile da usare che si basa sui migliori principi del trading utilizzando la teoria di mr. WD Gann. L'indicatore fornisce segnali ACQUISTA e VENDI accurati, inclusi i livelli di Stop Loss e Take Profit. Puoi fare trading anche in movimento utilizzando le notifiche PUSH. CONTATTAMI DOPO L'ACQUISTO PER RICEVERE GRATUITAMENTE LE ISTRUZIONI DI TRADING E OTTIMI INDICATORI EXTRA! Probabilmente hai già sentito parlare molte volte dei metodi d
Scalper Inside PRO
Alexey Minkov
4.74 (69)
An exclusive indicator that utilizes an innovative algorithm to swiftly and accurately determine the market trend. The indicator automatically calculates opening, closing, and profit levels, providing detailed trading statistics. With these features, you can choose the most appropriate trading instrument for the current market conditions. Additionally, you can easily integrate your own arrow indicators into Scalper Inside Pro to quickly evaluate their statistics and profitability. Scalper Inside
L'indicatore " Dynamic Scalper System " è progettato per il metodo di scalping, ovvero per il trading all'interno di onde di trend. Testato sulle principali coppie di valute e sull'oro, è compatibile con altri strumenti di trading. Fornisce segnali per l'apertura di posizioni a breve termine lungo il trend, con ulteriore supporto al movimento dei prezzi. Il principio dell'indicatore. Le frecce grandi determinano la direzione del trend. Un algoritmo per generare segnali per lo scalping sotto fo
M1 Sniper
Oleg Rodin
5 (20)
M1 SNIPER è un sistema di indicatori di trading facile da usare. Si tratta di un indicatore a freccia progettato per l'intervallo temporale M1. L'indicatore può essere utilizzato come sistema autonomo per lo scalping sull'intervallo temporale M1 e come parte del tuo sistema di trading esistente. Sebbene questo sistema di trading sia stato progettato specificamente per il trading sull'intervallo temporale M1, può comunque essere utilizzato anche con altri intervalli temporali. Inizialmente ho pro
Atomic Analyst
Issam Kassas
5 (4)
Innanzitutto, vale la pena sottolineare che questo indicatore di trading non è repaint, non è ridisegno e non presenta ritardi, il che lo rende ideale sia per il trading manuale che per quello automatico. Manuale utente: impostazioni, input e strategia. L'Analista Atomico è un indicatore di azione del prezzo PA che utilizza la forza e il momentum del prezzo per trovare un miglior vantaggio sul mercato. Dotato di filtri avanzati che aiutano a rimuovere rumori e segnali falsi, e aumentare il pote
Trend Lines PRO
Roman Podpora
5 (1)
LINEE DI TENDENZA PRO       Aiuta a capire dove il mercato sta realmente cambiando direzione. L'indicatore mostra reali inversioni di tendenza e punti in cui i principali attori rientrano. Vedi  Linee BOS   Cambiamenti di tendenza e livelli chiave su timeframe più ampi, senza impostazioni complesse o rumore inutile. I segnali non vengono ridisegnati e rimangono sul grafico dopo la chiusura della barra. VERSIONE MT 5     -      Svela il suo massimo potenziale se abbinato all'indicatore   RFI LEVE
Volatility Trend System - un sistema di trading che fornisce segnali per le voci. Il sistema di volatilità fornisce segnali lineari e puntuali nella direzione del trend, nonché segnali per uscirne, senza ridisegnare e ritardi. L'indicatore di tendenza monitora la direzione della tendenza a medio termine, mostra la direzione e il suo cambiamento. L'indicatore di segnale si basa sui cambiamenti della volatilità e mostra gli ingressi nel mercato. L'indicatore è dotato di diversi tipi di avvisi. Pu
Trend indicator AI
Ramil Minniakhmetov
4.49 (84)
Trend Ai indicator è un ottimo strumento che migliorerà l'analisi di mercato di un trader combinando l'identificazione della tendenza con punti di ingresso utilizzabili e avvisi di inversione. Questo indicatore consente agli utenti di navigare nelle complessità del mercato forex con fiducia e precisione Oltre ai segnali primari, l'indicatore Ai di tendenza identifica i punti di ingresso secondari che si presentano durante i pullback o i ritracciamenti, consentendo ai trader di capitalizzare le
Innanzitutto, vale la pena sottolineare che questo Strumento di Trading è un Indicatore Non-Ridipingente, Non-Ridisegnante e Non-Laggante, il che lo rende ideale per il trading professionale. Corso online, manuale utente e demo. L'Indicatore Smart Price Action Concepts è uno strumento molto potente sia per i nuovi che per i trader esperti. Racchiude più di 20 utili indicatori in uno solo, combinando idee di trading avanzate come l'Analisi del Trader del Circolo Interno e le Strategie di Trading
Un indicatore tecnico che struttura i grafici e identifica i movimenti ciclici dei prezzi. Può funzionare su qualsiasi grafico. Diversi tipi di notifiche. Ci sono altre frecce sul grafico stesso. Senza ridisegnare la storia, lavora sulla chiusura della candela. TF consigliati da M5 in su. Parametri facili da usare e configurare. Se si utilizzano 2 indicatori con parametri diversi, è possibile utilizzarli senza altri indicatori. Ha 2 parametri di input Ciclicità e durata del segnale Questi 2 pa
Auto Optimized Parabolic RSI: Motore di Momentum 3D Avanzato La maggior parte degli indicatori per trader privati fallisce perché si affida a parametri statici che smettono di funzionare nel momento in cui la volatilità del mercato cambia. Auto Optimized Parabolic RSI risolve il problema dell'"obsolescenza dell'indicatore" ricalcolando continuamente il proprio vantaggio matematico, portando un adattamento quantitativo di livello istituzionale direttamente sul tuo terminale MT5. Il Vantaggio Prin
Scalper Vault
Oleg Rodin
5 (36)
Scalper Vault è un sistema di scalping professionale che ti fornisce tutto il necessario per scalping di successo. Questo indicatore è un sistema di trading completo che può essere utilizzato dai trader di forex e opzioni binarie. L'intervallo di tempo consigliato è M5. Il sistema fornisce segnali di freccia accurati nella direzione della tendenza. Ti fornisce anche i segnali più alti e più bassi e i livelli di mercato di Gann. Gli indicatori forniscono tutti i tipi di avvisi, comprese le notifi
RFI levels PRO
Roman Podpora
5 (1)
L'indicatore mostra accuratamente i punti di inversione e le zone di ritorno dei prezzi in cui il       Principali attori   . Vedi dove si formano le nuove tendenze e prendi decisioni con la massima precisione, mantenendo il controllo su ogni operazione. VERSION MT5     -     Rivela il suo massimo potenziale se combinato con l'indicatore   TREND LINES PRO Cosa mostra l'indicatore: Strutture di inversione e livelli di inversione con attivazione all'inizio di un nuovo trend. Visualizzazione dei l
Currency Strength Exotics
Bernhard Schweigert
4.88 (33)
ATTUALMENTE SCONTATO DEL 20%! La soluzione migliore per qualsiasi principiante o trader esperto! Questo indicatore è specializzato nel mostrare la forza della valuta per qualsiasi simbolo come coppie esotiche, materie prime, indici o futures. È il primo nel suo genere, qualsiasi simbolo può essere aggiunto alla nona riga per mostrare la vera forza della valuta di Oro, Argento, Petrolio, DAX, US30, MXN, TRY, CNH ecc. Si tratta di uno strumento di trading unico, di alta qualità e conveniente pe
Dynamic Forex28 Navigator
Bernhard Schweigert
4.43 (7)
Dynamic Forex28 Navigator - Lo strumento di trading Forex di nuova generazione. ATTUALMENTE SCONTATO DEL 49%. Dynamic Forex28 Navigator è l'evoluzione dei nostri indicatori popolari di lunga data, che combinano la potenza di tre in uno: Advanced Currency Strength28 Indicator (695 recensioni) + Advanced Currency IMPULSE con ALERT (520 recensioni) + CS28 Combo Signals (Bonus). Dettagli sull'indicatore https://www.mql5.com/en/blogs/post/758844 Cosa offre l'indicatore di forza di nuova generazione?
Advanced Supply Demand
Bernhard Schweigert
4.91 (299)
Speciale Trading- SCONTO DEL 40% La soluzione migliore per qualsiasi trader principiante o esperto! Questo indicatore è uno strumento di trading unico, di alta qualità e conveniente, perché abbiamo incorporato una serie di funzionalità proprietarie e una nuova formula. Con questo aggiornamento, potrai visualizzare doppie zone di timeframe. Non solo potrai visualizzare un TF più alto, ma anche entrambi, il TF del grafico e il TF più alto: MOSTRA ZONE ANNIDATE. Tutti i trader che operano con Of
Se acquisti questo indicatore, riceverai il mio Trade Manager Professionale   + EA  GRATUITAMENTE. Innanzitutto è importante sottolineare che questo sistema di trading è un indicatore Non-Repainting, Non-Redrawing e Non-Lagging, il che lo rende ideale sia per il trading manuale che per quello automatico. Corso online, manuale e download di preset. Il "Sistema di Trading Smart Trend MT5" è una soluzione completa pensata sia per i trader principianti che per quelli esperti. Combina oltre 10 indic
Super Reversal Indicator with Alert Panoramica Super Reversal Indicator with Alert è uno strumento di trading multi timeframe progettato per identificare opportunità di inversione di mercato ad alta probabilità, utilizzando una combinazione di momentum stocastico, zone di domanda e offerta e segnali di rifiuto del prezzo. L’indicatore aiuta i trader a individuare potenziali punti di inversione grazie a segnali visivi chiari e avvisi in tempo reale. Caratteristiche principali Analisi stocastica m
The Super Arrow Indicator provides non-repainting buy and sell signals with exceptional accuracy. Key Features No repainting – confirmed signals remain fixed Clear visual arrows: green for buy, red for sell Real-time alerts via pop-up, sound, and optional email Clean chart view with no unnecessary clutter Works on all markets: Forex, gold, oil, indices, crypto Adjustable Parameters TimeFrame Default: "current time frame" Function: Sets the time frame for indicator calculation Options: Can be set
Currency Strength Wizard è un indicatore molto potente che ti fornisce una soluzione all-in-one per un trading di successo. L'indicatore calcola la potenza di questa o quella coppia forex utilizzando i dati di tutte le valute su più intervalli di tempo. Questi dati sono rappresentati in una forma di indice di valuta facile da usare e linee elettriche di valuta che puoi utilizzare per vedere il potere di questa o quella valuta. Tutto ciò di cui hai bisogno è collegare l'indicatore al grafico che
CRT Multi-Timeframe Market Structure & Liquidity Sweep Indicator Non-Repainting | Multi-Asset | MT5 Version Available MT5 Version:   https://www.mql5.com/en/market/product/162075 Full User Guide — explains what each feature does and why:   https://www.mql5.com/en/blogs/post/767525 Quick Start User Guide  — explains how to configure and in what order:  https://www.mql5.com/en/blogs/post/767540 Indicator Overview CRT Ghost Candle HTF Fractal is a complete institutional-grade market structure too
Scalping Entry Points - è un sistema di trading manuale che può adattarsi ai movimenti dei prezzi e dare segnali per aprire le negoziazioni senza ridisegnare. L'indicatore determina la direzione del trend dal livello centrale di supporto e resistenza. L'indicatore a punto fornisce segnali per entrate e uscite. Adatto per trading intraday manuale, scalping e opzioni binarie. Funziona su tutti i tempi e strumenti di trading. L'indicatore fornisce diversi tipi di avvisi. Come utilizzare il prodott
TPSpro RFI Levels
Roman Podpora
4.86 (28)
ISTRUZIONI RUS  /  ISTRUZIONI   ENG  /  Versione MT5 Funzioni principali: Visualizza le zone attive di venditori e acquirenti! L'indicatore mostra tutti i livelli/zone di primo impulso corretti per acquisti e vendite. Quando questi livelli/zone vengono attivati, ovvero dove inizia la ricerca dei punti di ingresso, i livelli cambiano colore e vengono riempiti con colori specifici. Vengono visualizzate anche delle frecce per una percezione più intuitiva della situazione. LOGIC AI - Visualizzazion
BTMM State Engine Pro is a MetaTrader 4 indicator for traders who use the Beat The Market Maker approach: Asian session context, kill zone timing, level progression, peak formation detection, and a multi-pair scanner from a single chart. It combines cycle state logic with a built-in scanner dashboard so you do not need the same tool on many charts at once. What it does Draws the Asian session range; session times can follow broker server offset or be set in inputs. Tracks level progression (L
Looking for a powerful yet lightweight swing detector that accurately identifies market structure turning points? Want clear, reliable buy and sell signals that work across any timeframe and any instrument? Buy Sell Arrow MT Swing is built exactly for that — precision swing detection made simple and effective. This indicator identifies Higher Highs (HH) , Higher Lows (HL) , Lower Highs (LH) , and Lower Lows (LL) with remarkable clarity. It is designed to help traders easily visualize market stru
Pips Generator
Oleg Rodin
4.6 (10)
Apollo Pips Generator è l'indicatore che fornisce segnali nella direzione del trend. L'indicatore fornisce più punti di ingresso in modo da poter sempre trovare un'opportunità di trading su cui trarre profitto. Presta attenzione agli screenshot. Gli screenshot mostrano lo strumento Pips Generator in combinazione con il mio altro strumento che è rappresentato dal canale con i segnali stellari che indicano i massimi e i minimi. Questa combinazione fornisce diversi modi per applicare il sistema. Do
Meravith
Ivan Stefanov
5 (3)
Strumento per market maker. Meravith: Analizzerà tutti i timeframe e mostrerà il trend attualmente in corso. Evidenzierà le zone di liquidità (equilibrio dei volumi) dove i volumi rialzisti e ribassisti sono uguali. Mostrerà tutti i livelli di liquidità dei diversi timeframe direttamente sul grafico. Genererà e presenterà un’analisi di mercato testuale a scopo di riferimento. Calcolerà obiettivi, livelli di supporto e punti di stop-loss in base al trend attuale. Calcolerà il rapporto rischio/ren
Attualmente 40% di sconto! La soluzione migliore per ogni principiante o trader esperto! Questo software per cruscotti funziona su 28 coppie di valute. Si basa su 2 dei nostri indicatori principali (Advanced Currency Strength 28 e Advanced Currency Impulse). Offre un'ottima panoramica dell'intero mercato Forex. Mostra i valori di forza delle valute avanzate, la velocità di movimento delle valute e i segnali per 28 coppie Forex in tutti i (9) timeframe. Immaginate come migliorerà il vostro tra
CyberZingFx Volume Plus
Afsal Meerankutty
4.94 (17)
Advanced version of CyberZingFx Volume Plus, the ultimate MT4 indicator for traders seeking highly accurate buy and sell signals. With an additional strategy and price action dot signals that enhances its effectiveness, this indicator offers a superior trading experience for professionals and beginners alike. The CyberZingFx Volume Plus Advanced version combines the power of volume analysis and historical price data with an additional strategy, resulting in even more precise and reliable signals
Matrix Arrow Indicator MT4
Juvenille Emperor Limited
5 (3)
Matrix Arrow Indicator MT4 è un trend unico 10 in 1 che segue un indicatore multi-timeframe al 100% non ridipinto che può essere utilizzato su tutti i simboli/strumenti: forex, materie prime, criptovalute, indici, azioni.  Matrix Arrow Indicator MT4 determinerà la tendenza attuale nelle sue fasi iniziali, raccogliendo informazioni e dati da un massimo di 10 indicatori standard, che sono: Indice di movimento direzionale medio (ADX) Indice del canale delle materie prime (CCI) Candele classiche He
Altri dall’autore
EA Locking Grid
Sergey Deev
5 (1)
Semiautomatic EA for trading based on the averaging and locking strategy. The trader sends signals for opening grids by using the buttons on the chart. The EA opens a market order, places a grid of limit orders in the same direction with lot multiplication according to specified parameters and a locking stop order in the opposite direction with the volume equal to the sum of all the previous ones. Once the price passes the specified breakeven level, the EA places a stop loss at the open price+sp
The indicator displays the data of the Stochastic oscillator from a higher timeframe on the chart. The main and signal lines are displayed in a separate window. The stepped response is not smoothed. The indicator is useful for practicing "manual" forex trading strategies, which use the data from several screens with different timeframes of a single symbol. The indicator uses the settings that are identical to the standard ones, and a drop-down list for selecting the timeframe. Indicator Paramet
The indicator displays the data of the candles from a higher timeframe on the chart. Only the candle body (by the open and close prices) is displayed. The candlesticks are colored depending on the difference between the open and close prices. After removing the indicator from the chart, the objects used by it are deleted automatically. Indicator Parameters TimeFrame - time frame (drop-down list) BearColor - bearish candle color (standard dialog) BullColor - bullish candle color (standard dialog
The indicator displays the data of a standard MACD indicator from a higher timeframe. The product features notifications of crossing the zero or signal line by the histogram. Parameters TimeFrame - indicator timeframe (dropdown list) MacdFast - fast line period MacdSlow - slow line period MacdSignal - signal line period MacdPrice - price type (dropdown list) AlertCrossZero - enable notifications of crossing the zero line AlertCrossSignal - enable notifications of crossing the signal line UseNot
The indicator displays the moving average of a higher timeframe on the chart. The indicator parameters TimeFrame - time frame of the moving average (drop-down list) MaPeriod - moving average period MaMethod - moving average method (drop-down list) MaShift - moving average shift MaPrice - moving average price (drop-down list)
MTF ADX
Sergey Deev
5 (1)
The indicator displays the data of the standard ADX indicator from a higher timeframe on the chart. Several indicators with different timeframe settings can be placed on a single chart. The indicator parameters TimeFrame - time frame of the data (drop-down list) can not be lower than current AdxPeriod - period of the indicator for a higher timeframe AdxPrice - prices for the calculation of the indicator data from a higher timeframe
MACD Divergence
Sergey Deev
2.5 (2)
The indicator detects divergence signals - the divergences between the price peaks and the MACD oscillator values. The signals are displayed as arrows in the additional window and are maintained by the messages in a pop-up window, e-mails and push-notifications. The conditions which formed the signal are displayed by lines on the chart and in the indicator window. Indicator Parameters MacdFast - fast MACD line period MacdSlow - slow MACD line period MacdSignal - MACD signal line period MacdPric
The indicator detects and displays М. Gartley's Butterfly pattern. The pattern is plotted by the extreme values of the ZigZag indicator (included in the resources, no need to install). After detecting the pattern, the indicator notifies of that by the pop-up window, a mobile notification and an email. The pattern and wave parameters are displayed on the screenshots. The default parameters are used for demonstration purposes only in order to increase the amount of detected patterns. Parameters z
The indicator displays the averaged value of the moving averages of the current and two higher timeframes with the same parameters on the chart. If the moving averages are located one above the other, the resulting one is painted in green, showing an uptrend, in the opposite direction - red color (downtrend), intertwined - yellow color (transitional state) The indicator parameters MaPeriod - moving average period MaMethod - moving average method (drop-down list) MaShift - moving average shift M
The indicator displays the price movement on the chart, which is smoothed by the root mean square function. The screenshot shows the moving average with period 20, the smoothed root mean square (red) and simple SMA (yellow). The indicator parameters MAPeriod - Moving average period MaPrice - applied price (drop down list, similar to the standard MovingAverage average) BarsCount - number of processed bars (reduces download time when attaching to the chart and using in programs).
SqrtDev
Sergey Deev
The indicator displays the standard price deviation from the root mean moving average line in the additional window. The screenshot displays the standard indicator (the lower one) and SqrtDev (the upper one). Parameters SqrtPeriod - root mean line and standard deviation period. SqrtPrice - applied price (drop-down list). BarsCount - amount of processed bars (reduces the download time when applying to a chart and using in programs).
The indicator detects and displays the 5-0 harmonic pattern on the chart according to the scheme provided in the screenshot. The pattern is plotted by the extreme values of the ZigZag indicator (included in the resources, does not require additional installation). After detecting the pattern, the indicator notifies of that by the pop-up window, a mobile notification and an email. The indicator highlights not only the complete figure, but also the time of its formation. During the formation the f
The indicator detects and displays the AB=CD harmonic pattern on the chart according to the scheme provided in the screenshot. The pattern is plotted by the extreme values of the ZigZag indicator (included in the resources, does not require additional installation). After detecting the pattern, the indicator notifies of that by the pop-up window, a mobile notification and an email. The indicator highlights not only the complete figure, but also the time of its formation. During the formation the
UniversalEA
Sergey Deev
3.4 (5)
The Expert Advisor allows you to build a trading system based on a custom indicator. It performs automated opening/closing of deals based on the signals of an indicator that places values ​​other than 0 and EMPTY_VALUE in the buffer. The EA polls the values ​​of the specified indicator buffers, opens/closes and accompanies trades according to the specified parameters. The Expert Advisor implements the following trade support functions: - installation for the transaction SL and TP; - calculation
The indicator detects and displays the White Swan and Black Swan harmonic pattern on the chart according to the scheme provided in the screenshot. The pattern is plotted by the extreme values of the ZigZag indicator (included in the resources, does not require additional installation). After detecting the pattern, the indicator notifies of that by the pop-up window, a mobile notification and an email. The indicator highlights not only the complete figure, but also the time of its formation. Duri
The indicator detects and displays Shark harmonic pattern (see the screenshot). The pattern is plotted by the extreme values of the ZigZag indicator (included in the resources, no need to install). After detecting the pattern, the indicator notifies of that by a pop-up window, a mobile notification and an email. The indicator highlights the process of the pattern formation and not just the complete pattern. In the former case, it is displayed in the contour triangles. After the pattern is comple
The indicator detects and displays 3 Drives harmonic pattern (see the screenshot). The pattern is plotted by the extreme values of the ZigZag indicator (included in the resources, no need to install). After detecting the pattern, the indicator notifies of that by a pop-up window, a mobile notification and an email. The indicator highlights the process of the pattern formation and not just the complete pattern. In the former case, it is displayed in the contour triangles. After the pattern is com
The indicator detects and displays Cypher harmonic pattern also known as Anti-Butterfly (see the screenshot). The pattern is plotted by the extreme values of the ZigZag indicator (included in the resources, no need to install). After detecting the pattern, the indicator notifies of that by a pop-up window, a mobile notification and an email. The indicator highlights the process of the pattern formation and not just the complete pattern. In the former case, it is displayed in the contour triangle
The indicator displays ZigZag lines from a higher timeframe (see the example in the screenshot). The red thin line is the current timeframe's ZigZag, while a thicker yellow line is the higher timeframe's one. The indicator is repainted as the data is updated. Parameters Depth, Dev, Back - ZigZag parameters; BarsCount - amount of processed bars (reduces the initial download time and decreases the load when using in an EA); TimeFrame - indicator timeframe (cannot be lower than the current one).
RenkoMaSignals
Sergey Deev
1 (2)
The indicator displays Renko bars on the chart, plots two moving averages by them and generates buy/sell signals based on the conditions displayed in the screenshots and described below: the buy signal is formed if the fast moving average is above the slow moving average, from 4 to 10 consecutive bullish Renko bars are displayed, followed by no more than 2 bearish and one bullish Renko bars; the sell signal is formed if the fast moving average is below the slow moving average, from 4 to 10 conse
RenkoMacdSignals
Sergey Deev
1 (1)
The indicator displays renko bars on a chart, use them to plot MACD histogram and provides buy/sell signals: signal of MACD histogram crossing its signal line; signal of MACD histogram crossing the line 0. Renko is a non-trivial price display method. Instead of displaying each bar within a time interval, only the bars where the price moved a certain number of points are shown. Renko bars do not depend on a time interval, therefore the indicator works on any timeframe without losing its efficienc
RenkoMaStoch
Sergey Deev
1 (1)
The indicator displays renko bars on a chart, uses them to plot the fast and slow moving average and Stochastic, as well as it provides buy/sell signals: a buy signal is generated when the fast moving is above the slow one, and the signal line of Stochastic crosses the lower level from bottom up; a sell signal is generated when the fast moving is below the slow one, and the signal line of Stochastic crosses the upper level from top to bottom; Renko is a non-trivial price display method. Instead
The indicator displays Renko bars on the chart and uses them to plot the ZigZag - trend lines connecting the local Lows and Highs of the price movement. Renko - specialized display of the price action, in which the graph is displayed not every bar of the time frame, but only under the condition that the price had passed more than the specified number of points. Renko bars are not bound to a time frame, so the indicator can work on any time frame with the same efficiency. This implementation of t
The indicator displays Renko bars on the chart, uses them to plot the ZigZag - trend lines connecting the local Lows and Highs of the price movement, and highlights them based on the Gartley patterns, showing the potential price reversal points. Renko - specialized display of the price action, in which the graph is displayed not every bar of the time frame, but only under the condition that the price had passed more than the specified number of points. Renko bars are not bound to a time frame, s
The indicator displays renko bars on a chart, uses them to plot the MACD oscillator and determines the divergence conditions (divergences of price movements and oscillator values). The buy/sell signal is formed if the next High/Low price is not confirmed by the oscillator values. The ZigZag indicator is used to evaluate the extremums. Only the last 3 peaks are taken into account (see the screenshot). If peak 1 is higher than peak 2 or peak 3, and at the same time the macd value is lower, then a
The indicator displays renko bars on a chart and uses them to create ZigZag indicator - trend lines connecting local price movement Highs and Lows. The indicator, in turn, is used to create AB=CD displaying potential price reversal points. Renko is a non-trivial price display method. Instead of displaying each bar within a time interval, only the bars where the price moved a certain number of points are shown. Renko bars do not depend on a time interval, therefore the indicator works on any time
The indicator calculates and displays renko bars using MA and PSAR data as well as provides buy/sell signals. Renko is a non-trivial price display method. Instead of displaying each bar within a time interval, only the bars where the price moved a certain number of points are shown. Renko bars do not depend on a time interval, therefore the indicator works on any timeframe without losing its efficiency. Buy signal forms when PSAR readings are moving down, MA is moving up, the price is closing ab
The indicator displays Renko bars on the chart, uses their data to calculate and display the moving average, PriceChannel and generates buy/sell signals. Renko is a non-trivial price display method. Instead of displaying each bar within a time interval, only the bars where the price moved a certain number of points are shown. Renko bars do not depend on a time interval, therefore the indicator works on any timeframe without losing its efficiency. The PriceChannel indicator displays the upper, lo
The indicator displays Renko bars on the chart, uses their data to calculate and display the Bollinger Bands, MACD oscillator and generates buy/sell signals. Renko is a non-trivial price display method, in which a bar within a time interval is shown on the chart only if the price has moved a certain number of points. Renko bars do not depend on a time interval, therefore the indicator works on any timeframe without losing its efficiency. When attached to a chart, the indicator checks for presenc
The indicator displays Renko bars on the chart, plots a channel based on that data and generates buy/sell signals. Renko is a non-trivial price display method, in which a bar within a time interval is shown on the chart only if the price has moved a certain number of points. Renko bars do not depend on a time interval, therefore the indicator works on any timeframe without losing its efficiency. The channel is defined as the upper and lower boundaries of the price movement over the specified per
Filtro:
sunnychow
9045
sunnychow 2018.12.16 14:50 
 

L'utente non ha lasciato alcun commento sulla valutazione.

Maksym Mudrakov
30050
Maksym Mudrakov 2016.08.31 17:29 
 

L'utente non ha lasciato alcun commento sulla valutazione.

Rispondi alla recensione