Simple imbalance indicator

Squilibri nel Trading: Fondamenti e Strategie

Uno squilibrio nel trading è un fenomeno in cui si osserva una disparità tra domanda e offerta nel mercato. Questo può manifestarsi come un eccesso di ordini di acquisto (squilibrio rialzista) o di vendita (squilibrio ribassista), portando a una determinazione dei prezzi inefficiente e creando opportunità per i trader.

Aspetti Tecnici

  • "Modello a Candele": uno squilibrio è spesso rappresentato da un modello a tre candele, dove la seconda candela è più lunga delle altre e determina la direzione del movimento.

  • "Ombre delle Candele": il criterio principale per uno squilibrio è la non sovrapposizione delle ombre della prima e della terza candela.

Come Fare Trading con gli Squilibri

Strategia di Base

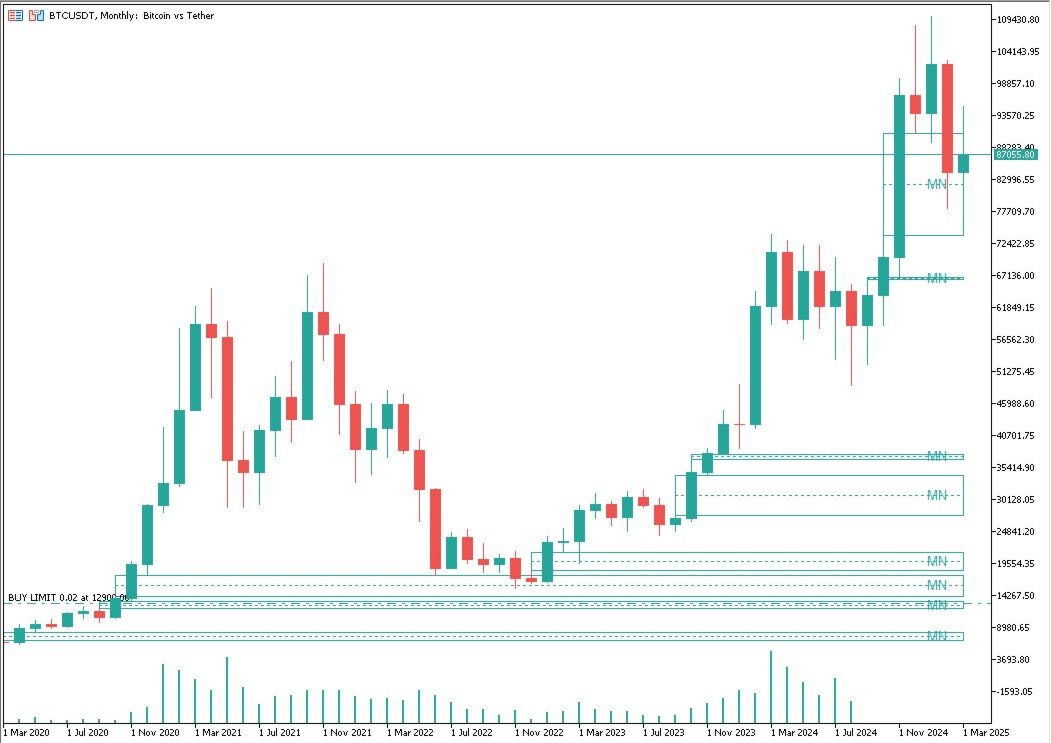
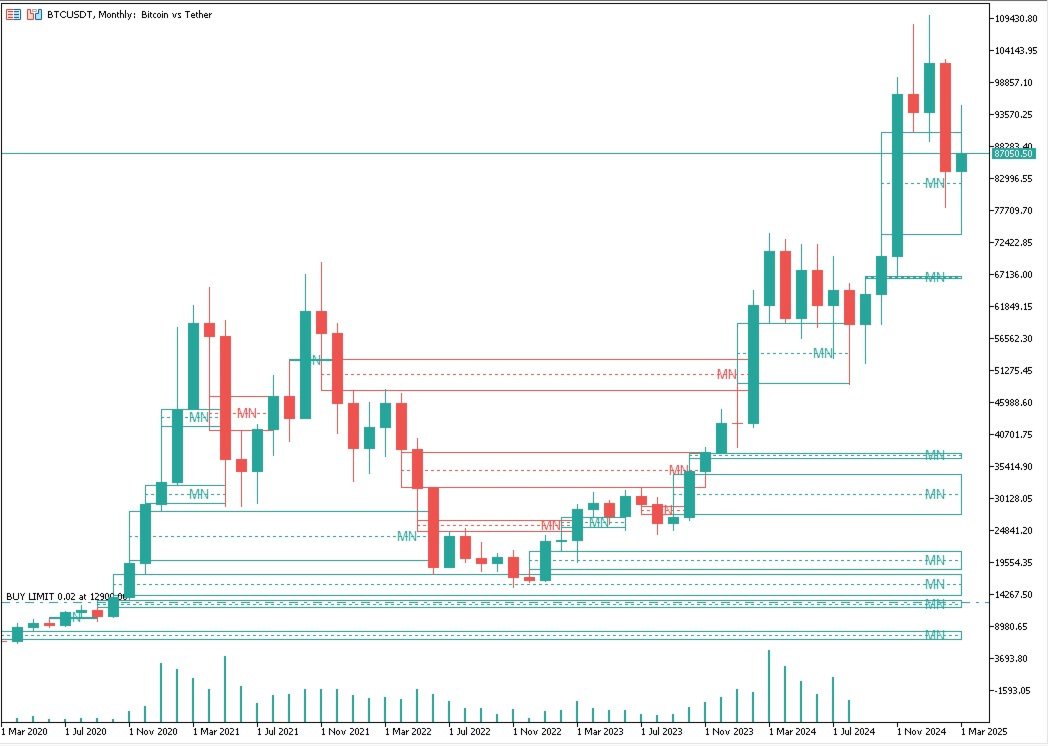
  1. "Identificazione dello Squilibrio": cercare zone in cui il prezzo è cambiato bruscamente senza un volume di scambi sufficiente.

  2. "Punti di Ingresso": entrare nelle operazioni dopo una parziale o completa sovrapposizione dello squilibrio, utilizzando ordini limite.

  3. "Gestione del Rischio": posizionare gli stop-loss al di fuori della zona di squilibrio e fissare i profitti a 1,5–2 volte la dimensione dello squilibrio.

Esempi di Strategie

  1. "Riempimento Parziale o Completo dello Squilibrio": i trader aspettano che il prezzo riempia parzialmente o completamente la zona di squilibrio e aprono operazioni nella direzione opposta del movimento.

    • Nel caso di un riempimento completo dello squilibrio, è importante che lo squilibrio venga riempito completamente solo dall'ombra della candela. Se il riempimento avviene con il corpo della candela (la candela si chiude dietro lo squilibrio, lo attraversa), allora in nessun caso si deve aprire un'operazione nella direzione opposta.

  2. "Utilizzo dei Blocchi di Ordini": l'analisi dei blocchi di ordini aiuta a determinare i punti di ingresso e di uscita dalle operazioni nelle zone di squilibrio.

Raccomandazioni

  • "Utilizzo di Ordini Limite": per minimizzare i rischi e entrare con precisione nelle operazioni.

  • "Monitoraggio delle Notizie": gli eventi economici possono influenzare l'insorgenza di squilibri.

  • "Testare le Strategie": verificare regolarmente l'efficacia delle strategie sui dati storici.

Timeframe per il Trading con gli Squilibri

Per il trading con gli squilibri, i timeframe più adatti sono quelli che consentono di vedere chiaramente la struttura del mercato e individuare le zone di squilibrio tra domanda e offerta.

Timeframe Raccomandati

  • "Orario (H1)": questo timeframe consente di vedere i trend a breve termine e gli squilibri, che possono essere utili per il trading intraday. Offre un buon equilibrio tra dettaglio e rumore del mercato.

  • "A Quattro Ore (H4)": adatto per il trading a medio termine, consente di vedere meglio la struttura del mercato e gli squilibri più grandi. È una buona opzione per lo swing trading.

  • "Giornaliero (D1)": utilizzato per l'analisi a lungo termine e l'individuazione di ampie zone di squilibrio. Adatto per il trading di posizione e consente di minimizzare il rumore del mercato.

Perché questi Timeframe?

  • "Orario (H1)": consente di reagire rapidamente ai cambiamenti del mercato e individuare gli squilibri a breve termine.

  • "A Quattro Ore (H4)": fornisce un'analisi più dettagliata della struttura del mercato e consente di pianificare meglio le operazioni a medio termine.

  • "Giornaliero (D1)": offre una visione chiara dei trend a lungo termine e delle ampie zone di squilibrio, il che è importante per il trading di posizione.

Vantaggi dell'Utilizzo di Questi Timeframe

  • "Riduzione del Rumore": i timeframe più elevati, come H4 e D1, consentono di minimizzare il rumore del mercato e concentrarsi sui trend principali e sugli squilibri.

  • "Miglioramento della Precisione": i timeframe più estesi forniscono segnali più affidabili e consentono di pianificare meglio le operazioni.

  • "Gestione del Rischio": l'utilizzo di timeframe più elevati aiuta a impostare stop-loss più precisi e a gestire i rischi in modo più efficace.

Errori da Evitare nel Trading con gli Squilibri

Nel trading con gli squilibri, i trader spesso commettono diversi errori che possono portare a perdite. Ecco alcuni degli errori più comuni da evitare:

Errori nel Trading con gli Squilibri

  1. Mancanza di considerazione della struttura generale del mercato:

    • "Errore": fare trading con gli squilibri senza tener conto della struttura generale del mercato e di altri strumenti di analisi.

    • "Soluzione": utilizzare gli squilibri in combinazione con altri indicatori tecnici e strumenti, come i blocchi di ordini e i livelli di Fibonacci.

  2. Definizione errata dello squilibrio:

    • "Errore": definire in modo errato i limiti dello squilibrio, soprattutto in presenza di una inside bar.

    • "Soluzione": segnare lo squilibrio dai limiti della candela più grande in presenza di una inside bar.

  3. Entrare in un'operazione senza conferma:

    • "Errore": entrare in un'operazione senza la conferma da altri indicatori tecnici o segnali di mercato.

    • "Soluzione": aspettare la conferma da altri strumenti, come i blocchi di ordini o le zone di supporto/resistenza.

  4. Gestione del rischio errata:

    • "Errore": impostare gli stop-loss all'interno della zona di squilibrio o troppo vicino al prezzo di ingresso.

    • "Soluzione": impostare gli stop-loss al di fuori della zona di squilibrio o dei livelli chiave.

  5. Mediare le posizioni in perdita:

    • "Errore": tentare di mediare le perdite aggiungendo alla posizione.

    • "Soluzione": evitare di mediare le posizioni in perdita e chiuderle in tempo.

  6. Fare trading con gli squilibri senza tener conto delle notizie:

    • "Errore": ignorare notizie ed eventi importanti che possono influenzare il mercato.

    • "Soluzione": seguire le notizie e gli eventi economici che possono influenzare la formazione di squilibri.

Evitando questi errori, i trader possono fare trading con gli squilibri in modo più efficace e minimizzare i rischi.


Prodotti consigliati
Value Chart Candlesticks
Flavio Javier Jarabeck
4.57 (14)
The idea of a Value Chart indicator was presented in the very good book I read back in 2020 , " Dynamic Trading Indicators: Winning with Value Charts and Price Action Profile ", from the authors Mark Helweg and David Stendahl. The idea is simple and the result is pure genius: Present candlestick Price analysis in a detrended way! HOW TO READ THIS INDICATOR Look for Overbought and Oversold levels. Of course, you will need to test the settings a lot to find the "correct" one for your approach. It
FREE
Stackable VWAP
Flavio Javier Jarabeck
3.5 (4)
Volume Weighted Average Price (VWAP) is a trading benchmark commonly used by Big Players that gives the average price a Symbol has traded throughout the day. It is based on both Volume and price. Additionally we put in this indicator the MVWAP (Moving Volume Weighted Average Price). For those who do not know the usage and the importance od this indicator I recommend a great article about this subject at Investopedia ( https://www.investopedia.com/articles/trading/11/trading-with-vwap-mvwap.asp
FREE
VWAP and MVWAP
Flavio Javier Jarabeck
3.88 (8)
Volume Weighted Average Price (VWAP) is a trading benchmark commonly used by Big Players that gives the average price a Symbol has traded throughout the day. It is based on both Volume and price. Additionally we put in this indicator the MVWAP (Moving Volume Weighted Average Price). For those who do not know the usage and the importance od this indicator I recommend a great article about this subject at Investopedia ( https://www.investopedia.com/articles/trading/11/trading-with-vwap-mvwap.asp )
FREE
PZ Penta O MT5
PZ TRADING SLU
3.5 (4)
The Penta-O is a 6-point retracement harmonacci pattern which usually precedes big market movements. Penta-O patterns can expand and repaint quite a bit. To make things easier this indicator implements a twist: it waits for a donchian breakout in the right direction before signaling the trade. The end result is an otherwise repainting indicator with a very reliable trading signal. The donchian breakout period is entered as an input. [ Installation Guide | Update Guide | Troubleshooting | FAQ | A
FREE
The indicator highlights the points that a professional trader sees in ordinary indicators. VisualVol visually displays different volatility indicators on a single scale and a common align. Highlights the excess of volume indicators in color. At the same time, Tick and Real Volume, Actual range, ATR, candle size and return (open-close difference) can be displayed. Thanks to VisualVol, you will see the market periods and the right time for different trading operations. This version is intended f
FREE
MIDAS Super VWAP
Flavio Javier Jarabeck
4.27 (11)
Imagine VWAP, MVWAP and MIDAS in one place... Well, you found it! Now you can track the movement of Big Players in various ways, as they in general pursue the benchmarks related to this measuring, gauging if they had good execution or poor execution on their orders. Traders and analysts use the VWAP to eliminate the noise that occurs throughout the day, so they can measure what prices buyers and sellers are really trading. VWAP gives traders insight into how a stock trades for that day and deter
FREE
Weis Waves è un indicatore tecnico sviluppato da David Weis, ispirato ai principi di Richard Wyckoff. A differenza del volume tradizionale, mostrato barra per barra, Weis Waves accumula il volume in “onde” rialziste o ribassiste, ricominciando il conteggio ogni volta che il prezzo cambia direzione. Questo metodo consente al trader di vedere chiaramente la vera forza del movimento di mercato, poiché ogni onda riflette l’intensità del volume che sostiene la sequenza di candele. Caratteristiche
FREE
Weis Waves
Flavio Javier Jarabeck
2.83 (18)
The original author is David Weis, an expert in the Wyckoff Method. The Weis Wave is a modern adaptation of the 1930's Wyckoff Method, another expert in Tape Reading techniques and Chart Analysis. Weis Waves takes market volume and stacks it into waves according to price conditions giving the trader valuable insights about the market conditions. If you want to learn more about this subject you can find tons of videos in YouTube. Just look for "The Wickoff Method", "Weis Wave" and "Volume Spread
FREE
Donchian Pro
Paulo Henrique Faquineli Garcia
4.75 (4)
The Donchian Channel Channels are among the most popular tools of technical analysis, as they visually convey to the analyst the limits within which most price movement tends to occur. Channel users know that valuable information can be obtained at any time, whether prices are in the central region of a band or close to one of the border lines. One of the best known techniques to explore these concepts is Bollinger Bands. However, John Bollinger was not the only one to research the application
FREE
Midas VWAP
Paulo Henrique Faquineli Garcia
4 (2)
Volume Weighted Average Price (VWAP) is a trading benchmark commonly used by Big Players that gives the average price a Symbol has traded throughout the day. It is based on both Volume and price. This indicator contains Daily VWAP and MIDAS' VWAP, which means you are able to anchor the beggining of MIDAS' calculations and, therefore you will be able to use this methodology to study price versus volume moves after anchor point. You will be able to anchor up to 3 HIGH MIDAS VWAP's and 3 LOW. Wish
FREE
Necessary for traders: tools and indicators Waves automatically calculate indicators, channel trend trading Perfect trend-wave automatic calculation channel calculation , MT4 Perfect trend-wave automatic calculation channel calculation , MT5 Local Trading copying Easy And Fast Copy , MT4 Easy And Fast Copy , MT5 Local Trading copying For DEMO Easy And Fast Copy , MT4 DEMO Easy And Fast Copy , MT5 DEMO The homeopathic indicator is also called the CCI indicator. The CCI indicator was proposed
FREE
L'indicatore di intervallo temporale Wormhole per MetaTrader 5 (MT5) non è solo un altro strumento di trading: è il tuo vantaggio competitivo nei mercati finanziari. Progettato sia per i trader principianti che professionisti, Wormhole trasforma il modo in cui analizzi i dati e prendi decisioni, garantendo che tu sia sempre un passo avanti. Perché hai bisogno dell'indicatore Wormhole (gratuito) Sopravanza la concorrenza: La possibilità di visualizzare due intervalli di tempo sullo stesso grafico
FREE
VWAP Indicator
LUC JACOBUS A VERHEECKE
4.08 (26)
Volume Weighted Average Price (VWAP) The volume weighted average price (VWAP) is a  trading   benchmark  used by traders that gives the average price a security has traded at throughout the day, based on both volume and price. It is important because it provides traders with insight into both the trend and value of a security. This indicator VWAP V2 is free and is the manual version of the extended Easy VWAP indicator (30 Euro), where the date and time properties are automatically entered. With
FREE
Reversal Oscillator — Advanced Momentum Shift Detector Reversal Oscillator is a free indicator designed to highlight price zones that are statistically outside their normal movement patterns, helping traders anticipate potential turning points before they occur. Unlike traditional oscillators that react mainly to overbought/oversold conditions, this indicator applies third derivative analysis (the "acceleration of the acceleration" of price) calculated using two independent methods within a n
FREE
Basic Vwap
james mugendi
4 (1)
Simple Vwap with the daily, weekly and monthly VWAP is the abbreviation for   volume-weighted average price , which is a technical analysis tool that shows the ratio of an asset's price to its total trade volume. It provides traders and investors with a measure of the average price at which a stock is traded over a given period of time. How it's used Identify entry and exit points:   Traders can use VWAP to determine when to buy or sell an asset.   Understand price trends :  Traders can use V
FREE
Free automatic Fibonacci is an indicator that automatically plots a Fibonacci retracement based on the number of bars you select on the BarsToScan setting in the indicator. The Fibonacci is automatically updated in real time as new highest and lowest values appears amongst the selected bars. You can select which level values to be displayed in the indicator settings. You can also select the color of the levels thus enabling the trader to be able to attach the indicator several times with differe
FREE
Sviluppo della versione precedente dell'indicatore ZigZag WaveSize MT4 ZigZag WaveSize - indicatore ZigZag standard modificato con l'aggiunta di informazioni sulla lunghezza d'onda in punti, livelli e diverse logiche di allarme Miglioramenti generali: Adattamento del codice per MetaTrader 5 Lavoro ottimizzato con gli oggetti grafici Novità: Livelli orizzontali agli estremi Scelta del tipo di livelli: orizzontale/raggi/segmenti Filtro per livelli liquidi (non penetrati dal prezzo) Buffer per le
FREE
Easy VWAP
Luca Spinello
VWAP Indicator, the short form of Volume Weighted Average Price, is similar to a moving average but takes into consideration the tick volume of the candles. The indicator calculates the moving average multiplying the price of each candle for the tick volume in the candle. Said calculation weighs with more significance price where more transactions were made. Features: Visual styling customizable Period customizable Ease of use
FREE
XbigCandleFibo
Alex Sandro Aparecido
This indicator marks the 50% mark of each candle. It will help you make profitable scalping trades. If the next candle opens above the 50% mark of the previous candle, you should open a BUY position, and if the next candle opens below the 50% mark of the previous candle, you should open a SELL position. This strategy is very profitable. To make the most of it, keep an eye on the candle contexts on the left. Good luck!
FREE
Forex Chandilier
Ridhdi Patel
5 (2)
Ecco la traduzione professionale in italiano Forensic ATR Chandelier Exit Pro – Descrizione per MQL5 Market Prendi il pieno controllo delle tue uscite con precisione e logica basata sulla volatilità. Forensic ATR Chandelier Exit Pro è un indicatore ad alte prestazioni per il trend-following e la gestione dello stop-loss su MetaTrader 5. È progettato per trader che richiedono un’analisi della volatilità di livello professionale, replicando con precisione la logica delle migliori implementazion
FREE
Raymond Cloudy Day
The Hung Ngo
5 (3)
Raymond Cloudy Day Indicator for MT5 – Pivot-Based Reversal and Trend Levels Raymond Cloudy Day Indicator is a pivot-based level indicator for MetaTrader 5 (MT5). It was developed by Ngo The Hung based on Raymond’s original idea and is designed to give a structured view of potential reversal zones, trend extensions and support/resistance levels directly on the chart. The default settings are optimised for XAUUSD on the H1 timeframe, but the indicator can be tested and adjusted for other symbols
FREE
MegaSpikes Boom and Crash
Kwaku Bondzie Ghartey
4.55 (31)
MegaSpikes Boom and Crash MegaSpikes Boom and Crash is a MetaTrader 5 technical indicator for studying Boom and Crash synthetic index charts, mainly on the M1 timeframe. It brings several MegaSpikes modes into one indicator so users can observe chart conditions, alerts, and technical confirmations from a single tool. Main features Version selector for MegaSpikes 1, 1.31, 1.32, Divergence, and Last Red Candle modes. Technical-analysis components based on RSI, ATR, Alligator, moving averages, Para
FREE
Aggression Volume
Flavio Javier Jarabeck
4.29 (17)
Aggression Volume Indicator is the kind of indicator that is rarely found in the MQL5 community because it is not based on the standard Volume data provided by the Metatrader 5 platform. It requires the scrutiny of all traffic Ticks requested on the platform... That said, Aggression Volume indicator requests all Tick Data from your Broker and processes it to build a very special version of a Volume Indicator, where Buyers and Sellers aggressions are plotted in a form of Histogram. Additionally,
FREE
Bar Color Trend
Germano Chagas
4.38 (8)
Combining the best of Price Action , Directional Movement , and Divergence/Convergence analysis, Candle Color Trend is a easy and reliable way to identify trend direction. The indicator automatically paints the candles according to the assumption that an uptrend is defined by prices that form a series of higher highs and higher lows. In contrast, a downtrend is defined by prices that form a series of lower highs and lower lows. Additionally, ADX Wilder indicator is used to measure trend weakness
FREE
Wave Box Market Frenquency
Jean Jacques Huve Ribeiro
4.75 (4)
Totally linked to the result of a movement and the duration he had. Its height records how many ticks the asset walked during a given movement, its width shows us the duration that movement had. Its configuration must be in line with the Weis Wave Indicator configuration to observe the movement force and can indicate a possible accumulation or distribution of the movement;
FREE
Waves Sizer
Flavio Javier Jarabeck
3.86 (7)
Wyckoff fans, enjoy! Ideally to be used with the Weis Waves indicator, but it can be easily used alone, the Waves Sizer puts the range (in resulting Price movement) done by the Price on its market swings. You can control how accurate or loose will be the swings. This tool is very helpful for visually know how much the Price has traveled in your Timeframe. This way you can confront this level of effort with the resulting Volume, etc... Weis Waves indicator: https://www.mql5.com/en/market/produc
FREE
This indicator sums up the difference between the sells aggression and the buys aggression that occurred in each Candle, graphically plotting the waves of accumulation of the aggression volumes.   Through these waves an exponential average is calculated that indicates the direction of the business flow. Note: This indicator DOES NOT WORK for Brokers and/or Markets WITHOUT the type of aggression (BUY or SELL).   Be sure to try our Professional version with configurable features and alerts:  Agre
FREE
Il Tenet Support & Resistance Pro è un indicatore avanzato per MetaTrader 5, progettato per aiutare i trader a identificare con precisione le principali aree di supporto e resistenza del mercato. Basandosi sulla cronologia dei prezzi, l'indicatore traccia automaticamente linee orizzontali che evidenziano zone strategiche. Inoltre, evidenzia in tempo reale l'area attuale in cui la candela viene negoziata , fornendo una visione chiara delle aree critiche di decisione. Una caratteristica esclusi
FREE
MACD Enhanced
Nikita Berdnikov
5 (3)
Introducing the MACD  Enhanced – an advanced MACD (Moving Average Convergence Divergence) indicator that provides traders with extended capabilities for trend and momentum analysis in financial markets. The indicator uses the difference between the fast and slow exponential moving averages to determine momentum, direction, and strength of the trend, creating clear visual signals for potential entry and exit points. Attention! To achieve the best results, it is recommended to adapt the indicator
FREE
Auto Fibonacci Retracement Indicator — Flexible and Reliable This isn’t just another Auto Fibonacci Retracement indicator. It’s one of the most flexible and dependable tools available . If you find it useful, please consider leaving a review or comment — your feedback means a lot! Check out my other helpful tools below: Smart Alert Manager   - Set up advanced alerts and send them to Mobile, Telegram, Discord, Webhook... Timeframes Trend Scanner    - Scan the trend of assets in difference timefr
FREE
Gli utenti di questo prodotto hanno anche acquistato
ARIPoint
Temirlan Kdyrkhan
ARIPoint is a powerful trading companion designed to generate high-probability entry signals with dynamic TP/SL/DP levels based on volatility. Built-in performance tracking shows win/loss stats, PP1/PP2 hits, and success rates all updated live. Key Features: Buy/Sell signals with adaptive volatility bands Real-time TP/SL/DP levels based on ATR Built-in MA Filter with optional ATR/StdDev volatility Performance stats panel (Success, Profit/Loss, PP1/PP2) Alerts via popup, sound, push, or email Cu
SuperScalp Pro
Van Minh Nguyen
4.61 (23)
SuperScalp Pro – Sistema avanzato di indicatore scalping multi-filtro SuperScalp Pro è un indicatore di scalping avanzato che combina il classico Supertrend con molteplici filtri intelligenti di conferma per aiutare a identificare opportunità di trading. Funziona in modo efficiente su diversi timeframe da M1 a H4, con prestazioni ottimizzate su XAUUSD, BTCUSD e principali coppie Forex. L’indicatore fornisce chiari segnali Buy e Sell, insieme a livelli di ingresso, stop loss e take profit calcola
Entry In The Zone and SMC Multi Timeframe is a real-time 2-in-1 market analysis tool that combines market structure analysis and a No Repaint BUY / SELL signal system into a single indicator, built on Smart Money Concepts (SMC) — a widely adopted framework used by professional traders to understand market structure. This indicator helps you see the market more clearly, make decisions based on structure rather than guesswork, and focus on high-probability zones where price is more likely to react
SignalTech MT5 is a fully rule based trading system for EURUSD, USDCHF, USDJPY, AUDUSD, NZDUSD, EURJPY, AUDJPY, NZDJPY, CADJPY.  All the winning trades with chart setups are published on the comments page. 2025-12 1174 Pips 2026-01 2624 Pips 2026-02 2937 Pips 2026-03 2165 Pips 2026-04 2243 Pips It can generate signals with Buy/Sell Arrows and Pop-Up/Sound Alerts. Each signal has clear Entry and Stop Loss levels, which should be automatically flagged on the chart, as well as potential Targets 1,
Divergence Bomber
Ihor Otkydach
4.9 (87)
Ogni acquirente dell’indicatore riceverà inoltre gratuitamente: L’utilità esclusiva “Bomber Utility”, che gestisce automaticamente ogni operazione, imposta i livelli di Stop Loss e Take Profit e chiude le posizioni secondo le regole della strategia I file di configurazione (set file) per adattare l’indicatore a diversi asset I set file per configurare il Bomber Utility in tre modalità: “Rischio Minimo”, “Rischio Bilanciato” e “Strategia di Attesa” Una guida video passo-passo per installare, conf
Azimuth Pro
Ottaviano De Cicco
5 (7)
Azimuth Pro V2: Synthetic Fractal Structure and Confirmed Entries for MT5 Overview Azimuth Pro is a multi-level swing structure indicator by Merkava Labs . Four nested swing layers, swing-anchored VWAP, ABC pattern detection, three-timeframe structural filtering, and closed-bar confirmed entries — one chart, one workflow from micro-swings to macro-cycles. This is not a blind signal product. It is a structure-first workflow for traders who care about location, context, and timing. V2 Launch Offe
Gold Entry Sniper
Tahir Mehmood
5 (9)
Gold Entry Sniper – Dashboard ATR Multi-Timeframe per Scalping e Swing Trading sull’Oro Gold Entry Sniper è un indicatore avanzato per MetaTrader 5 che offre segnali di acquisto/vendita precisi per XAUUSD e altri strumenti, basato sulla logica ATR Trailing Stop e l' analisi multi-timeframe . Caratteristiche e Vantaggi Analisi Multi-Timeframe – Visualizza trend su M1, M5, M15 in un'unica dashboard. Trailing Stop Basato su ATR – Stop dinamici che si adattano alla volatilità. Dashboard Professional
Power Candles MT5
Daniel Stein
5 (8)
Power Candles V3 - Indicatore di forza ad ottimizzazione automatica Power Candles V3 trasforma la forza delle valute e degli strumenti in un piano di trading attuabile su ogni grafico a cui è collegato. Invece di limitarsi a colorare le candele, esegue un'auto-ottimizzazione in tempo reale in background e ti fornisce i migliori valori di Stop Loss, Take Profit e soglia di segnale per il simbolo che hai davanti. Basta un clic per adottarlo nel trading live: i raggi di ingresso, Stop Loss e Take P
Presentazione       Quantum Breakout PRO   , l'innovativo indicatore MQL5 che sta trasformando il modo in cui scambi le zone di breakout! Sviluppato da un team di trader esperti con un'esperienza di trading di oltre 13 anni,       Quantum Breakout PRO       è progettato per spingere il tuo viaggio di trading a nuovi livelli con la sua strategia innovativa e dinamica della zona di breakout. Quantum Breakout Indicator ti fornirà frecce di segnalazione sulle zone di breakout con 5 zone target di
Gann Made Easy è un sistema di trading Forex professionale e facile da usare che si basa sui migliori principi del trading utilizzando la teoria di mr. WD Gann. L'indicatore fornisce segnali ACQUISTA e VENDI accurati, inclusi i livelli di Stop Loss e Take Profit. Puoi fare trading anche in movimento utilizzando le notifiche PUSH. CONTATTAMI DOPO L'ACQUISTO PER RICEVERE GRATUITAMENTE LE ISTRUZIONI DI TRADING E OTTIMI INDICATORI EXTRA! Probabilmente hai già sentito parlare molte volte dei metodi d
Se acquisti questo indicatore, riceverai il mio Trade Manager Professionale + EA  GRATUITAMENTE. Innanzitutto è importante sottolineare che questo sistema di trading è un indicatore Non-Repainting, Non-Redrawing e Non-Lagging, il che lo rende ideale sia per il trading manuale che per quello automatico. Corso online, manuale e download di preset. Il "Sistema di Trading Smart Trend MT5" è una soluzione completa pensata sia per i trader principianti che per quelli esperti. Combina oltre 10 indicat
FX Trend MT5 NG
Daniel Stein
5 (4)
FX Trend NG: La Nuova Generazione di Intelligenza di Trend Multi-Mercato Panoramica FX Trend NG è uno strumento professionale di analisi del trend multi-timeframe e monitoraggio dei mercati. Ti consente di comprendere la struttura completa del mercato in pochi secondi. Invece di passare tra numerosi grafici, puoi identificare immediatamente quali strumenti sono in trend, dove il momentum sta diminuendo e dove esiste un forte allineamento tra i timeframe. Offerta di Lancio – Ottieni FX Trend NG
Atomic Analyst MT5
Issam Kassas
3.94 (31)
Innanzitutto, vale la pena sottolineare che questo indicatore di trading non è repaint, non è ridisegno e non presenta ritardi, il che lo rende ideale sia per il trading manuale che per quello automatico. Manuale utente: impostazioni, input e strategia. L'Analista Atomico è un indicatore di azione del prezzo PA che utilizza la forza e il momentum del prezzo per trovare un miglior vantaggio sul mercato. Dotato di filtri avanzati che aiutano a rimuovere rumori e segnali falsi, e aumentare il pote
Quantum TrendPulse
Bogdan Ion Puscasu
5 (23)
Ecco   Quantum TrendPulse   , lo strumento di trading definitivo che combina la potenza di   SuperTrend   ,   RSI   e   Stocastico   in un unico indicatore completo per massimizzare il tuo potenziale di trading. Progettato per i trader che cercano precisione ed efficienza, questo indicatore ti aiuta a identificare con sicurezza le tendenze di mercato, i cambiamenti di momentum e i punti di entrata e uscita ottimali. Caratteristiche principali: Integrazione SuperTrend:   segui facilmente l'andame
Meridian Pro
Ottaviano De Cicco
5 (1)
Meridian Pro 2.00: Professional Multi-Timeframe Trend Matrix for MT5 Meridian Pro 2.00 is a professional adaptive trend matrix for MetaTrader 5. It combines the original Meridian trend engine, a clean chart ribbon, closed-bar signal arrows, an 8-timeframe dashboard, Fuel momentum, weighted consensus, synthetic HTF processing and chart-native higher-timeframe context lines. The goal is simple: read current trend, multi-timeframe structure, strength, momentum and EA-ready state from one discipline
Market Structure Order Block Dashboard MT5 è un indicatore MT5 progettato per i trader che vogliono leggere la struttura di mercato e le principali zone di reazione del prezzo direttamente sul grafico. Combina BOS, ChoCH, Order Blocks, Fair Value Gaps (FVG), Liquidità, Kill Zones, Volume Profile e un pannello compatto per un'analisi rapida. Questo indicatore è rivolto ai trader che utilizzano la struttura di mercato, i concetti ICT e Smart Money come quadro decisionale. Può aiutare a individuare
Cominciamo con la verità. Nessun indicatore da solo ti renderà profittevole. Se qualcuno ti dice il contrario, ti sta vendendo un sogno. Qualsiasi indicatore che mostra frecce perfette di acquisto/vendita può essere reso impeccabile — basta ingrandire la giusta sezione della storia e catturare solo i trade vincenti. Noi non lo facciamo.  SMC Intraday Formula è uno strumento. Legge la struttura del mercato per te, identifica le zone a più alta probabilità e ti mostra esattamente come appare la t
Grabber System MT5
Ihor Otkydach
4.83 (23)
Ti presento un eccellente indicatore tecnico: Grabber, che funziona come una strategia di trading "tutto incluso", pronta all’uso. In un solo codice sono integrati strumenti potenti per l’analisi tecnica del mercato, segnali di trading (frecce), funzioni di allerta e notifiche push. Ogni acquirente di questo indicatore riceve anche gratuitamente: L’utility Grabber: per la gestione automatica degli ordini aperti Video tutorial passo dopo passo: per imparare a installare, configurare e utilizzare
OrderFlux | Footprint Orderflow per MetaTrader 5 Versione 2.0 – Visualizzazione Bid/Ask in tempo reale per Trader Attivi OrderFlux è un indicatore di footprint e orderflow per MT5. Non mostra solo dove si è mosso il prezzo, ma cosa succede all'interno del movimento: volume Bid/Ask per livello di prezzo, delta, imbalance e distribuzione del volume. Molti grafici ti mostrano solo il risultato finale di una candela. OrderFlux ti mostra il percorso per arrivarci. Questo è esattamente ciò che aiuta q
Questo cruscotto mostra gli ultimi   pattern armonici   disponibili per i simboli selezionati, in modo da risparmiare tempo ed essere più efficienti /   versione MT4 . Indicatore gratuito:   Basic Harmonic Pattern Colonne dell'indicatore Symbol :   vengono visualizzati i simboli selezionati Trend:   rialzista o ribassista Pattern:   tipo di pattern (gartley, butterfly, bat, crab, shark, cypher o ABCD) Entry:   prezzo di ingresso SL:   prezzo di stop loss TP1:   1 prezzo di take profit TP2:
Crystal Heikin Ashi Signals
Muhammad Jawad Shabir
5 (2)
Crystal Heikin Ashi Signals - Professional Trend & Signal Detection Indicator Advanced Heikin Ashi Visualization with Intelligent Signal System for Manual & Automated Trading Final Price: $149 ---------> Price goes up $10 after every 10 sales . Limited slots available — act fast . Overview Crystal Heikin Ashi Signals is a professional-grade MetaTrader 5 indicator that combines pure Heikin Ashi candle visualization with an advanced momentum-shift detection system. Designed for both manual traders
Btmm state engine pro
Garry James Goodchild
5 (4)
BTMM State Engine Pro is a MetaTrader 5 indicator for traders who use the Beat The Market Maker approach: Asian session context, kill zone timing, level progression, peak formation detection, and a multi-pair scanner from a single chart. It combines cycle state logic with a built-in scanner dashboard so you do not need the same tool on many charts at once. What it does Draws the Asian session range; session times can follow broker server offset or be set in inputs. Tracks level progression (L
Innanzitutto, vale la pena sottolineare che questo Strumento di Trading è un Indicatore Non-Ridipingente, Non-Ridisegnante e Non-Laggante, il che lo rende ideale per il trading professionale. Corso online, manuale utente e demo. L'Indicatore Smart Price Action Concepts è uno strumento molto potente sia per i nuovi che per i trader esperti. Racchiude più di 20 utili indicatori in uno solo, combinando idee di trading avanzate come l'Analisi del Trader del Circolo Interno e le Strategie di Tradin
OmniSync Projection
Antonio-alin Teculescu
5 (1)
Chronos Fractal Engine is an innovative price projection indicator for MetaTrader 5, designed to transform your technical analysis by intelligently identifying and projecting historical price patterns. Built upon an advanced correlation algorithm and the fractal principles of the market, this powerful tool visualizes potential future price movements, giving you a unique edge in your trading decisions. What is Chronos Fractal Engine? At its core, the Chronos Fractal Engine employs a sophisticat
L'indicatore " Dynamic Scalper System MT5 " è progettato per il metodo di scalping, ovvero per il trading all'interno di onde di trend. Testato sulle principali coppie di valute e sull'oro, è compatibile con altri strumenti di trading. Fornisce segnali per l'apertura di posizioni a breve termine lungo il trend, con ulteriore supporto al movimento dei prezzi. Il principio dell'indicatore. Le frecce grandi determinano la direzione del trend. Un algoritmo per generare segnali per lo scalping sott
Super Signal Market Slayer No repaint | Alta precisione | Indicatore di trend intelligente multi-mercato Nel trading, la vera difficoltà non è aprire un’operazione, ma riconoscere chiaramente quando un trend sta realmente iniziando. Market Slayer nasce proprio per questo. È un indicatore intelligente senza repaint, progettato specificamente per il trading intraday. Grazie a conferme multilivello e filtri di trend, fornisce segnali Buy / Sell chiari e affidabili solo nei momenti chiave. Vantaggi
FX Levels MT5
Daniel Stein
5 (13)
FX Levels: Supporti e Resistenze di Precisione Eccezionale per Tutti i Mercati Panoramica Rapida Cercate un modo affidabile per individuare livelli di supporto e resistenza in ogni mercato—coppie di valute, indici, azioni o materie prime? FX Levels fonde il metodo tradizionale “Lighthouse” con un approccio dinamico all’avanguardia, offrendo una precisione quasi universale. Basato sulla nostra esperienza reale con i broker e su aggiornamenti automatici giornalieri più quelli in tempo reale, FX
Market Structure Patterns
Samuel Manoel De Souza
4.47 (19)
Market Structure Patterns   è un indicatore basato sui   Smart Money Concepts   che mostra gli   elementi SMC/ICT   che possono portare le tue decisioni di trading a un livello superiore. Approfitta di   alert ,   notifiche push   e   email   per essere avvisato quando si forma un elemento sul grafico, il prezzo supera un livello e/o entra in una zona. Gli sviluppatori possono accedere ai valori degli elementi dell’indicatore utilizzando le   variabili globali , consentendo l’automazione delle
Trend indicator AI mt5
Ramil Minniakhmetov
5 (17)
Trend Ai indicator è un ottimo strumento che migliorerà l'analisi di mercato di un trader combinando l'identificazione della tendenza con punti di ingresso utilizzabili e avvisi di inversione. Questo indicatore consente agli utenti di navigare nelle complessità del mercato forex con fiducia e precisione Oltre ai segnali primari, l'indicatore Ai di tendenza identifica i punti di ingresso secondari che si presentano durante i pullback o i ritracciamenti, consentendo ai trader di capitalizzare le
Gartley Hunter Multi
Siarhei Vashchylka
5 (11)
Gartley Hunter Multi - An indicator for searching for harmonic patterns simultaneously on dozens of trading instruments and on all possible timeframes. Manual (Be sure to read before purchasing) | Version for MT4 Advantages 1. Patterns: Gartley, Butterfly, Shark, Crab. Bat, Alternate Bat, Deep Crab, Cypher 2. Simultaneous search for patterns on dozens of trading instruments and on all possible timeframes 3. Search for patterns of all possible sizes. From the smallest to the largest 4. All fou
Altri dall’autore
Step trailing stop
Evgenii Zhivogliadov
5 (1)
Passo dopo passo "Trailing Stop" L'utilità consente di impostare la fase di spostamento dello "Stop Loss" seguendo il prezzo quando si utilizza lo strumento "Trailing Stop". A differenza del "normale" "Trailing Stop" disponibile nel terminale "MetaTrader", che consente di impostare il movimento "Stop Loss" in incrementi di 1 pip, questo "Trailing Stop" è configurato con qualsiasi incremento. Questa impostazione consente di evitare di chiudere posizioni durante false inversioni di tendenza, quand
FREE
Filtro:
Nessuna recensione
Rispondi alla recensione