TickBasedATR
- Indicatori
- Versione: 1.0
- Attivazioni: 5
Description
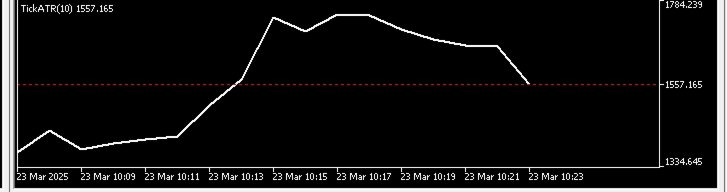
The TickATR indicator is a powerful volatility measurement tool for MetaTrader 5 that displays the Average True Range (ATR) in terms of actual price ticks. This innovative approach provides traders with a more precise and instrument-independent way to gauge market volatility compared to traditional ATR indicators.
By measuring volatility in ticks rather than price units, TickATR offers consistent readings across different instruments regardless of their price scale, making it an invaluable tool for multi-instrument traders and algorithmic systems.
Key Features
- Tick-Based Measurement: Calculates ATR in actual market ticks instead of arbitrary price units
- Color-Coded Visualization: Instantly identifies volatility regimes with intuitive color changes:
- Green: Normal volatility (within your defined thresholds)
- Orange: Low volatility (below lower threshold)
- Red: High volatility (above upper threshold)
- Dynamic Level Line: Displays the current ATR value as a horizontal reference line
- Customizable Thresholds: Set your own upper and lower volatility boundaries to match your trading style
- Smooth Calculation: Uses a weighted moving average method for more stable readings
- Separate Window Display: Clean visualization that doesn't clutter your main chart
Practical Applications
- Risk Management: Adjust position sizes based on current market volatility
- Stop Loss Placement: Set more accurate stop losses based on tick volatility
- Trade Filtering: Avoid entering trades during extreme volatility conditions
- Volatility Breakouts: Identify when markets transition from low to high volatility
- Market Regime Analysis: Easily distinguish between trending and ranging markets
- Multi-Timeframe Analysis: Compare volatility across different timeframes
How It Works
The indicator calculates the True Range for each price bar (the greatest of: current high-low, previous close-current high, or previous close-current low) and converts this value to ticks by dividing by the instrument's tick size. It then applies a weighted moving average over your specified period to produce a smooth ATR reading.
The color-coding system provides instant visual feedback about the current volatility state:
- Green indicates normal market conditions ideal for standard trading strategies
- Orange signals unusually low volatility, which might precede breakouts or require range-trading approaches
- Red warns of excessive volatility, suggesting caution or the use of volatility-based strategies
Advantages Over Standard ATR
- More consistent readings across different instruments
- Easier to interpret and apply to trading decisions
- Better suited for algorithmic trading systems
- More relevant for modern electronic markets
- Clearer visual signals with color-coded volatility zones
Whether you're a day trader, swing trader, or algorithmic trader, TickATR provides valuable insights into market conditions that can help you make more informed trading decisions and better manage risk across multiple instruments and timeframes.