TrueTrendStar TTS25

   Advanced Detector of Trend Reversal and Continuance known as TrueTrendStar(TTS) is a sensitive and Predictive indicator of Price Trends for Professional traders.

( ATTENTION BUYERS:-PLEASE CONTACT ME FOR HOW BEST TO USE THE INDICATOR FOR MAXIMUM PROFITS )

   This indicator detects advanced signals of high odds changes in Price Trend direction long before other indicator detects it. I have been working on it since 2019.

   This is possible due to fractal nature of forex and other financial markets,which this indicator captures it consistently.This indicator can generate Signals for all types of markets viz currency,crypto,metals,energy,Stock etc

   It used an accurate non-repainting custom indicator that scans the selected currency pairs 24 hrs in all time-frames and captures the currency market Trend status in an elegant Dashboard.

   How will TTS indicator Show Changes in Trend?

   TTS will show When:

  • Uptrend is starting
  • Uptrend is getting weaker
  • Down Trend is starting
  • Downtrend is getting weaker. 

   The indicator signal is non-repainting and high probability and can be used effectively by any traders including Propriety firms.

   One important thing the Trader will notice is the almost immediate movement of price towards the direction of the TTS signal because of its  high probability nature.

   TTS indicator important features

  •  High Probability Trade Signals 
  •  Predicts Trend Direction
  •  Indicate Price Turning Points & Reversals
  •  Indicate Price Trend Continuance Points
  •  Capture short term & long term price action
  •  Indicate Trend Strength & Acceleration
  •  Indicate Signal Freshness
  •  Creates dynamic Support & Resistance levels at Signal points
  •  Comprehensive Market analysis tool
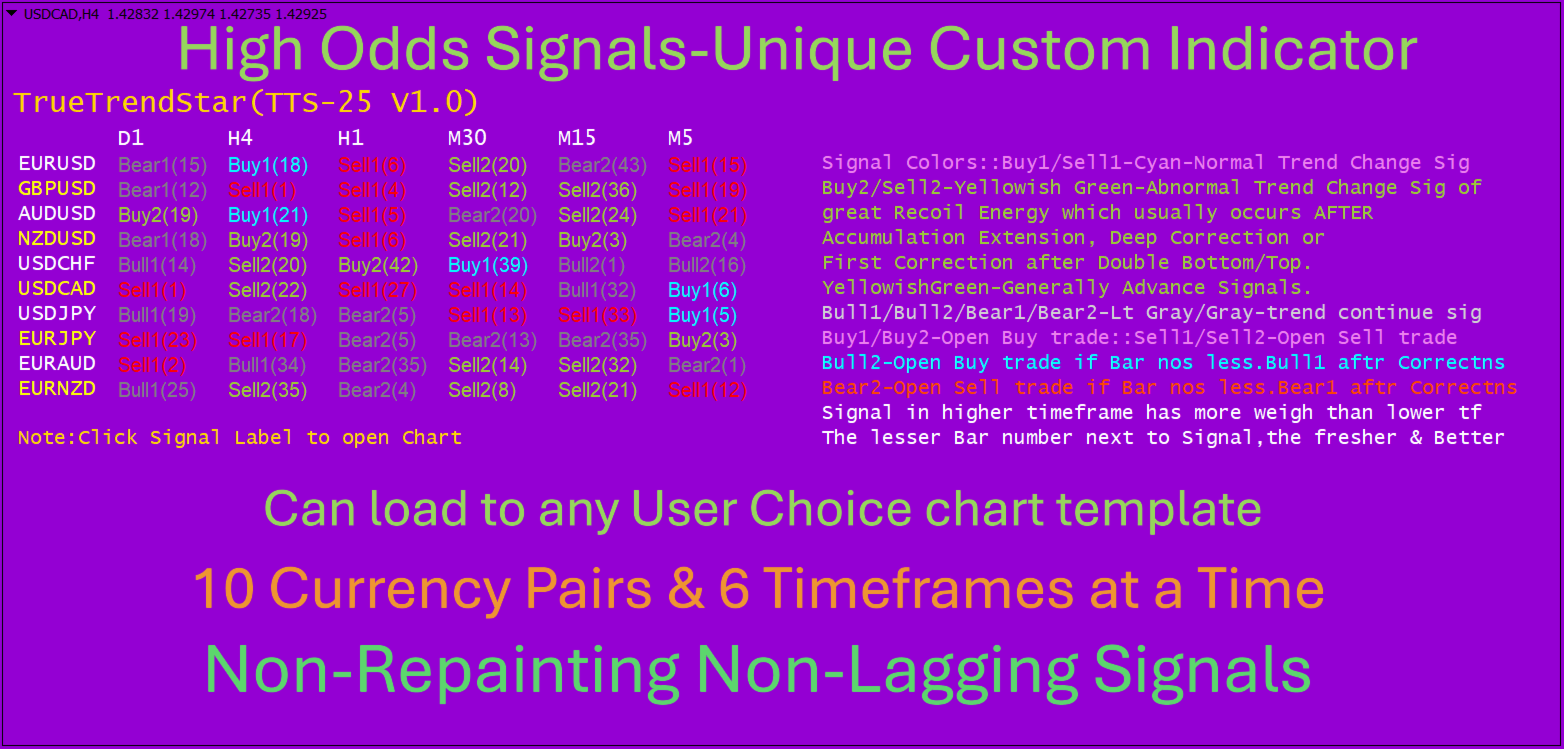
  •  Signals across Multi-time frames(max 6 at a time)
  •  Analyze all Forex pairs(10 at a time)
  •  Alert all Signals
   Why TTS indicator is for you?

       TTS is an indicator i personally use for manual & semi-Automatic trading with good and consistent results since 2021 before releasing to the public.

          I will like to welcome you to try out the high odds entry signal of TTS Indicator by Renting for 1month and following  the Proven Strategy as given below, freely given, to help you out in your trading. Demo version is available but has inherent limitations by default, however you can familiarize with the indicator by testing the demo in strategy tester and see how Signals update in various time frames.Almost all signals are High Odds especially in higher time frame and TTS indicator Win Rate is consistent and very high.

          Before loading the indicator Dashboard into a chart,make a Blank template without any indicators although not mandatory.Then the TTS indicator will  load onto the chart without any problems.The background color as well as colors of Signals etc are completely user customizable.


        Customization and Settings

        TTS allows traders to adjust key settings to match their trading style:

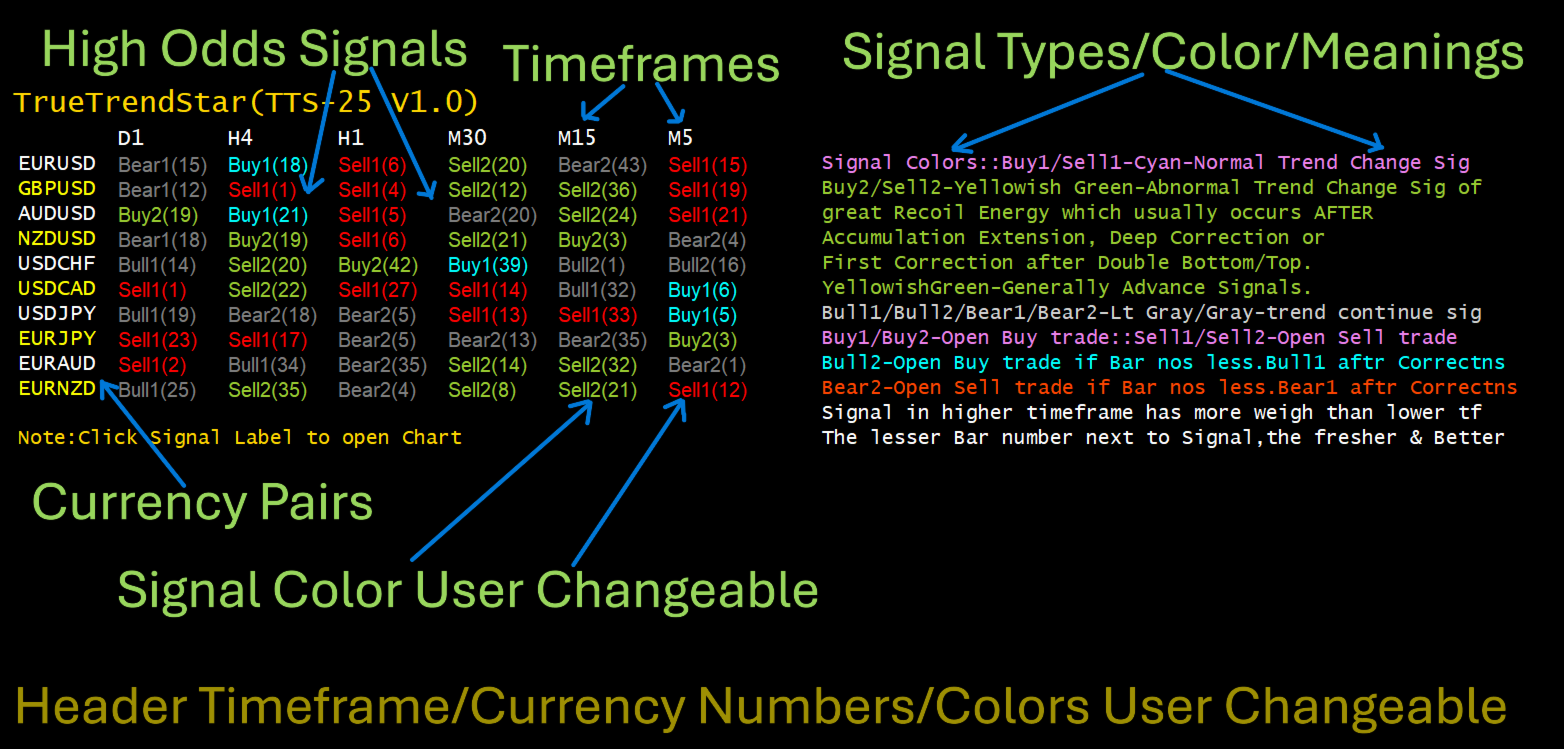
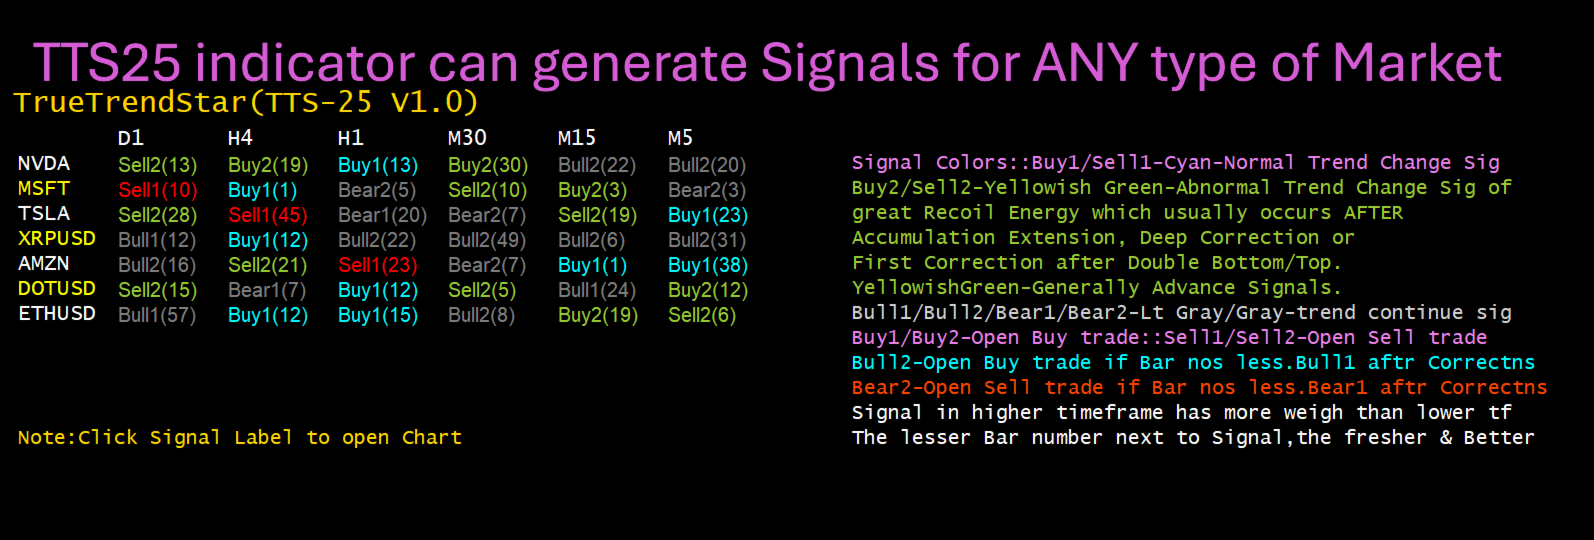
      • Custom Signal Colors: Modify the colors of Buy1, Buy2, Sell1, Sell2,Bull1, Bull2, Sell1 and Sell2 signal for better visibility.Also option given to customize color of header Row and Column.
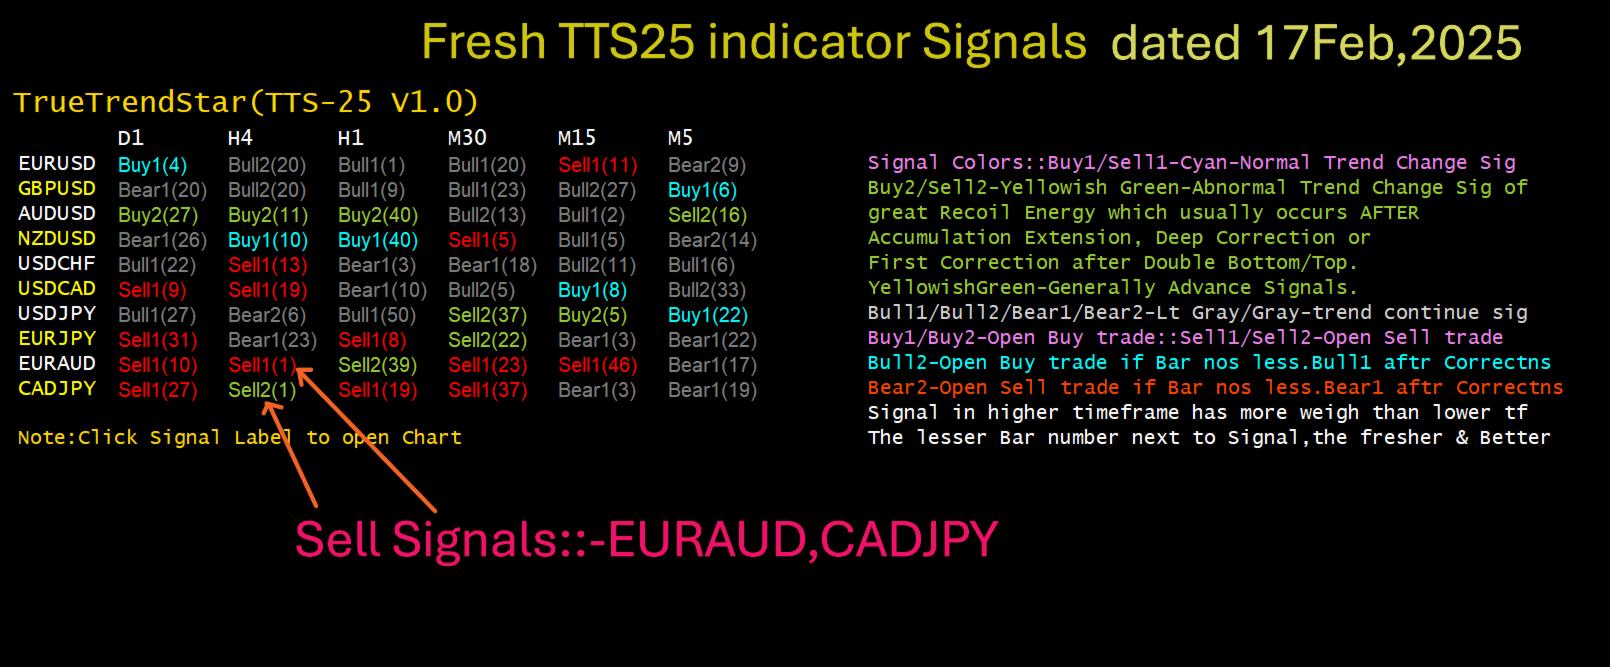
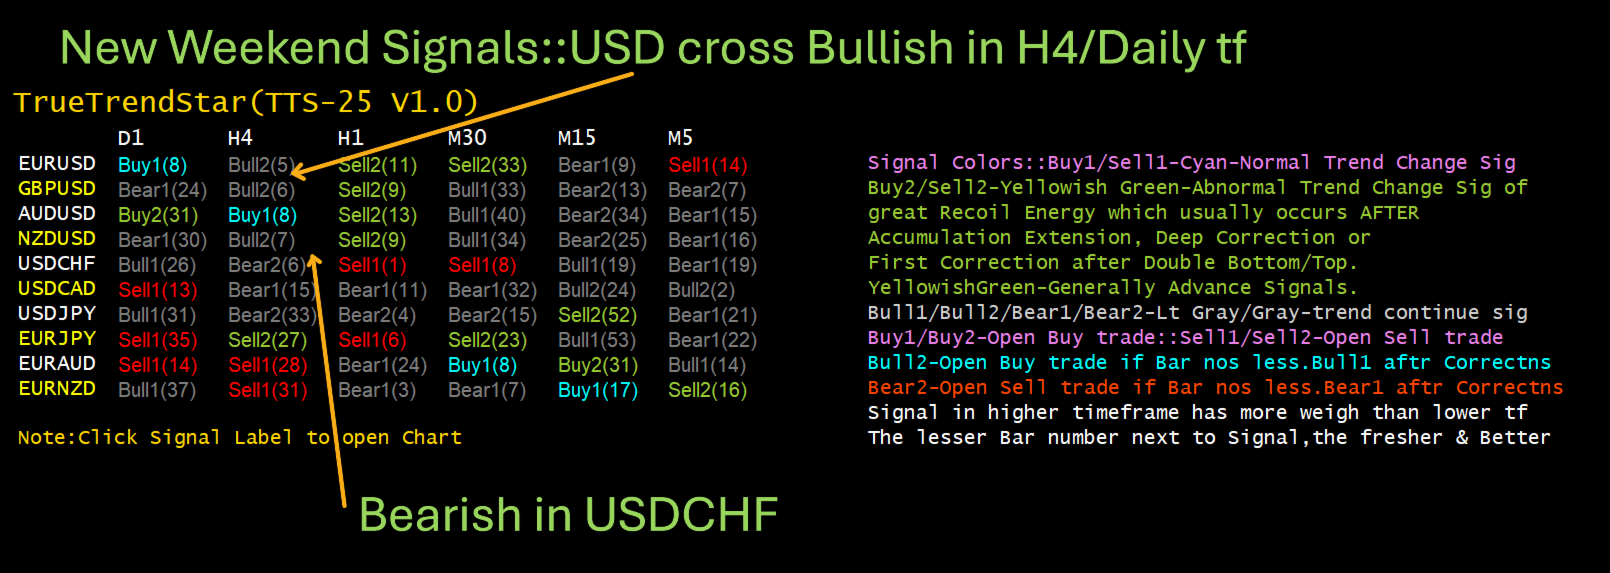
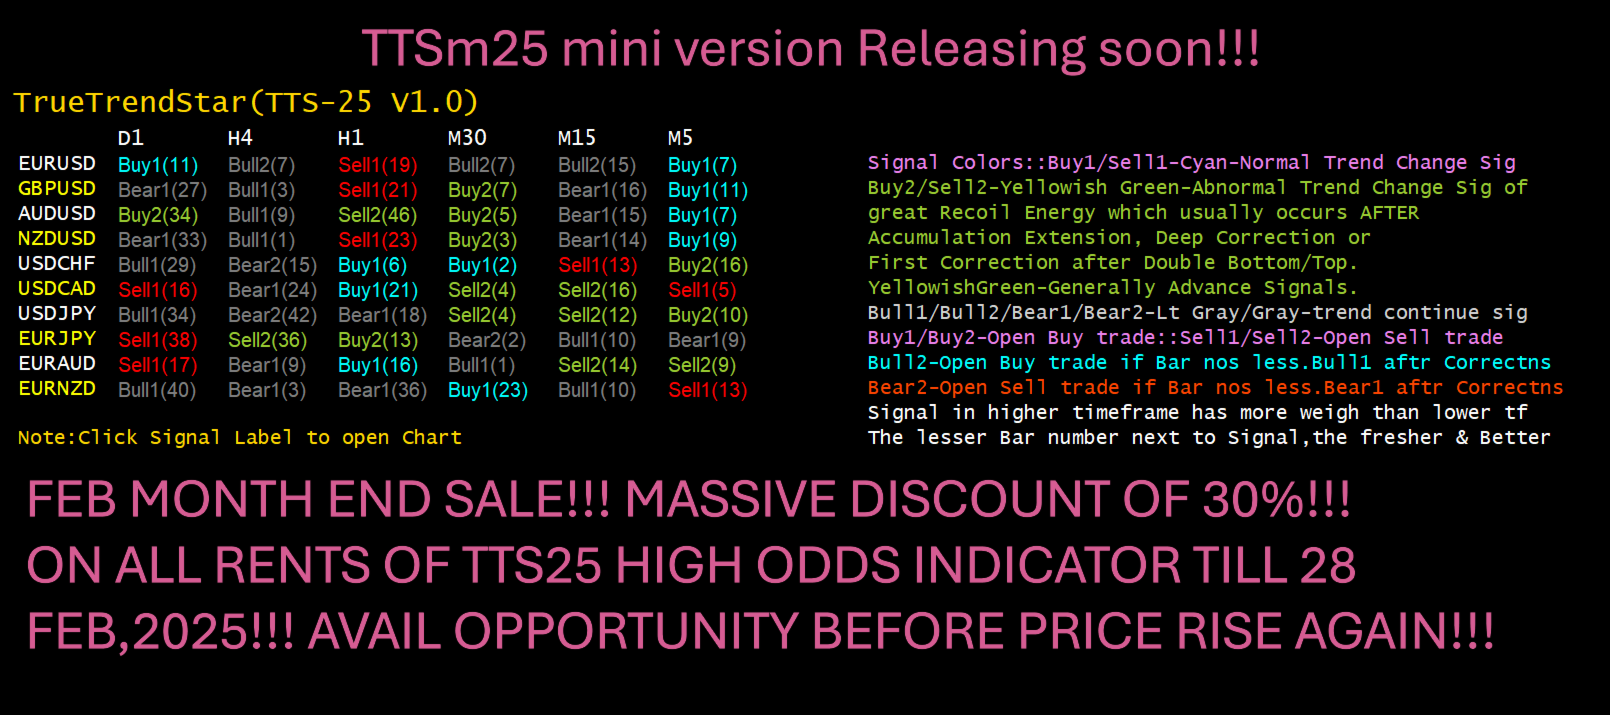
      • Selectable Forex Pairs: Focus on specific currency pairs(max 10) that match your strategy, default as  EURUSD,GBPUSD,AUDUSD,NZDUSD, USDCHF, USDCAD,USDJPY,EURJPY,EURAUD,EURNZD where each currency pair is separated by comma.
      • Time frame Selection: Customize which time frames(max 6) are displayed on the dashboard for easier monitoring, default as D1,H4,H1,M30,M15,M5 where each time frame header is separated by comma.
      • Alert System: Set up notifications viz Pop Up, Email and Push, when new signals appear to avoid missing trade opportunities.Alert time interval can also be adjusted for convenience.(default at 3 times per time frame)

        How TrueTrendStar Signal Works ?

        TTS continuously evaluates price behavior and market momentum to determine when trends are forming or reversing. It classifies signals into eight key types:

      • Buy1 Signal: The first sign of an emerging  high odds uptrend. This appears when market conditions indicate a shift toward bullish momentum.
      • Buy2 Signal: A high odds uptrend signal after Accumulation Extension, Deep Correction or First Correction after Double Bottom/Top reinforcing   the likelihood  of continued price increase. This signal has strong Recoil energy.
      • Sell1 Signal: The first indication of a high odds downtrend, appearing when bearish conditions develop.
      • Sell2 Signal: A high odds Down trend signal after Distribution Extension, Deep Correction or First Correction after Double Bottom/Top reinforcing the likelihood  of continued price decrease. This signal has strong Recoil energy.
      • Bull1 Signal:  Bullish Correction/Reversal signal ensured by confirmations. Often Signals start of Double Top too.
      • Bull2 Signal:  Bullish signal.(less bar nos the better)
      • Bear1 Signal: Bearish Correction/Reversal signal ensured by confirmations  Often Signals start of Double Bottom too.
      • Bear2 Signal: Bearish signal.( less bar nos the better )
      • Buy1, Sell1:   Normal Buy and Sell signals respectively.
      • Buy2, Sell2:   Somewhat Abnormal(Special) Buy and Sell signals respectively
      • Buy1 generally indicates start of

                                        Inverse head and shoulder formations(Inv H&S) or
                                        Double bottom(DB) or 
                                        Upswing(US)

               which are all high probability patterns

      • Sell1 generally indicates start of

                                       Head and Shoulder formation(H&S) or
                                       Double Top(DT) or
                                       Down Swing(DS)

               which are all high probability patterns.

      • Buy2 generally indicates start of

                                       Correction after Deep Accumulation Extension or
                                       Abnormal Double bottom(DB) or 
                                       Upswing(US) to rejoin Uptrend

               which are all high probability patterns

      • Sell2 generally indicates start of

                                        Correction after Deep Accumulation Distribution or
                                        Abnormal Double Top(DT) or 
                                        Down Swing(DS) to rejoin Down trend

               which are all high probability patterns

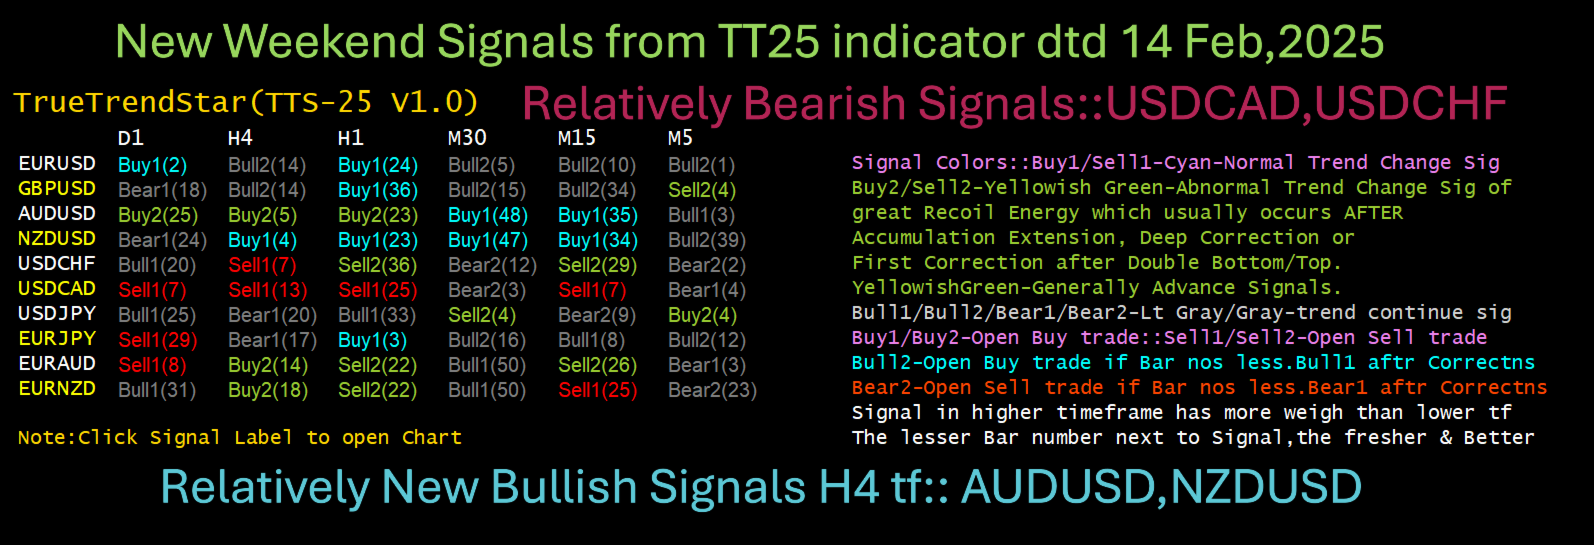
      • When Conflicting Signals occurs across time frames,generally Higher time frames signal prevails
      • Uniformity of signals in adjacent time frames are significant 
      • Shows the changes in price is sometimes from low time frame to high time frame or vice versa

      • Dashboard Signal in forex pair is significant to its Correlated pairs too and can be inspected for concurrence.

      • The Dashboard signal can be used as standalone signal however it may be complemented by compatible indicators like Bollinger band,Wave count indicators,Double Bottom or Top indicator,Oscillators like RSI & Stochastic and 200 periods Simple Moving Average.

      • The TTS indicator can be used on any time intervals on the chart, ranging from minute (M1) to monthly (MN).

      • Following these signals upto its Trend-End  Zone can reap in consistent pips.

      • Signals in Compatible time-frame can be more powerful confirmation of Trend Directions,Its Changes or Continuations.For example M5-M30,M30-H4 are Compatible time-frames

      • Clicking on Signal Label will open up the forex pair chart of the particular time-frame where one can trade the signal immediately.

      • Using the TTS Dashboard indicator's signals, precise entry points is indicated, with an average risk-to-reward ratio exceeding 1:2. 

      • Occurance of Trend Change signal after sufficient trending of prices is most probable for biggest profits.


         Step-by-step video instructions explain how to work with the indicator using specific examples, even if you're doing it for the first time.

         Each of these signals is carefully calculated using advanced algorithms that consider price action, volatility, and momentum.


         Multi-Time frame Market Scanning

         One of TTS’s standout features is its ability to analyze multiple time frames simultaneously. Instead of focusing on a single time frame, traders can view trend signals across various time horizons, gaining a broader perspective of market conditions.

        This multi-time frame approach allows traders to:
           ✅ Identify long-term trend direction while executing trades on shorter time frames.
           ✅ Avoid false signals by ensuring trends align across multiple time frames.
           ✅ Spot high-probability trade setups where short-term and long-term trends match.

        TTS displays this information on an intuitive dashboard, making it easy to check trend signals for different time frames at a glance.

        How to Use TTS Effectively

         Trade Execution Strategy

      • Compatible Time frame Signals Trend(CTST) strategy-For Example-EURUSD shows Sell2 signal in H4 time frame,Wait for Sell1 or Sell2 in M30 to open Sell trade.Close the trade when Buy1 or Buy2 shows up in M30min.Early exit can be done on Buy1 or Buy2 signals in 5min time frame too.Similarly for the Buy signals also.
      • Main Trend Direction Scalping(MTDS) strategy-For example-GBPUSD show Buy1 or Buy2 signals in H4 time frame,wait for Buy1 or Buy2 in 5min time frame to open Buy trades.Close the trades when Sell1 or Sell 2 happens in 5min time frame.
      • Positional Trend(PT) strategy-For example-USDCAD shows Buy2 signal in H4 time frame,then immediately enter Buy trade and wait for Sell1 or Sell2 signals in H4 to close the trades.For early exit,open trades can be exited when Sell1 or Sell2 signals happen in nearest lower time frame i.e H1.
      • Low to High Swing Reversal(LTHS) strategy-For example-USDCHF shows Buy2 signal in H4 time frame and Sell2 signal in 5min time frame, then immediately enter sell trade trade and wait for Sell1 or Sell2 in nearest higher time frame i.e 15min time frame,and if happened,there is follow through and the trades can be hold longer as successful reversal trades.Trades can be closed if Buy1 or Buy2 happens in 5min time frame thereafter.
      • Confirm Trend(CT) strategy-For example-EURUSD shows Bear2(1) signal in H4 time frame,then immediately enter Buy trade,wait for Buy1 or Buy2 signals in next lower time frame i.e H1 or M30,then close the trade.
      • Buy and Hold(BH) strategy-For example-USDJPY shows Buy2 signal in H4 time frame,then wait for Buy1 or Buy2 signals in H1/M30/M15 timeframes and add more Buy positions whenever signals happen in compatible lower time frames.Trades can be exited when Sell1 or Sell2 signal happen in H4 time frame.
      • Entry on TTS Signal and Exit on Other Indicators(ETEOI) strategy-For example-USDJPY shows Buy1 in M30 time frame,then enter Buy trade and Exit on Rsi or Stochastic Overbought signal in same time frame.

          The above given trading strategies are tested and proven as reliably consistent.However, the TTS signals can also be used along with compatible indicators such as Bollinger Bands,Wave Count,Double Bottom and Top indicator,Oscillators like RSI/Stochastic and 200 period simple moving average.However,as explain above,the TTS signals alone is sufficient to trade the markets with high odds entries and exits.

        Customization and Settings

        TrueTrendStar allows traders to adjust key settings to match their trading style:

      • Custom Signal Colors: Modify the colors of Buy1, Buy2, Sell1, and Sell2 signals for better visibility.
      • Selectable Forex Pairs: Focus on specific currency pairs that match your strategy(max 10).
      • Time frame Selection: Customize which time frames are displayed on the dashboard for easier monitoring(max 6).
      • Alert System: Set up notifications when new signals appear to avoid missing trade opportunities.

        Why Choose TrueTrendStar?

           ✅ Non-Repainting Signals: Once a signal is generated, it remains fixed, ensuring transparency and accuracy.
           ✅ Multi-Time frame Analysis: See trend shifts across multiple time frames for better decision-making.
           ✅ Early Trend Detection: Get ahead of the market by identifying high odds reversals before traditional indicators.
           ✅ User-Friendly Dashboard: Quickly assess market conditions without needing complex analysis.
           ✅ Versatile Trading Application: Suitable for Scalping, Day trading, Positional trading , Swing trading and Buy & Hold trading.


        What this means for you?

        TrueTrendStar is a powerful and reliable forex trading indicator designed to help traders identify trend changes early and trade with confidence. Its a combination of non-repainting trend signals, multi-time frame analysis, and an intuitive dashboard makes it a must-have tool for both beginner and experienced traders to trade currencies professionally and profitably.

        By integrating TTS into your trading strategy, you can improve market timing, minimize guesswork, and enhance your overall trading performance.

        (In case of any doubt about the indicator or strategy,a buyer can contact the author through the messaging system of MQL5.Com site.)


        Warm regards for your profitable trading success!

        Note:: By design, The TTS indicator update after every time interval of 10 sec.


      Prodotti consigliati
      Gold Titan King Scalper
      Dodong Christian Arnon
      Indicator Description GOLD TITAN KING SIGNAL INDICATOR High-Precision Gold Scalping Buy/Sell Signals – Manual Trading Assistant Overview The Gold Titan King Signal Indicator is a manual trading assistant tool designed for high-frequency scalping on Gold (XAUUSD) and other major pairs. It generates clear BUY/SELL signals with precise entry levels, along with adjustable Stop Loss and Take Profit levels displayed directly on the chart. ️ This tool is NOT an EA. It does not execute trades
      L'indicatore SMC Venom Model BPR è uno strumento professionale per i trader che operano nell'ambito del concetto di Smart Money (SMC). Identifica automaticamente due modelli chiave sul grafico dei prezzi: FVG   (Fair Value Gap) è una combinazione di tre candele, in cui c'è un gap tra la prima e la terza candela. Forma una zona tra livelli in cui non c'è supporto di volume, il che spesso porta a una correzione dei prezzi. BPR   (Balanced Price Range) è una combinazione di due modelli FVG che for
      L'indicatore costruisce le quotazioni attuali, che possono essere confrontate con quelle storiche e su questa base fanno una previsione del movimento dei prezzi. L'indicatore ha un campo di testo per una rapida navigazione fino alla data desiderata. Opzioni: Simbolo - selezione del simbolo che visualizzerà l'indicatore; SymbolPeriod - selezione del periodo da cui l'indicatore prenderà i dati; IndicatorColor - colore dell'indicatore; HorisontalShift - spostamento delle virgolette disegnate d
      Trend Ray
      Andriy Sydoruk
      The indicator shows the potential trend direction by cyclical-wave dependence. Thus, all the rays of the intersection will be optimal rays, in the direction of which the price is expected to move, taking into account the indicator period. Rays can be used as a direction for potential market movement. But we must not forget that the approach must be comprehensive, the indicator signals require additional information to enter the market.
      SIRR Scalper for PipFinite is a robot that has been designed to work with the PipFinite Trend PRO Indicator. It is a dynamic EA that is very active with trades and capital management. The EA can trade the popular symbols EURUSD, GBPUSD, USDCHF, USDJPY, USDCAD, AUDUSD, EURGBP, EURCHF, EURJPY, AUDNZD, AUDCAD, EURNZD. Check our   Blogs   where we share news and set files When you buy my robot, you are welcome to drop me a message to discuss the best setup in combination with the set files 2 purchas
      Noize Absorption Index MT4
      Ekaterina Saltykova
      5 (1)
      Noize Absorption Index - is the manual trading system that measures the difference of pressure between bears forces and bulls forces. Green line - is a noize free index that showing curent situation. Zero value of index shows totally choppy/flat market.Values above zero level shows how powerfull bullish wave is and values below zero measures bearish forces.Up arrow appears on bearish market when it's ready to reverse, dn arrow appears on weak bullish market, as a result of reverse expectation. S
      Antabod Gamechanger
      Rev Anthony Olusegun Aboderin
      *Antabod GameChanger Indicator – Transform Your Trading!*   Are you tired of chasing trends too late or second-guessing your trades? The *Antabod GameChanger Indicator* is here to *revolutionize your trading strategy* and give you the edge you need in the markets!   Why Choose GameChanger? *Accurate Trend Detection* – GameChanger identifies trend reversals with *pinpoint accuracy*, ensuring you enter and exit trades at the optimal time.   *Clear Buy & Sell Signals* – No more guesswork! T
      Forex Gump
      Andrey Kozak
      2.4 (5)
      Forex Gump is a fully finished semi-automatic trading system. In the form of arrows, signals are displayed on the screen for opening and closing deals. All you need is to follow the instructions of the indicator. When the indicator shows a blue arrow, you need to open a buy order. When the indicator shows a red arrow, you need to open a sell order. Close orders when the indicator draws a yellow cross. In order to get the most effective result, we recommend using the timeframes H1, H4, D1. There
      VR Cub
      Vladimir Pastushak
      VR Cub è un indicatore per ottenere punti di ingresso di alta qualità. L'indicatore è stato sviluppato per facilitare i calcoli matematici e semplificare la ricerca dei punti di ingresso in una posizione. La strategia di trading per la quale è stato scritto l'indicatore ha dimostrato la sua efficacia per molti anni. La semplicità della strategia di trading è il suo grande vantaggio, che consente anche ai trader alle prime armi di commerciare con successo con essa. VR Cub calcola i punti di apert
      Blahtech Market Profile
      Blahtech Limited
      4.53 (15)
      Was: $249  Now: $99   Market Profile defines a number of day types that can help the trader to determine market behaviour. A key feature is the Value Area, representing the range of price action where 70% of trading took place. Understanding the Value Area can give traders valuable insight into market direction and establish the higher odds trade. It is an excellent addition to any system you may be using. Blahtech Limited presents their Market Profile indicator for the MetaTrader community. Ins
      QuantumEdge Trader
      Hossam Ali Ahmed Ali
      QuantumEdge Trader v1.0 AI-Powered Precision Signals for Serious Traders QuantumEdge Trader is a smart and reliable indicator that delivers accurate BUY and SELL signals using advanced market analysis and trend detection. Designed for M1 to M60 timeframes, it's ideal for scalping and intraday strategies. --- Key Features: No Repaint – Signals never change after appearing Smart trend filters to reduce noise Adjustable sensitivity and alerts Perfect for XAUUSD, EURUSD, and m
      We present you the indicator "Candle closing counter", which will become your indispensable assistant in the world of trading. That’s why knowing when the candle will close can help: If you like to trade using candle patterns, you will know when the candle will be closed. This indicator will allow you to check if a known pattern has formed and if there is a possibility of trading. The indicator will help you to prepare for market opening and market closure. You can set a timer to create a pre
      DracoAI
      Hua Manh Hung
      DracoAI is a revolutionary automated forex trading robot based on neural network.  Loss coverage is our premium exclusive feature. DracoAI IS: THE BEST MONEY MAKING SERVICE & STABLE PASSIVE INCOME PROFIT, EVEN IF YOU DO NOT PARTICIPATE IN BIDDING FINANCIAL INDEPENDENCE AND STABILITY DracoAI IS SAFE, BECAUSE: WE GUARANTEE THE SAFETY OF YOUR FUNDS NEGATIVE RESULTS OF TRADING ARE COVERED BY OUR RESERVE FUND 100% CONFIDENTIALITY Monitoring  - most popular signal at MQL5 :  https://www.mql5.com/en/s
      Magic Balance
      Daniil Evstratenko
      The indicator shows which trading pairs, strategies, robots and signals that you use are profitable and which are not. The statistic of trades and balance graph are displayed in the account currency and pips - to switch simply click on the graph. button "$"(top left) - minimize/expand and move the indicator panel button ">"(bottom right) - stretching and resetting to the original size Statistic of trades 1 line - account balance, current profit and lot of open trades; 2 line - the number of all
      For sure, this indicator has become very popular amongst traders. Through coding this indicator will give you the most accurate levels possible for your trading analysis. We have also added in the ability for you to receive alerts when the price breaks above or below a Support or Resistance lines! HOW TO USE The red rectangles represent your resistance/supply zone. The green rectangles represent your support/demand zone.  BONUS FEATURES We coded this indicator with the ability to switch between
      Easy Trade indicator
      Felipe Carvalho De Queiroz
      Easy Trade Indicator – Your Path to Profitable Trades! Work any Time Frame! Maximize your profits with precise and assertive trades! ️ Trade with comfort – the indicator does the analysis and you only open the order in the direction in which the indicator shows you!  Exclusive panel with past trade counter and accuracy tracking! Simplify your analysis, boost your performance, and trade with confidence! Get it now and take your trading to the next level
      Max LotSize
      Luis Alberto Atuncar Sanchez
      5 (2)
      LotSize Indicator Discover the appropriate lot size to use in your trades based on the available margin. This indicator provides valuable information for risk management. If the indicator shows a value of 0, it means that your balance or available margin is insufficient for trading. It is important to maintain adequate margin levels for safe trading practices. This indicator is exclusively designed for the MT4 platform, a popular and reliable trading platform in the market. With the LotSize Indi
      FREE
      Auto Fibo Pro m
      DMITRII GRIDASOV
      Indicatore "Auto FIBO Pro" Crypto_Forex: è un ottimo strumento ausiliario nel trading! - L'indicatore calcola e posiziona automaticamente sul grafico i livelli di Fibo e le linee di tendenza locali (colore rosso). - I livelli di Fibonacci indicano le aree chiave in cui il prezzo può invertirsi. - I livelli più importanti sono 23,6%, 38,2%, 50% e 61,8%. - Puoi usarlo per lo scalping di inversione o per il trading di zone grid. - Ci sono molte opportunità per migliorare il tuo sistema attuale us
      The indicator provides a superior alternative to price action analysis. It enables the identification of normalized patterns, which are then transformed into a graphical representation to forecast future steps within a time series. In the top-left corner, you'll find information regarding the expected prediction accuracy, determined through a complex MSQE calculation. You have the flexibility to adjust the time window, making it easy to validate the indicator's performance. Additionally, you can
      The trading statistics indicator notifies the trader of the aggregate income of the trading account for different time intervals. The indicator has wide display settings on the graph. There is a choice of one of the two display languages on the chart- English and Russian. Settings Indicator language (ENG, RUS) - Select the language to display on the chart; To control the magic (-1: any magic) - Entering the Magic for control (-1: any Magic); Angle of indicator tie - Selecting the angle of the c
      Welcome to S3S Trade Manager MT4, the best risk management tool available, created to improve the efficiency, accuracy, and intuitiveness of trading. This is a complete solution for smooth trade planning, position management, and improved risk control, not just a tool for placing orders. With flexibility across all markets, from forex and indices to commodities and cryptocurrency, S3S Trade Manager MT4 can accommodate your needs whether you're a novice making your first moves, an experienced tra
      Daily Candle Predictor è un indicatore che prevede il prezzo di chiusura di una candela. L'indicatore è destinato principalmente all'uso sui grafici D1. Questo indicatore è adatto sia per il trading forex tradizionale che per il trading di opzioni binarie. L'indicatore può essere utilizzato come sistema di trading autonomo o può fungere da aggiunta al sistema di trading esistente. Questo indicatore analizza la candela corrente, calcolando alcuni fattori di forza all'interno del corpo della cande
      Ticks Size
      Viktor Kolmakov
      This indicator displays in a separate window the difference between the number of points which increased the price, and the number of points that decreased the price during the time interval specified in the settings. The time interval for calculation is expressed as the number of bars of the chart the indicator is attached to. This approach allows you to evaluate the movement direction (growth or fall) of the instrument's price, the strength of the movement and the size of the movement in point
      Next level of trend trading here. Possibility 75%, the indicator analyzes the current market to determine short (small dot), middle (circle with a dot inside) and long (cross with a circle and a dot inside) trends.  Wingdings characters of  Aqua color represents the beginning of the UP trend. Wingdings characters of  Orange color represents the beginning of the DOWN trend. Possibility 75% Indicator will improve your trading in the world of forex, commodities, cryptocurrencies and indices.
      Reversal Monster Mini
      Abdulfattah Yahya Mohammed Alhazmi
      The Most advanced and comprehensive EA to trade Trend Reversals/Pullbacks It is a very profitable EA, to trade trends breakout, and manage trades, takeprofit, stoploss, move to breakeven, and trailing stop. The   “Reversal Monster EA”   trades Reversal/Pullbacks when the current price of the pair pullback to a predefined horizontal level or trendline on the currency chart. The opening of the position can be immediate after pullback to the drawn trendline or after closing the candle below/above
      FREE
      High Low Open Close MT4
      Alexandre Borela
      4.81 (21)
      Se ti piace questo progetto, lascia una recensione a 5 stelle. Questo indicatore disegna i prezzi aperti, alti, bassi e di chiusura per i specificati periodo e può essere regolato per un determinato fuso orario. Questi sono livelli importanti guardati da molti istituzionali e professionali commercianti e può essere utile per voi per conoscere i luoghi dove potrebbero essere più attivo. I periodi disponibili sono: Giorno precedente. Settimana precedente. Mese precedente. Precedente trimestre. A
      FREE
      Cosmic Diviner X Planet
      Olena Kondratenko
      4 (2)
      This unique multi-currency strategy simultaneously determines the strength of trends and market entry points, visualizing this using histograms on the chart. The indicator is optimally adapted for trading on the timeframes М5, М15, М30, Н1. For the convenience of users, the indicator renders the entry point (in the form of an arrow), recommended take profit levels (TP1, TP2 with text labels) and the recommended Stop Loss level. The take profit levels (TP1, TP2) are automatically calculated for
      The indicator allows you to trade binary options. The recommended time frame is М1 and the expiration time is 1,2,3 minutes. The indicator suitable for auto and manual trading. A possible signal is specified as a arrows above/under a candle. You should wait until the candle closes! Arrows are not re-painted Trade sessions: TOKYO section (Half-end) Currency pairs: USD/JPY Working time frame: M1 Expiration time: 1,2,3 minutes. The indicator also shows good results when using the martingale strateg
      FREE
      Volume Compair
      Thiago Pereira Pinho
      Professional Cumulative Delta & Volume Median Indicator Track   real buying/selling pressure   with this powerful volume analysis tool. The   Volume Compare Indicator   combines   Cumulative Delta   and   Volume Medians   to help you identify institutional activity, imbalances, and potential reversals. Key Features: Cumulative Delta Histogram   – Visualizes net buying vs. selling volume in real-time. Buy/Sell Volume Medians   – Horizontal lines showing average buy & sell volume levels. Smart Vo
      PipFinite Exit EDGE
      Karlo Wilson Vendiola
      4.83 (115)
      Did You Have A Profitable Trade But Suddenly Reversed? In a solid strategy, exiting a trade is equally important as entering. Exit EDGE helps maximize your current trade profit and avoid turning winning trades to losers. Never Miss An Exit Signal Again Monitor all pairs and timeframes in just 1 chart www.mql5.com/en/blogs/post/726558 How To Trade You can close your open trades as soon as you receive a signal Close your Buy orders if you receive an Exit Buy Signal. Close your Sell orders if
      Gli utenti di questo prodotto hanno anche acquistato
      FFx Engulfing Setup Alerter gives trade suggestions with Entry, Target 1, Target 2 and StopLoss. Below are the different options available: Entry suggestion - pips to be added over the break for the entry 3 different options to calculate the SL - by pips, by ATR multiplier or at the pattern High/Low 3 different options to calculate the 2 TPs - by pips, by ATR multiplier or at Risk/Reward Offset the dashboard - any place on the chart Remove the suggestion once the price reached the SL line Lines
      FFx InsideBar Setup Alerter gives trade suggestions with Entry, Target 1, Target 2 and StopLoss. Below are the different options available: Entry suggestion - pips to be added over the break for the entry Minimum candle size - to avoid too close buy/sell entry suggestions 3 different options to calculate the SL - by pips, by ATR multiplier or at the pattern High/Low 3 different options to calculate the 2 TPs - by pips, by ATR multiplier or at Risk/Reward Offset the dashboard - any place on the c
      FFx OutsideBar Setup Alerter gives trade suggestions with Entry, Target 1, Target 2 and StopLoss. Below are the different options available: Entry suggestion - pips to be added over the break for the entry. 3 different options to calculate the SL - by pips, by ATR multiplier or at the pattern High/Low. 3 different options to calculate the 2 TPs - by pips, by ATR multiplier or at Risk/Reward. Offset the dashboard - any place on the chart. Remove the suggestion once the price reached the SL line.
      FFx PinBar Setup Alerter gives trade suggestions with Entry, Target 1, Target 2 and StopLoss. Below are the different options available: Entry suggestion - pips to be added over the break for the entry Minimum candle size - to avoid too small candles 3 different options to calculate the SL - by pips, by ATR multiplier or at the pattern High/Low 3 different options to calculate the 2 TPs - by pips, by ATR multiplier or at Risk/Reward Offset the dashboard - any place on the chart Remove the sugges
      The purpose of this new version of the MT4 standard indicator provided in your platform is to display in a sub-window multiple timeframes of the same indicator with its divergences. See the example shown in the picture below. But the display isn't like a simple MTF indicator. This is the real display of the indicator on its timeframe. Here's the options available in the FFx divergences indicator: Select the timeframes to be displayed (M1 to Monthly) Define the width (number of bars) for each tim
      The purpose of this new version of the MT4 standard indicator provided in your platform is to display in a sub-window multiple timeframes of the same indicator with its divergences. See the example shown in the picture below. But the display isn't like a simple MTF indicator. This is the real display of the indicator on its timeframe. Here's the options available in the FFx divergences indicator: Select the timeframes to be displayed (M1 to Monthly) Define the width (number of bars) for each tim
      The purpose of this new version of the MT4 standard indicator provided in your platform is to display in a sub-window multiple timeframes of the same indicator with its divergences. See the example shown in the picture below. But the display isn't like a simple MTF indicator. This is the real display of the indicator on its timeframe. Here's the options available in the FFx divergences indicator: Select the timeframes to be displayed (M1 to Monthly) Define the width (number of bars) for each tim
      The purpose of this new version of the MT4 standard indicator provided in your platform is to display in a sub-window multiple timeframes of the same indicator with its divergences. See the example shown in the picture below. But the display isn't like a simple MTF indicator. This is the real display of the indicator on its timeframe. Here's the options available in the FFx divergences indicator: Select the timeframes to be displayed (M1 to Monthly). Define the width (number of bars) for each ti
      The purpose of this new version of the MT4 standard indicator provided in your platform is to display in a sub-window multiple timeframes of the same indicator with its divergences. See the example shown in the picture below. But the display isn't like a simple MTF indicator. This is the real display of the indicator on its timeframe. Here's the options available in the FFx divergences indicator: Select the timeframes to be displayed (M1 to Monthly). Define the width (number of bars) for each ti
      The FFx Dashboard MTF alerter will show you on a single chart all the timeframes (M1 to Monthly) with their own status for the indicator. 2 Alert Options: Single timeframe: each selected timeframe alert separately when a signal occurs Multi timeframes: all selected timeframes must agree for an alert to be triggered Both options have an input to select the timeframes to be used for the alert(s). How to Understand the Status: Green/Red square: histogram above/below 0 line Green square + Red bord
      The FFx Dashboard MTF alerter will show you on a single chart all the timeframes (M1 to Monthly) with their own status for the indicator. 2 Alert Options: Single timeframe: each selected timeframe alert separately when a signal occurs Multi timeframes: all selected timeframes must agree for an alert to be triggered Both options have an input to select the timeframes to be used for the alert(s). How to understand the status: Green/Red square: RSI above/below 50 line Green square + Red border: R
      The FFx Dashboard MTF alerter will show you on a single chart all the timeframes (M1 to Monthly) with their own status for the indicator. 2 Alert Options: Single timeframe: each selected timeframe alert separately when a signal occurs Multi timeframes: all selected timeframes must agree for an alert to be triggered Both options have an input to select the timeframes to be used for the alert(s). How to understand the status: Green/Red square: Stoch above/below 50 line Green square + Red border:
      The FFx Dashboard MTF alerter will show you on a single chart all the timeframes (M1 to Monthly) with their own status for the indicator. 2 Alert Options: Single timeframe: each selected timeframe alert separately when a signal occurs Multi timeframes: all selected timeframes must agree for an alert to be triggered Both options have an input to select the timeframes to be used for the alert(s). How to understand the status: Green/Red square: Price above/below Cloud (Kumo) Green square + Red bo
      The FFx Dashboard MTF alerter will show you on a single chart all the timeframes (M1 to Monthly) with their own status for the indicator. 2 Alert Options: Single timeframe: each selected timeframe alert separately when a signal occurs Multi timeframes: all selected timeframes must agree for an alert to be triggered Both options have an input to select the timeframes to be used for the alert(s). How to understand the status: Green/Red square: MA pointing Up/Down Green square + Red border: MA po
      The FFx Dashboard MTF alerter will show you on a single chart all the timeframes (M1 to Monthly) with their own status for the indicator. 2 Alert Options: Single timeframe: each selected timeframe alert separately when a signal occurs. Multi timeframes: all selected timeframes must agree for an alert to be triggered. Both options have an input to select the timeframes to be used for the alert(s). How to understand the status: Green square: Price above PSAR Red square: Price below PSAR Options
      The FFx Dashboard MTF alerter will show you on a single chart all the timeframes (M1 to Monthly) with their own status for the indicator. 2 Alert Options: Single timeframe: each selected timeframe alert separately when a signal occurs Multi timeframes: all selected timeframes must agree for an alert to be triggered Both options have an input to select the timeframes to be used for the alert(s). How to understand the status: Green/Red square: CCI above/below levels (ie. 100/-100) Grey square: C
      The FFx Dashboard MTF alerter will show you on a single chart all the timeframes (M1 to Monthly) with their own status for the indicator. 2 Alert Options: Single timeframe: each selected timeframe alert separately when a signal occurs Multi timeframes: all selected timeframes must agree for an alert to be triggered Both options have an input to select the timeframes to be used for the alert(s). How to understand the status: Green/Red square: ADX above level Grey square: ADX below level Red bor
      The FFx Dashboard MTF alerter will show you on a single chart all the timeframes (M1 to Monthly) with their own status. 2 Alert Options: Single timeframe: each selected timeframe alert separately when a signal occurs Multi timeframes: all selected timeframes must agree for an alert to be triggered Both options have an input to select the timeframes to be used for the alert(s). How to understand the status: Green/Red square: bullish/bearish candle Options available in the FFx Dashboard Alerter
      The [GRAFF] III manual trading system is based on multiple MetaTrader (MT4) indicators. Together, the entire PACK of GRAFF III indicators makes an advanced trading tool. The system consists of over 20 different custom-built indicators which have been carefully selected and tested in the long term to produce strong and efficient trading signals. The particular indicators are based on different mathematical formulas, so the entire system is calibrated to remove false signals from its own indicator
      FFx Universal Strength Meter PRO is more than a basic strength meter. Instead of limiting the calculation to price, it can be based on any of the 19 integrated strength modes + 9 timeframes. With the FFx USM, you are able to define any period for any combination of timeframes. For example, you can set the dashboard for the last 10 candles for M15-H1-H4… Full flexibility! Very easy to interpret... It gives a great idea about which currency is weak and which is strong, so you can find the best pai
      FFx Basket Scanner
      Eric Venturi-Bloxs
      MetaTrader 5 version available here : https://www.mql5.com/en/market/product/24882 FFx Basket Scanner is a global tool scanning all pairs and all timeframes over up to five indicators among the 16 available. You will clearly see which currencies to avoid trading and which ones to focus on. Once a currency goes into an extreme zone (e.g. 20/80%), you can trade the whole basket with great confidence. Another way to use it is to look at two currencies (weak vs strong) to find the best single pairs
      MetaTrader 5 version available here: https://www.mql5.com/en/market/product/25794 FFx Pivot SR Suite PRO is a complete suite for support and resistance levels. Support and Resistance are the most used levels in all kinds of trading. Can be used to find reversal trend, to set targets and stop, etc. The indicator is fully flexible directly from the chart 4 periods to choose for the calculation: 4Hours, Daily, Weekly and Monthly 4 formulas to choose for the calculation: Classic, Camarilla, Fibonac
      Sweet Waffle
      Christophe Godart
      The arrows are calculated with: -     2 Parabolic  parameters -     2 ADX parameters -     4 Stochastic parameters We recommend to combine it with Parabolic, ZigZag or Elliot waves indicator. Always trade the trend! If you make sure to draw your trend lines and support/resistance zones you will just have to wait for the signal to appear. Take the trade. For Binary Options it is advisable to set the expiry time to 5-15 min in M1 chart. THIS INDICATOR IS ZERO REPAINT Best assets to trade: - EUR
      Let´s try to make some real money! Call me profit addicted. I thought why not try to make THE dream come reality. With discipline, a clear strategy and this indicator I focus on entering the perfect trades. This indicator is very easy to use as you will get perfect entry points for Put or Call trades. The arrows are calculated with: -     Momentum  parameters -     Candle stick patterns -     Fundamental Price action We recommend to combine it with Parabolic, ZigZag or Elliot waves indicator
      Golden Chip
      Daishon Cotman
      Golden Chip provides Basic Market Structure, Fibonacci, supply and Demand Zones. Letting you identify when a sell off point is approaching or whne a buy opportunity is arriving. The awesome thing about Golden Chip is that, you will see rejection levels or continuation before ANYBODY ! This indicator moves directly with price and lines up perfectly with the Chart. Some indicators would lag but NOT this one ! Golden Chip is amazing for Clean chart (Naked Chart). GOLDEN CHIP IS ONLY ON METATRADER (
      Indicador MTXPRO
      Matheus Silva De Castro
      PROMOÇÃO LIMITADA, NA COMPRA DE 1 INDICADOR VOCÊ LEVA CLUBINARIAS 6.0 , 5.1 e DonForex DE BRINDE!! ATÉ FINAL DO MÊS! -NA HORA DA COMPRA SELECIONAR COMBINAR COM O VENDEDOR OU BUSCAR PESSOALMENTE, A ENTREGA É DIGITAL EM POUCOS SEGUNDOS ==> VEJA O VIDEO PARA TIRAR AS SUAS DUVIDAS <== ==> VÍDEO OPERANDO NO YOUTUBE ROBÔ FEITO COM MUITO ESFORÇO E CARINHO E QUE ESTA TRAZENDO ÓTIMOS LUCROS APESAR DE EXISTIREM PESSOAS QUE APENAS VENDEM ROBÔS FAKES DE OPERAÇÕES , ACREDITO QUE SERIA MUITO BOM DA MI
      This is a Dashboard Indicator based on Bruce's Price Predictor Indicator . This Dashboard will Give you a visual to see the trend direction without having to flip through timeframes, so you can always be trading in direction of the trend, with little effort.  I Recommend   www.CoinexxBroker.com  as a great broker and the one I personally use *Non-Repainting Dashboard Arrows *For Desktop MT4 Only *Great For Scalping *Great For Swing Trading *Dashboard Arrow Entry Alerts *Dashboard Arrow Signals
      Scalper trend giornaliero (DTS) DTS è un indicatore di tendenza giornaliero che utilizza Price Action, Dynamic Support e Resistances. È progettato per essere utilizzato da chiunque, anche il principiante assoluto nel trading può usarlo. NON ridipinge MAI. Le indicazioni sono date da vicino a vicino. Progettato per essere utilizzato da solo, non sono necessari altri indicatori. Ti dà la tendenza e il potenziale Take Profit all'inizio della giornata. Come funziona DTS utilizza una strategia di
      ***** The REAL , ORIGINAL, Non-Repainting, Non-Delaying, Arrow Trade Entry indicator for Very Low-Risk market execution ***** ***This is the Golden standard in arrow indicators for MT4.*** BING Setup Arrows Indicator(BSA) will show easy-to-read High Probability trading situations with Non-Repainting , Non-Delaying , Up or Down arrows on the graph.  So simple, it's brilliant. Always shows very good trading setups, no flashy colors, confusing configurations, hard-to-read dashboards, etc.  Perfec
      ****** Easy to understand, correct Trade direction indicator, quick and easy to visualize******* BING Proper Path Indicator(BPP) will show BUY/SELL signals on-screen in an easy-to-understand 'Traffic Light' format. Provides a final 'reassurance' and 'peace of mind' for taking an educated, high probability, low-risk, trade decision. In the same way, you use a rearview mirror for instantaneous information while taking a driving decision, the same way BING Proper Path Indicator(BPP) will help you
      Altri dall’autore
      This is a mini One pair version of Advanced Detector of Trend Reversal and Continuance known as TrueTrendStarM(TTSm25). It is a sensitive and Predictive indicator of Price Trends for Professional traders.  ( ATTENTION BUYERS:-Now the indicator is available for UNLIMITED TIME ONE TIME buy of just $500 ). Avail the Opportunity.    It detects high odds changes in Price Trend direction long before other indicator detects it. I have been working on it since 2019.    This is possible due to fractal
      Filtro:
      Nessuna recensione
      Rispondi alla recensione