Pivots Levels

Summary

This indicator plots multiple pivot points (support and resistance levels) using various calculation methods, allows customization of their appearance, and can alert when price touches these levels. It works on different timeframes and can display historical levels or just the current ones.

Overview

  • Purpose: Plots dynamic pivot levels (Pivot, S1-S4, R1-R4) on the chart to help identify potential price reversal zones.

  • Key Features:

    • Supports 7 calculation methods (Classic, Camarilla, Woodie, Fibonacci, etc.).

    • Displays levels either for the current period (Today) or historically across past bars.

    • Customizable visuals (colors, line styles, widths) and alerts for price touches.

Input Parameters

  1. Timeframe: Choose the base period for calculating pivots (e.g., Daily, Weekly).

  2. Calculation Mode:

    • Classic 1/2: Traditional (H+L+C)/3 formula with derived support/resistance.

    • Camarilla: Uses previous close and range for tighter levels.

    • Woodie: Incorporates the current open price.

    • Fibonacci/Fibonacci Retracement: Applies Fib ratios to the prior period's range.

    • Floor: Modified classic formula with additional levels.

  3. Display Mode: Show levels for the current period or historical bars.

  4. Visual Customization: Toggle labels, price tags, line colors/styles/widths.

  5. Alerts: Trigger popups, emails, sounds, or notifications when price touches levels.

Indicator Logic

  1. Data Handling:

    • Uses historical price data (High, Low, Close, Open) from the selected timeframe.

    • Adjusts for weekends if  Include Sundays  is disabled.

    • For historical mode, plots levels on past bars; for today mode, draws horizontal lines extending into the future.

  2. Calculation Methods:

    • 1. Classic 1

      Formula:

      • Pivot (PP) = (High + Low + Close) / 3

      • R1 = 2*PP - Low

      • S1 = 2*PP - High

      • R2 = PP + (High - Low)

      • S2 = PP - (High - Low)

      • R3 = R2 + (High - Low)

      • S3 = S2 - (High - Low)

      Key Features:

      • Most widely used traditional method.

      • Focuses on the previous period's price range.

      • Levels expand symmetrically from the pivot.

      Usage:

      • Best for daily/weekly charts to identify mid-term support/resistance.

      2. Classic 2

      Formula:

      • Pivot (PP) = (High + Low + Close + Open) / 4

      • R1 = 2*PP - Low

      • S1 = 2*PP - High

      • R2 = PP + (High - Low)

      • S2 = PP - (High - Low)

      • R3 = PP + 2*(High - Low)

      • S3 = PP - 2*(High - Low)

      Key Features:

      • Incorporates the open price into the pivot calculation.

      • Produces slightly different levels than Classic 1.

      Usage:

      • Suitable for markets where the opening price is significant (e.g., futures).

      3. Camarilla

      Formula:

      • R1 = Close + 1.1/12*(High - Low)

      • S1 = Close - 1.1/12*(High - Low)

      • R2 = Close + 1.1/6*(High - Low)

      • S2 = Close - 1.1/6*(High - Low)

      • R3 = Close + 1.1/4*(High - Low)

      • S3 = Close - 1.1/4*(High - Low)

      • R4 = Close + 1.1/2*(High - Low)

      • S4 = Close - 1.1/2*(High - Low)

      • PP = (R1 + S1) / 2

      Key Features:

      • Focuses on the previous close and tight intraday ranges.

      • Levels cluster closer to the price, ideal for short-term trading.

      Usage:

      • Popular for intraday trading (e.g., scalping on 5M/15M charts).

      4. Woodie

      Formula:

      • Pivot (PP) = (High + Low + 2*Open) / 4

      • R1 = 2*PP - Low

      • S1 = 2*PP - High

      • R2 = PP + (High - Low)

      • S2 = PP - (High - Low)

      • R3 = High + 2*(PP - Low)

      • S3 = Low - 2*(High - PP)

      Key Features:

      • Emphasizes the current day's open price.

      • Levels adjust dynamically with price action.

      Usage:

      • Effective in trending markets for intraday breakouts.

      5. Fibonacci

      Formula:

      • Pivot (PP) = (High + Low + Close) / 3

      • R1 = PP + 0.382*(High - Low)

      • R2 = PP + 0.618*(High - Low)

      • R3 = PP + 1.0*(High - Low)

      • S1 = PP - 0.382*(High - Low)

      • S2 = PP - 0.618*(High - Low)

      • S3 = PP - 1.0*(High - Low)

      Key Features:

      • Applies Fibonacci ratios to the prior period's range.

      • User can customize ratios (default: 38.2%, 61.8%, 100%).

      Usage:

      • Ideal for identifying retracement zones in swing trading.

      6. Floor

      Formula:

      • Pivot (PP) = (High + Low + Close) / 3

      • R1 = 2*PP - Low

      • S1 = 2*PP - High

      • R2 = PP + (High - Low)

      • S2 = PP - (High - Low)

      • R3 = R1 + (High - Low)

      • S3 = Low - 2*(High - PP)

      Key Features:

      • Derived from classic formula but adds unique R3/S3 calculations.

      • Levels expand asymmetrically.

      Usage:

      • Useful in volatile markets to capture extended price moves.

      7. Fibonacci Retracement

      Formula:

      • PP = Low + 0.5*(High - Low)

      • R1 = Low + 0.618*(High - Low)

      • R2 = Low + 0.786*(High - Low)

      • R3 = High

      • S1 = Low + 0.382*(High - Low)

      • S2 = Low + 0.236*(High - Low)

      • S3 = Low

      Key Features:

      • Based purely on Fibonacci retracement levels of the prior range.

      • Pivot (PP) acts as the 50% retracement level.

      Usage:

      • Best for counter-trend strategies to spot pullback entries.

      Key Takeaways:

      • Classic Methods: Balance simplicity and symmetry.

      • Camarilla/Woodie: Optimized for intraday trading with tighter levels.

      • Fibonacci-Based: Align with harmonic patterns and retracements.

      • Customization: Users can adjust Fibonacci ratios and toggle levels.

      Each method caters to specific trading styles, from scalping (Camarilla) to swing trading (Fibonacci). The choice depends on market conditions, timeframe, and strategy goals.

    • Visualization:

      • Draws trend lines for each level.

      • Adds price tags and text labels for clarity.

      • Updates buffers to display/hide levels based on user toggles.

    • Alerts:

      • Monitors price crossings of pivot levels.

      • Triggers alerts via multiple channels (popup, email, sound) when a level is breached.

    Usage Scenarios

    • Day Trading: Use intraday timeframes (e.g., 1H) with Camarilla for short-term reversals.

    • Swing Trading: Apply Fibonacci levels on Daily charts to identify key zones.

    • Backtesting: Analyze historical pivot reactions in historical display mode.

    Advantages

    • Flexibility: Multiple calculation methods cater to different trading styles.

    • Customization: Full control over appearance and alerts.

    • Multi-Timeframe: Works on any timeframe, even if higher than the chart’s period.

    Limitations

    • Repainting in Historical Mode: Levels are drawn on past bars, which might not reflect real-time conditions.

    • Weekend Gaps: May require adjustment for markets that close over weekends.
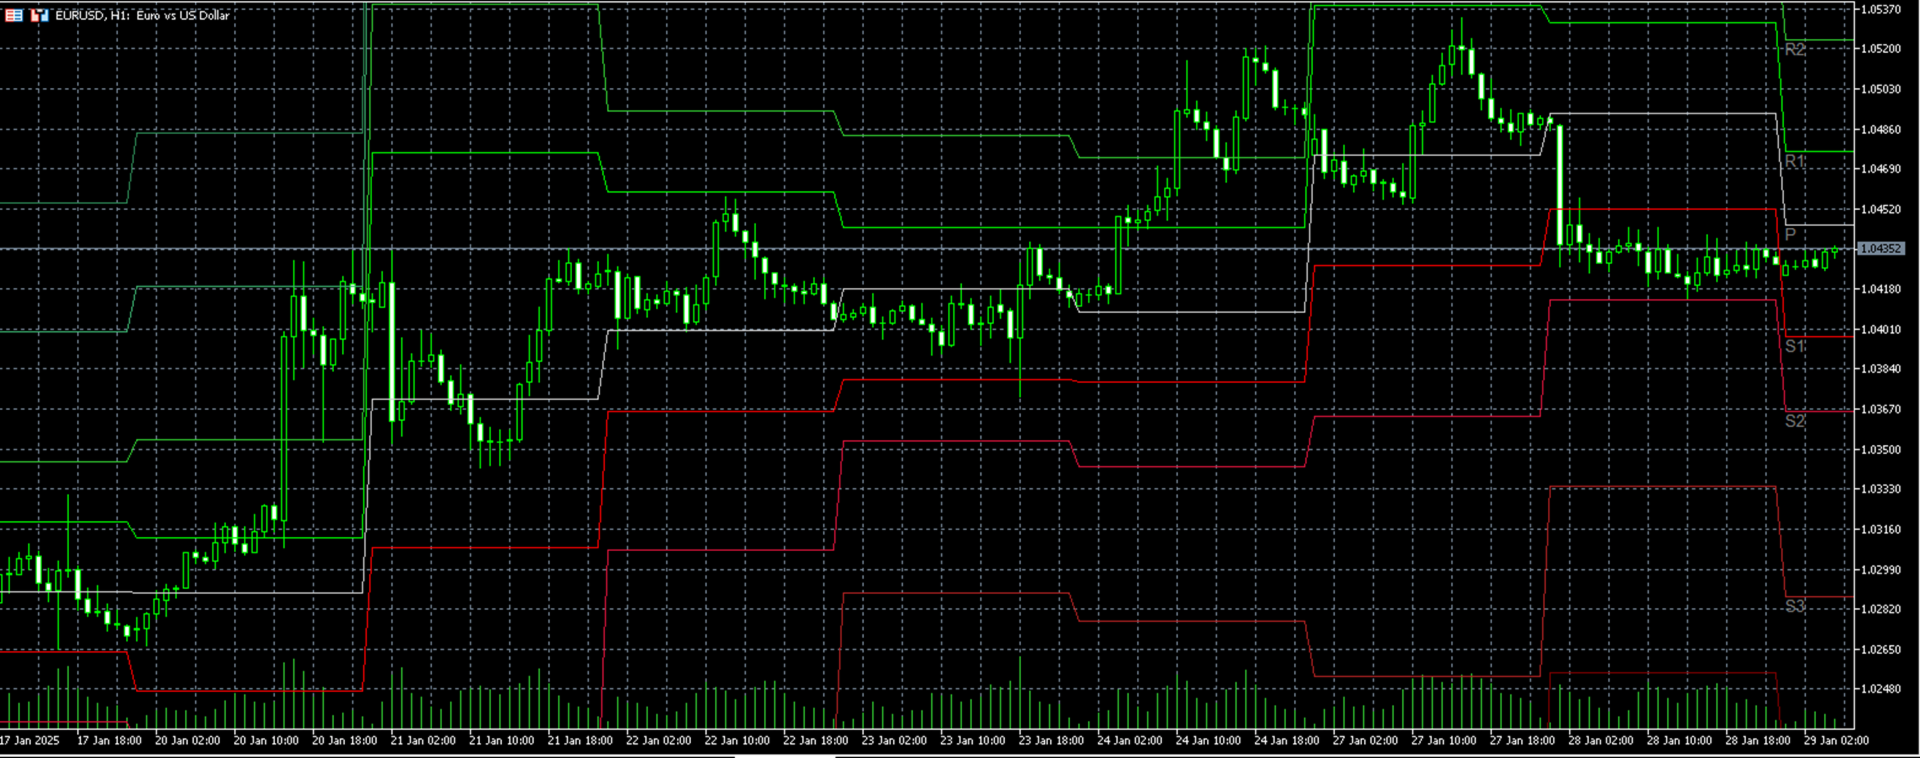
    Example Output

    • Chart Display: Horizontal lines labeled P, S1-S4, R1-R4 with customizable styles.

    • Alert: "EURUSD (Cam Daily) - R1 (1.1850) touched" sent via email/popup.


    Prodotti consigliati
    Ottieni l’indicatore AUX GRATUITO, il supporto EA e la guida completa, visita per favore – https://www.mql5.com/en/blogs/post/763955 Individua la tendenza. Leggi il pattern. Cronometra l'ingresso. 3 passaggi in meno di 30 secondi! Opera senza sforzo — nessuna analisi richiesta, il tuo assistente intelligente è pronto a semplificare il tuo flusso di lavoro Basta sovraccarico di grafici. Opera con fiducia utilizzando il rilevamento intelligente del bias. Compatibile con tutte le valute, criptova
    The indicator is designed to work on any trading platform. The program is based on proprietary algorithms and W.D.Ganna's mathematics, allowing you to calculate target levels of price movement based on three points with the highest degree of certainty. It is a great tool for stock trading. The indicator has three buttons: NEW - call up a triangle for calculation. DEL - delete the selected triangle. DELS - completely remove all constructions. The probability of achieving the goals is more than 80
    The indicator builds a graphical analysis based on the Fibonacci theory. Fibo Fan is used for the analysis of the impulses and corrections of the movement. Reversal lines (2 lines at the base of the Fibonacci fan) are used to analyze the direction of movements. The indicator displays the of 4 the target line in each direction. The indicator takes into account market volatility. If the price is above the reversal lines, it makes sense to consider buying, if lower, then selling. You can open posi
    Indicatore Balance of Power (BOP) con supporto multi-timeframe, segnali visivi personalizzabili e sistema di avvisi configurabile. I servizi di programmazione freelance, gli aggiornamenti e altri prodotti TrueTL sono disponibili nel mio profilo MQL5 . Feedback e recensioni sono molto apprezzati! Cos'è il BOP? Balance of Power (BOP) è un oscillatore che misura la forza degli acquirenti rispetto ai venditori confrontando la variazione del prezzo con il range della candela. L'indicatore viene ca
    FREE
    Double HMA MTF for MT5
    Pavel Zamoshnikov
    4 (4)
    This is an advanced multi-timeframe version of the popular Hull Moving Average (HMA) Features Two lines of the Hull indicator of different timeframes on the same chart. The HMA line of the higher timeframe defines the trend, and the HMA line of the current timeframe defines the short-term price movements. A graphical panel with HMA indicator data from all timeframes at the same time . If the HMA switched its direction on any timeframe, the panel displays a question or exclamation mark with a tex
    Summary (What Changed & Why It Matters) Traditional FVG indicators suffer from three structural flaws : Detection and mitigation are coupled Wicks and bodies are treated identically Partial mitigation is not preserved This indicator introduces a new FVG model where: Detection ≠ Mitigation Wick interaction ≠ Body acceptance FVGs decay progressively , not instantly This transforms FVGs from a static drawing tool into a dynamic price-acceptance model .
    All Harmonics 26
    Alexey Isavnin
    3.5 (4)
    Harmonic patterns are characteristic series of price movements with respect to Fibonacci levels, which statistically precede price reversals. This indicator searches for harmonic patterns. It is capable of recognising 26 classical and non-classical harmonic patterns : Classical Gartley Butterfly Alternate Butterfly Bat Alternate Bat Crab Deep Crab Three Drives Non-classical Shark Alternate Shark Cypher 5-0 Anti Gartley Anti Butterfly Anti Alternate Butterfly Anti Bat Anti Alternate Bat Anti Crab
    Looking for reliable levels on a price chart? Already tired of searching for similar indicators? Are the levels not working out as they should? Then this is the indicator for you. Volume Prices Universal is a reliable indicator of horizontal volumes. What does it show? First of all, the main idea of ​​the indicator is to display at which price mark the price has been for the longest time. Thus, the display of price volumes on the price chart is formed. With the help of which you can very simpl
    DoctorEdge V-LINE (Pump it & Dump it) Strategy Pro Confirms trend direction using smart momentum logic and key price behavior How It Works DoctorEdge V-LINE is a smart visual indicator designed to detect trend impulses and confirm their strength based on how price reacts around certain dynamic zones. Buy Trend: When price reaches level -20 , the line turns green , signaling a potential buy . If price breaks above level 0 and the line stays green, the uptrend is confirmed . If price doe
    Gold Trader Pro is an advanced analytical tool specifically engineered for professional trading on XAUUSD (Gold). It provides an immediate comprehensive overview of market structure across 7 different timeframes, allowing traders to identify flow direction and signal strength through a modern, draggable, and interactive interface. Key Features Multi-Timeframe Analysis: Real-time monitoring of M1, M5, M15, M30, H1, H4, and D1. Two Operational Modes: MODE_SCALPING: Optimized for fast-paced analys
    FREE
    Renko System
    Marco Montemari
    This indicator can be considered as a trading system. It offers a different view to see the currency pair: full timeless indicator, can be used for manual trading or for automatized trading with some expert advisor. When the price reaches a threshold a new block is created according to the set mode. The indicator beside the Renko bars, shows also 3 moving averages. Features renko mode median renko custom median renko 3 moving averages wicks datetime indicator for each block custom notification
    https://youtu.be/JJanqcNzLGM ,  https://youtu.be/l70MIHaQQa4 ,  https://youtu.be/pg0oiT5_8y0   Automated Supply and Demand Trading Edge MT5. These videos demonstrate how we apply the supply and demand system to our latest trading review and market analysis Enhance your Trading Strategy with the Supply and Demand Trading Edge MT5. Gain a competitive market advantage with the Supply and Demand Trading Edge MT5 indicator, a powerful tool that combines MACD signals with supply and demand zones. By
    ChanLun Ind
    Jing Cheng Liu
    ChanLun Ind - 缠论自动画线系统 交易辅助 • 精准绘制 • 结构清晰 产品简介 ChanLun Ind 是一款基于传奇交易理论“缠论”开发的 MT5 指标。它旨在帮助缠论学习者和交易者快速画出符合缠论形态的 上涨 、 下跌 和 中枢结构 。 本指标严格遵循缠中说禅《教你炒股票》108课中的数学定义,通过计算机算法自动、精确地处理 K 线包含关系,绘制出 “笔”与“中枢” 。无论您是缠论初学者,还是资深交易员,它都能让您从繁杂的画图中解放出来,专注于市场结构的分析与交易决策。 引言:什么是《缠论》(ChanLun)? 缠论 (缠中说禅技术分析理论)是一套系统性的技术分析方法。其核心目标只有一句话: “用严格的几何结构,描述价格运动的内在逻辑,从而实现可重复、可验证的交易决策。” 为快速上手该指标,您可以优先了解以下核心概念: 走势类型 :价格走势只表现为 上涨、下跌、盘整。 笔 (Bi/Pen) :由相邻顶分型与底分型连接而成的最小走势单位。 中枢 (Pivot/ZhongShu) :至少三段重叠的价格区间,代表市场的震荡核心(类似箱体)。 线段 (Segm
    Indicatore Average True Range (ATR) con supporto multi-timeframe, segnali visivi personalizzabili e sistema di alert configurabile. Servizi di programmazione freelance, aggiornamenti e altri prodotti TrueTL sono disponibili sul mio profilo MQL5 . Feedback e recensioni sono molto apprezzati! Cos'è l'ATR? L'Average True Range (ATR), sviluppato da J. Welles Wilder, è un indicatore tecnico che misura la volatilità del mercato. Calcola la media del True Range su un periodo specificato. Il True Ran
    FREE
    Order_Blocks_LBW Pro Indicator. Video shows OB_Pairs=2; and this means when one OB is broken a new OB appears immediately.   Update to Version 1.01, User nth candle extend OB's to the right of open candle and added debug for candle extend. Update to internal tf usage only. Indicator remains MTF. A pure candle‑based Order Block engine with multi‑timeframe scanning, POI logic, and full visual control. I hope to be releasing real TVI that is as close to original MT4 style as possible, once pass
    AdvancedForecasterPro
    Le Parquet Trading Floor
    Panoramica Advanced Key Levels Predictor EA è un Expert Advisor sofisticato per MetaTrader 5 che combina analisi tecnica avanzata con algoritmi predittivi per identificare i livelli chiave del mercato e prevedere i futuri movimenti di prezzo. Questo EA offre capacità di visualizzazione complete con indicatori chiari per aiutare i trader a prendere decisioni informate. Funzionalità principali Rilevamento livelli chiave Livelli di supporto e resistenza : rilevamento automatico di livelli signif
    SMC Guardian
    Mohammed Mamdouh Abdel Fattah Mohammed El Sayed
    5 (1)
    GUARDIAN: The Ultimate Trend & Security Indicator GUARDIAN is a sophisticated technical analysis tool designed for traders who prioritize precision and capital preservation. This indicator acts as a vigilant protector of your trades, filtering market noise and identifying high-probability trend reversals with institutional-grade accuracy. Core Features: Adaptive Trend Detection: Utilizes advanced algorithms to detect market shifts before they become obvious. Smart Risk Management: Built-in signa
    FREE
    Auto Optimized RSI   è un indicatore a freccia intelligente e facile da usare, progettato per fornire segnali di acquisto e vendita precisi. Utilizza simulazioni di trading su dati storici per individuare automaticamente i livelli RSI più efficaci per ogni strumento e timeframe. Questo indicatore può essere utilizzato come sistema di trading autonomo o integrato nella tua strategia esistente, ed è particolarmente utile per i trader a breve termine. A differenza dei livelli fissi tradizionali del
    Price Magnet — Price Density and Attraction Levels Indicator Price Magnet is a professional analytical tool designed to identify key support and resistance levels based on statistical Price Density. The indicator analyzes a specified historical period and detects price levels where the market spent the most time. These zones act as “magnets,” attracting price action or forming a structural base for potential reversals. Unlike traditional Volume Profile tools, Price Magnet focuses on price-time d
    Support & Resistance indicator is a modification of the standard Bill Williams' Fractals indicator. The indicator works on any timeframes. It displays support and resistance levels on the chart and allows setting stop loss and take profit levels (you can check the exact value by putting the mouse cursor over the level). Blue dashed lines are support level. Red dashed lines are resistance levels. If you want, you can change the style and color of these lines. If the price approaches a support lev
    Doctor Edge Strategy Pro – Range & Breakout Zones Doctor Edge Strategy Pro is a professional indicator designed to simplify market reading based on range and breakout zones. It combines concepts of Price Action, ICT, and Smart Money Concepts, providing an automated and precise approach for traders of synthetic indices, cryptocurrencies, and Forex pairs. How It Works Doctor Edge Strategy Pro automatically draws on the chart: The range zone (lateral accumulation); The upper breakout zone (gr
    L'indicatore costruisce le quotazioni attuali, che possono essere confrontate con quelle storiche e su questa base fanno una previsione del movimento dei prezzi. L'indicatore ha un campo di testo per una rapida navigazione fino alla data desiderata. Opzioni: Simbolo - selezione del simbolo che visualizzerà l'indicatore; SymbolPeriod - selezione del periodo da cui l'indicatore prenderà i dati; IndicatorColor - colore dell'indicatore; HorisontalShift - spostamento delle virgolette disegnate d
    ENGLISH DESCRIPTION (MQL5 Standard Optimized) Product Name: Obsidian Forest Automaton AI (MT5) [Subtitle: Forest Structure | Obsidian Blade TEMA | Shield Safety] Introduction Obsidian Forest Automaton AI is a structural trend-following construct designed to navigate the market with the cold precision of an automaton. It builds a "Forest Structure" using Ichimoku Cloud , cuts through noise with the Obsidian Blade (TEMA) , and validates density with Standard Deviation . This creates a system that
    Chanlun
    Xiaonong Yu
    The ChanLun or Chan theory is one of the most popular trading theories in China. But it seems like that it has little influence in western countries. Actually, the Chan Theory is based on a sophisticated mathematical model. The basic idea ChanLun is to simplify the bar chart by its model. With the help of ChanLun, a trader can analyze and predict the trend of future goods, stocks. In ChanLun, there are several basic elements called fractals, strokes, line segments and pivots . A trader should pa
    RAD CRITICAL LEVES RAD indicator tracks “Relevant Volume” in real time, identifying accumulation and distribution processes, projecting them in the chart as SUPPORT or RESISTANCE zones. Natural   support   and resistance levels are generated by Volume Accumulation and Distribution processes. As these processes evolve, levels at which the relevant volume in the market place is positioned, become difficult areas to cross upwards or downwards. By using this information, traders can identify very s
    PREngulfing
    Slobodan Manovski
    PR EA - Engulfing Pattern Trading System Automated Engulfing Pattern Detection with MA Confirmation The PR EA is a Meta Trader 5 expert advisor that identifies and trades bullish/bearish engulfing candlestick patterns when confirmed by a moving average filter. Designed for swing trading on 30-minute charts with compatibility for M15 and H1 time frames. Key Features: Pattern Recognition - Detects valid bullish/bearish engulfing candle formations Trend Confirmation - 238-period SMA filter
    This indicator detects clean breakouts and CISD formations, then sends push notifications to your phone after linking it with your MQL5 ID. Notifications include: • Detected formation number (1–85) • Signal: Buy or Sell • Instrument name (set manually in the input) On the chart: • An arrow indicating the position direction is drawn below the candle that confirms the setup. Supported instruments and timeframes: • Works best on lower timeframes for XAUUSD and NASDAQ. Benefits: - Instant notificati
    Introduction to Chart Pattern MT Chart Pattern MT is a chart pattern scanner to detect the triangle pattern, falling wedge pattern, rising wedge pattern, channel pattern and so on. Chart Pattern MT uses highly sophisticated chart pattern detection algorithm. However, we have designed it in the easy to use with intuitive user interface. Chart Pattern MT will show all the patterns in your chart in the most efficient format for your trading. You do not have to do tedious manual pattern detection an
    Trend Scanner MT5
    Alfiya Fazylova
    4 (3)
    Trend Scanner is a trend indicator that helps to determine the current and forecast market direction using an advanced algorithm. Thanks to flexible alert settings, the indicator will promptly warn you about a trend reversal. The indicator is intuitive and easy to use, and will be an excellent filter in your trending trading strategies. The lines of this indicator are also an excellent dynamic level for stop loss, and is used as one of the types of trailing stop in Trading Panel . To fine-tune t
    Indicatore di Forza delle Valute Descrizione Questo indicatore analizza la forza relativa delle principali valute del mercato Forex, offrendo una visione chiara e obiettiva su quali valute si stanno rafforzando o indebolendo rispetto alle altre. Valuta coppie chiave (EUR, USD, GBP, JPY, AUD, NZD, CAD, CHF) e calcola la forza utilizzando metodi come RSI o ROC, in base alla configurazione definita dall'utente. I risultati vengono visualizzati in linee individuali per ciascuna valuta, facilitando l
    Gli utenti di questo prodotto hanno anche acquistato
    Azimuth Pro
    Ottaviano De Cicco
    5 (6)
    LAUNCH PROMO Azimuth Pro price is initially set at 299$ for the first 100 buyers. Final price will be 499$ . THE DIFFERENCE BETWEEN RETAIL AND INSTITUTIONAL ENTRIES ISN'T THE INDICATOR — IT'S THE LOCATION. Most traders enter at arbitrary price levels, chasing momentum or reacting to lagging signals. Institutions wait for price to reach structured levels where supply and demand actually shift. Azimuth Pro maps these levels automatically: swing-anchored VWAP, multi-timeframe structure lines, an
    ARICoins
    Temirlan Kdyrkhan
    ARICoin is a powerful trading companion designed to generate high-probability entry signals with dynamic TP/SL/DP levels based on volatility. Built-in performance tracking shows win/loss stats, PP1/PP2 hits, and success rates all updated live. Key Features: Buy/Sell signals with adaptive volatility bands Real-time TP/SL/DP levels based on ATR Built-in MA Filter with optional ATR/StdDev volatility Performance stats panel (Success, Profit/Loss, PP1/PP2) Alerts via popup, sound, push, or email Cust
    CGE Trading Suite
    Carl Gustav Johan Ekstrom
    5 (1)
    CGE Trading Suite delivers the analytical edge typically reserved for professional trading desks. The platform integrates a full suite of analytical tools into one seamless workflow: dynamic grid mapping, liquidity behavior analysis, ECM, trend lines, MIDAS, trade cycles, and directional channel projections. Together, these provide a unified view of market structure and momentum. Directional clarity is further enhanced by the capital flow index, which measures currency basket strength to identif
    RelicusRoad Pro: Sistema Operativo Quantitativo di Mercato 70% DI SCONTO ACCESSO A VITA (TEMPO LIMITATO) - UNISCITI A 2.000+ TRADER Perché la maggior parte dei trader fallisce anche con indicatori "perfetti"? Perché operano su Singoli Concetti isolati. Un segnale senza contesto è una scommessa. Per vincere serve CONFLUENZA . RelicusRoad Pro non è un semplice indicatore. È un Ecosistema Quantitativo completo . Mappa la "Fair Value Road", distinguendo tra rumore e rotture strutturali. Smetti di in
    AriX
    Temirlan Kdyrkhan
    1 (4)
    AriX Indicator for MT5 A powerful trend-following and signal-evaluation tool AriX is a custom MT5 indicator that combines Moving Averages and ATR-based risk/reward logic to generate clear buy/sell signals. It visualizes dynamic SL/TP levels, evaluates past trade outcomes, and displays win/loss statistics in a clean on-chart panel. Key features include: Buy/Sell signals based on MA crossovers ATR-based SL/TP1/TP2/TP3 levels with visual lines and labels Signal outcome tracking with real-time stat
    Strumento per market maker. Meravith: Analizzerà tutti i timeframe e mostrerà il trend attualmente in corso. Evidenzierà le zone di liquidità (equilibrio dei volumi) dove i volumi rialzisti e ribassisti sono uguali. Mostrerà tutti i livelli di liquidità dei diversi timeframe direttamente sul grafico. Genererà e presenterà un’analisi di mercato testuale a scopo di riferimento. Calcolerà obiettivi, livelli di supporto e punti di stop-loss in base al trend attuale. Calcolerà il rapporto rischio/ren
    OmniSync Projection
    Antonio-alin Teculescu
    5 (1)
    Chronos Fractal Engine is an innovative price projection indicator for MetaTrader 5, designed to transform your technical analysis by intelligently identifying and projecting historical price patterns. Built upon an advanced correlation algorithm and the fractal principles of the market, this powerful tool visualizes potential future price movements, giving you a unique edge in your trading decisions. What is Chronos Fractal Engine? At its core, the Chronos Fractal Engine employs a sophisticat
    ARIPoint
    Temirlan Kdyrkhan
    ARIPoint is a powerful trading companion designed to generate high-probability entry signals with dynamic TP/SL/DP levels based on volatility. Built-in performance tracking shows win/loss stats, PP1/PP2 hits, and success rates all updated live. Key Features: Buy/Sell signals with adaptive volatility bands Real-time TP/SL/DP levels based on ATR Built-in MA Filter with optional ATR/StdDev volatility Performance stats panel (Success, Profit/Loss, PP1/PP2) Alerts via popup, sound, push, or email Cu
    L'indicatore " Dynamic Scalper System MT5 " è progettato per il metodo di scalping, ovvero per il trading all'interno di onde di trend. Testato sulle principali coppie di valute e sull'oro, è compatibile con altri strumenti di trading. Fornisce segnali per l'apertura di posizioni a breve termine lungo il trend, con ulteriore supporto al movimento dei prezzi. Il principio dell'indicatore. Le frecce grandi determinano la direzione del trend. Un algoritmo per generare segnali per lo scalping sott
    Introduction to X3 Chart Pattern Scanner X3 Cherart Pattern Scanner is the non-repainting and non-lagging indicator detecting X3 chart patterns including Harmonic pattern, Elliott Wave pattern, X3 patterns, and Japanese Candlestick patterns. Historical patterns match with signal patterns. Hence, you can readily develop the solid trading strategy in your chart. More importantly, this superb pattern scanner can detect the optimal pattern of its kind. In addition, you can switch on and off individu
    SunSignal ML — AI Gold Signals with Multi-Timeframe Confluence SunSignal ML is an advanced AI-powered signal indicator purpose-built for XAUUSD gold trading. It combines a proprietary adaptive trend algorithm with six machine learning models trained on confirmed price pivots to produce high-confidence entry signals with multi-timeframe validation. The indicator runs efficiently on M1, M5 and M15 timeframes and is designed for traders who want precision entries guided by data rather than guesswor
    ARIScalping
    Temirlan Kdyrkhan
    ARIScalp is a powerful trading companion designed to generate high-probability entry signals with dynamic TP/SL/DP levels based on volatility. Built-in performance tracking shows win/loss stats, PP1/PP2 hits, and success rates all updated live. Key Features: Buy/Sell signals with adaptive volatility bands Real-time TP/SL/DP levels based on ATR Built-in MA Filter with optional ATR/StdDev volatility Performance stats panel (Success, Profit/Loss, PP1/PP2) Alerts via popup, sound, push, or email Cus
    L’indicatore evidenzia le zone in cui viene dichiarato interesse sul mercato , per poi mostrare la zona di accumulo degli ordini . Funziona come un book degli ordini su larga scala . Questo è l’indicatore per i grandi capitali . Le sue prestazioni sono eccezionali. Qualsiasi interesse ci sia nel mercato, lo vedrai chiaramente . (Questa è una versione completamente riscritta e automatizzata – non è più necessaria un’analisi manuale.) La velocità di transazione è un indicatore concettualmente nuo
    Gem SIGNAL
    Shengzu Zhong
    GEM Signal Pro - Indicatore di Trading Professionale Ingressi di precisione. Zero repaint. Una decisione alla volta. GEM Signal Pro è un indicatore professionale trend-following sviluppato per MetaTrader 4 e MetaTrader 5. È progettato per i trader che richiedono segnali puliti e realmente utilizzabili, senza il rumore, il ritardo o le false promesse che affliggono la maggior parte degli indicatori retail. Ogni segnale viene valutato attraverso un motore proprietario di conferma multilivello. Cos
    TrendMaestro5
    Stefano Frisetti
    Attenzione alle truffe, questo indicatore e' distribuito esclusivamente su MQL5.com nota: questo indicatore e' per METATRADER5, se vuoi la versione per  METATRADER4 questo e' il link:   https://www.mql5.com/it/market/product/108106 TRENDMAESTRO ver 2.5 TRENDMAESTRO   riconosce un nuovo TREND sul nascere, non sbaglia mai. La sicurezza di identificare un nuovo TREND non ha prezzo. DESCRIZIONE TRENDMAESTRO identifica un nuovo TREND sul nascere, questo indicatore prende in esame la volatilita' i
    Weis Wave with Alert MT5
    Trade The Volume Waves Single Member P.C.
    4.94 (17)
    Rental/Lifetime Package Options and Privileges  Rent Monthly Six Months   Yearly/Lifetime Weis Wave with Speed with Alert+Speed Index x x x Manual  x x x Quick Set up Video x x x Blog x x x Lifetime Updates x x x Setup and Training Material x x Discord Access Channel "The SI traders"          x Rectangle Break Alert Tool      x How to trade with it:    http://www.tradethevolumewaves.com   ** If you purchase please contact me to setup your  : Training Room and  complete manual access.  Wei
    Rtc ML Ai Predictor
    Muhammad Faisal Sagala
    Rtc ML Ai | Predictor CORE MACHINE LEARNING ENGINE Adaptive ML Market Predictor – Multi-Bar Trend & Candle Forecast What This Indicator Does This indicator is a  real-time market prediction engine  designed to analyze price behavior and estimate  future market tendencies . Unlike conventional indicators, this system  does not rely on static parameters or historical curve-fitting , but adapts its internal state dynamically during live market operation. Instead of using static rules, the indic
    Matreshka
    Dimitr Trifonov
    5 (2)
    Matreshka self-testing and self-optimizing indicator: 1. Is an interpretation of the Elliott Wave Analysis Theory. 2. Based on the principle of the indicator type ZigZag, and the waves are based on the principle of interpretation of the theory of DeMark. 3. Filters waves in length and height. 4. Draws up to six levels of ZigZag at the same time, tracking waves of different orders. 5. Marks Pulsed and Recoil Waves. 6. Draws arrows to open positions 7. Draws three channels. 8. Notes support and re
    Presentazione dell'Indicatore Astronomico per   MT4 / MT5 : Il tuo compagno di trading celeste definitivo Sei pronto a elevare la tua esperienza di trading a livelli celesti? Non cercare oltre, il nostro rivoluzionario Indicatore Astronomico per MT4 è qui. Questo strumento innovativo va oltre gli indicatori di trading tradizionali, sfruttando algoritmi complessi per offrirti intuizioni astronomiche senza pari e calcoli di precisione. Un universo di informazioni a portata di mano:   Ammira un pan
    Pointer Trend Switch — precision trend reversal indicator Pointer Trend Switch is a high-precision arrow indicator designed to detect key moments of trend reversal based on asymmetric price behavior within a selected range of bars. It identifies localized price impulses by analyzing how far price deviates from the opening level, helping traders find accurate entry points before a trend visibly shifts. This indicator is ideal for scalping, intraday strategies, and swing trading, and performs equa
    Prices move for many reasons and these can vary from one operator to another: software, private and institutional traders simultaneously contribute to the formation of the price, making predictive art very difficult. However, there are measurable factors that bind the price to an underlying trend in line with the physical reality that the financial asset represents: these are the macroeconomic indicators. Large investors use this information wisely to set their strategies. Understanding these m
    Max Ribbon Mt5
    Stefano Frisetti
    ATTENZIONE: Questo indicatore è distribuito ESCLUSIVAMENTE su MQL5.com Versione MT4:   https://www.mql5.com/it/market/product/160363 Versione MT5:   https://www.mql5.com/it/market/product/160410 ================================================================================ MAX RIBBON ver 1.00 L'indicatore che ti mostra il TREND in modo chiaro e inequivocabile! ================================================================================ DESCRIZIONE MAX RIBBON è un indicatore di trend
    WVAP Scalping
    Domantas Juodenis
    VWAP Scalping Pro – Advanced VWAP & Market Profile System Professional-Grade VWAP + Market Profile Technology for Precision Trading VWAP Scalping Pro is an advanced analytical tool that integrates Volume-Weighted Average Price (VWAP) analysis with professional Market Profile visualization. It provides traders with institutional-style insights into price structure, volume distribution, and session dynamics — ideal for scalping, intraday, and swing trading strategies. Key Features Triple VWAP St
    Big Player Range
    Thalles Nascimento De Carvalho
    5 (3)
    BigPlayerRange – Il miglior indicatore per MT5 BigPlayerRange è considerato il miglior indicatore per Mini Indice e Mini Dollaro su MetaTrader 5. Questo strumento essenziale evidenzia le zone strategiche di azione dei grandi player, offrendo un’analisi tecnica istituzionale di altissima precisione. Come usare BigPlayerRange: Questo indicatore mostra zone di acquisto (linea verde) e di vendita (linea rossa). Quando il prezzo chiude fuori da queste aree, è probabile un movimento di tendenz
    IVISTscalp5
    Vadym Zhukovskyi
    5 (6)
    iVISTscalp5 — Sistema di previsione del mercato basato sul tempo iVISTscalp5 non è un indicatore tradizionale. È un sistema basato sul tempo per MetaTrader 5, che identifica quando il mercato è più probabile che si muova. ⸻ Caratteristiche  • Timing preciso  • Segnali BUY / SELL  • Potenziale medio di profitto  • Previsioni settimanali  • 120+ strumenti ⸻ Idea chiave Il mercato non si muove solo per il prezzo, ma anche per il tempo ⸻ iVISTscalp5 — Il tuo vantaggio nel tempo
    +++++++++++++++++++++++++++++++++++++++++++++++++++++++++++++++++++++++++++++++++++++++++++++++++ +++ Link to EURUSD Only Free Version -->  https://www.mql5.com/en/market/product/156904?source=Unknown +++++++++++++++++++++++++++++++++++++++++++++++++++++++++++++++++++++++++++++++++++++++++++++++++ Hallo Trader, This is a traditional GANN & FIBONACCI strategy based on detection of an impulsive move in the opposite direction. This is called a Breakout. At the moment of Breakout, the indicator draw
    Frontier Pivots
    Nestor Jose Mendez Boza
    FRONTIER PIVOTS - Geometric Levels Indicator This indicator plots support and resistance levels/ranges on the chart using mathematical calculations. It helps traders identify potential price reaction zones based on geometric patterns. Main Features: Automatically calculates and displays key price levels Plots both support and resistance lines Uses daily price data for level calculation Clean visual presentation with different colors for different level types No repainting - levels remain static
    Jita Indicator Pro MT5 | All Timeframes Professional Trend Agreement System – Premium Edition ($500) What Is Jita Indicator Pro? Jita Indicator Pro is a structured trend-confirmation system designed for serious traders who value precision, alignment, and controlled signal behavior. It combines: Advanced band-based trend direction logic ATR-driven structural trigger engine Dual-confirmation agreement system Locked history update design This indicator prints signals only when multiple conditions
    Hyperbolic
    Konstantin Gruzdev
    The indicator is stable on noise fluctuations in price and quickly reacts to the trend. It is based on an algorithm from a system of hyperbolic functions that allows you to aggressively smooth the flat with minimal lag on the trend. It can be applied directly to the price chart, to itself, or to other indicators in order to eliminate false signals. The main purpose of the indicator is to smooth out small sawtooth price movements as much as possible. The higher the Hyperbolic parameter, the stron
    Hunter Spike
    Jaime Humberto Gomez Arias
    Hunter Spike This indicator consists of two regression channels calibrated with the current movement of the synthetic index algorithm, for any Deriv or Weltrade broker. Each channel has a signal, a target that alerts us when the price touches them, indicating buys on booms or gains and sells on crashes or pains. -configuration for booms or gains: Channel zone 1 (30) Channel zone 2 (0) -configuration for crashes or pains: Channel zone 1 (100) Channel zone 2 (70) Zones freely configurable by
    Altri dall’autore
    Bot3
    Garfield Heron
    Introducing the Ultimate Trading Solution: Bot3 – Your Edge in the Forex Market Are you ready to take your trading to the next level?  Bot3  is a cutting-edge Expert Advisor (EA) designed for MetaTrader 5, combining advanced technical analysis, risk management, and harmonic pattern detection to deliver consistent results. Whether you're a beginner or an experienced trader, this EA automates your trading strategy with precision and reliability, helping you maximize profits while minimizing risks
    Filtro:
    Nessuna recensione
    Rispondi alla recensione