NTL Japanese Candle Patterns

Japanese Candle Patterns (JCP) User Guide

Overview and Features

Japanese candlestick patterns, a foundational element of technical analysis, provide traders with visual insights into market psychology. Each pattern represents the battle between bulls and bears, encapsulating critical information about market sentiment, potential reversals, and continuation signals. Developed centuries ago and later popularized by Steve Nison in Japanese Candlestick Charting Techniques, these patterns are now widely recognized tools for assessing market conditions.

This indicator, leveraging the power of the JCP (Japanese Candle Patterns) methodology, assists traders in identifying and acting upon these vital patterns, enhancing both strategy formulation and execution.

Key Features

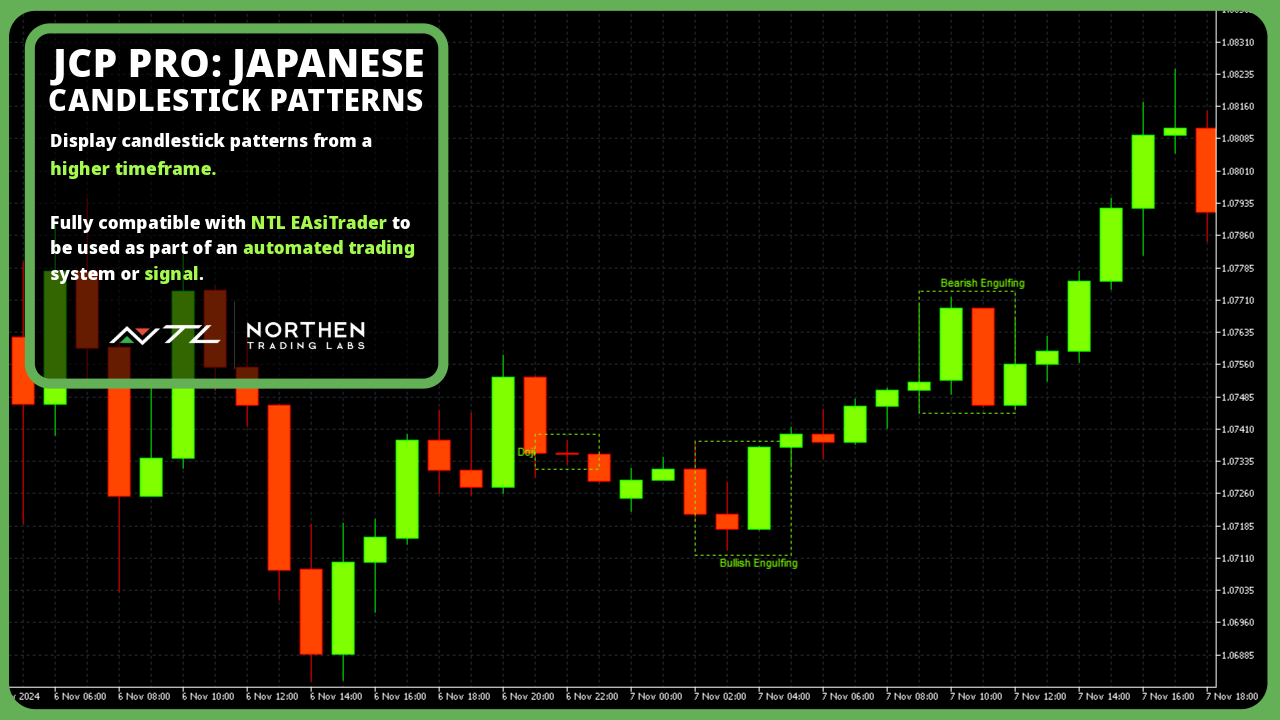
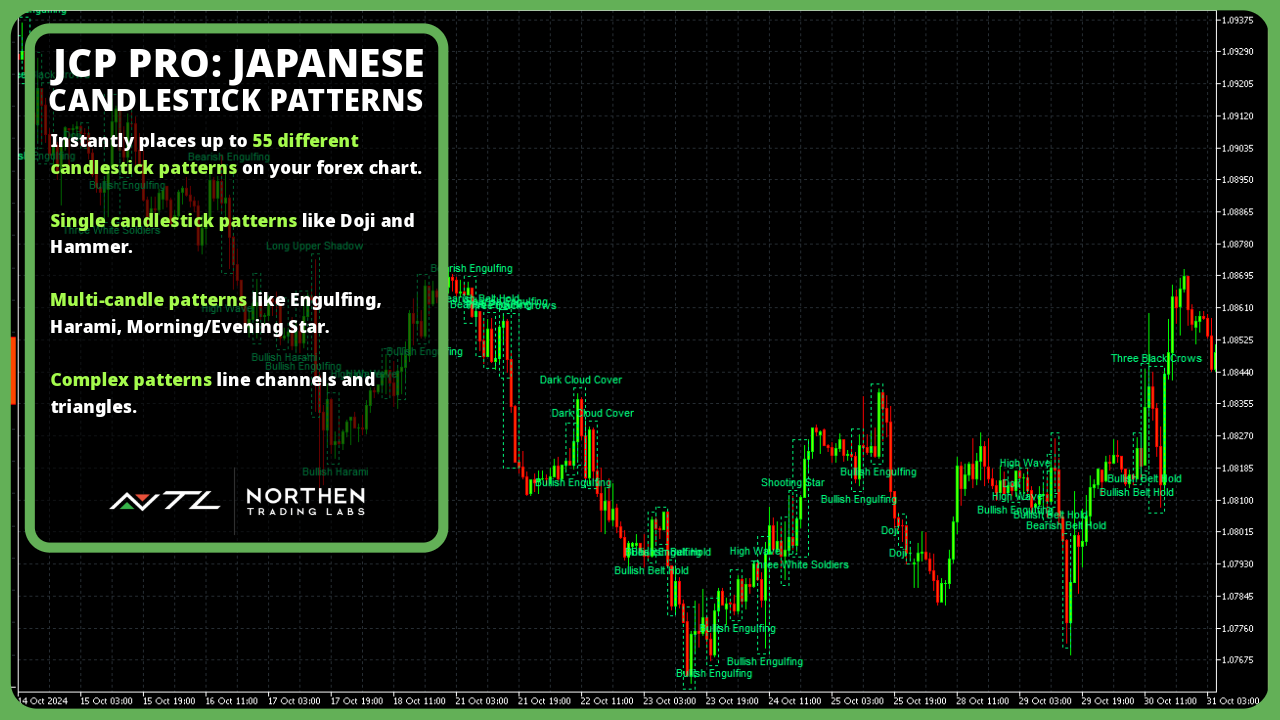
  • Comprehensive Pattern Recognition: Detects 55 well-known candlestick patterns such as the Doji, Hammer, and Engulfing patterns, each marked on the chart for clear visibility and immediate interpretation.

    • Single-Candle Patterns: Patterns like the Hammer, Shooting Star, and Doji.
    • Multi-Candle Patterns: Patterns that unfold over several candles, such as the Engulfing, Harami, and Morning/Evening Star.
    • Complex Patterns: Channels, Triangles, and support/resistance-based patterns which provide insights into broader market structures.
    • Trend Reversals: Patterns like the Hammer, Engulfing, or Doji Star are known for signaling possible reversals in price direction.
    • Continuation Signals: Patterns such as the Rising Three Method or Falling Three Method can indicate that a trend is likely to continue, which is valuable for trend-following strategies.
    • Confirmation of Market Strength: Patterns like the Marubozu, which lack shadows, show strong conviction by buyers or sellers, confirming strength in a given direction.
  • Multi-Timeframe Scanning: Whether trading on the 1-minute chart or the monthly chart, the JCP indicator adapts seamlessly, allowing users to examine patterns across multiple timeframes, from intra-day to long-term perspectives. Note: To use this feature effectively, fully load tick data for your desired timeframe.

  • Reduces Subjectivity: Manual identification of patterns can be subjective, while JCP applies consistent criteria.

  • Improves Efficiency: JCP scans the chart automatically, allowing traders to stay focused on strategic decision-making.

  • Compatible with EAsiTrader EA: Provides signals to NTL EAsiTrader EA for automated trading.

Whether you are a novice or experienced trader, JCP provides a systematic approach to identifying and utilizing candlestick patterns, combining the insights of centuries-old techniques with the power of modern trading tools.

Installation and Settings

Installation

  1. Installing the Indicator:

    • Download the JCP indicator JCP.ex5 file and place it in the Indicators\NTL folder of your MQL5 platform directory. You may need to create folder NTL if it doesn’t already exist.
    • The typical file path is Terminal -> MQL5 -> Indicators -> NTL . Once the file is in this folder, restart the platform to ensure it appears in the Navigator panel.
  2. Applying JCP to the Chart:

    • Open the chart of the symbol and timeframe on which you’d like to use the JCP indicator.
    • Drag the JCP indicator from the Navigator panel (under Indicators\NTL) onto your chart.
    • After adding JCP, you’ll see Inputs that allow you to customize how patterns are displayed, which patterns to include, and more.
  3. Customizing Settings:

    • Access input settings after dragging JCP onto a chart or by double-clicking on the indicator in the Navigator panel or selecting Properties after applying it to the chart.
    • Choose Your Timeframe: Use the Timeframe setting to select the timeframe for pattern analysis. For example, if your chart timeframe is M30 but you set Timeframe to H1 , JCP will identify patterns based on hourly data but display them on the 30-minute chart. Selecting timeframes lower than the chart timeframe is not possible, e.g. M10 timeframe on a M30 timeframe chart.
    • Select Patterns: In the input settings, enable or disable specific patterns based on your trading strategy. For example, if you focus on reversal signals, you might prioritize patterns like the Hammer or Engulfing patterns.
    • Pattern Customization: If you have specific preferences for pattern definitions, such as stricter criteria for Doji or Hammer patterns, adjust the relevant parameters in the Standard Patterns Definition Settings section.
    • Trend Confirmation Settings: For traders using trend-following strategies, the TrendConfirmation setting lets you filter patterns based on alignment with the ADX indicator. Adjust the ADXPeriod and ADXTrendLevel settings to fine-tune this feature.
  4. Verifying JCP’s Functionality on the Chart:

    • Once configured, observe how JCP displays patterns on the chart. Patterns appear with abbreviations or symbols, making it easy to spot key signals without clutter.
    • Tip: Test different configurations and timeframes in a demo environment to find the setup that best complements your trading strategy.
  5. Saving Your Custom JCP Template:

    • To avoid reconfiguring JCP each time, save your preferred settings as a template. Right-click on the chart, select Template -> Save Template, and name it something descriptive, like JCP_Custom .
    • You can load this template on other charts to quickly apply your JCP settings.

Settings

Timeframe

The Timeframe setting allows you to select the specific timeframe from which JCP will analyze candlestick patterns, regardless of the chart’s current timeframe. This feature is helpful if you want to analyze patterns on a higher timeframe than the one currently displayed, giving you a multi-timeframe perspective. Timeframe must be greater than or equal to the chart’s timeframe.

  • Example Use Case:

    • Let’s say your chart’s timeframe is set to M15 (15 minutes), but you want to identify patterns based on hourly (H1) data. Set the Timeframe input to H1 . JCP will then scan the data of each completed H1 candle and display any detected patterns on the M15 chart.
  • Common Applications:

    • Timeframe Analysis: Setting a higher timeframe (e.g., H4 on an H1 chart) can help capture more stable, long-term patterns that are less affected by noise.
  • Recommendation:

    • Match the timeframe to your trading strategy. For instance, trend traders might prefer higher timeframes (H4, D1), while intraday traders may choose M15 or M30 for quicker signals.

Pattern Types (CSV List)

This setting is a powerful feature that lets you customize which patterns JCP will scan for and display. It accepts a comma-separated list of pattern types, enabling you to fine-tune the indicator based on your trading strategy and preferred signals.

  • Full Pattern List:

    • AbandonedBabyBottom , AbandonedBabyTop , AscendingChannel , AscendingTriangle , BearishBeltHold , BearishCounterAttack , BearishEngulfing , BearishHarami , BearishHLinePin , BearishSeparating , BullishBeltHold , BullishCounterAttack , BullishEngulfing , BullishHarami , BullishHLinePin , BullishSeparating , DarkCloudCover , DescendingChannel , DescendingTriangle , Doji , DojiStar , DragonFlyDoji , EveningStar , FallingThreeMethod , FallingWindow , FlatLowerBody , FlatUpperBody , GravestoneDoji , Hammer , HangingMan , HighWave , InvertedHammer , LongLeggedDoji , LongLowerShadow , LongUpperShadow , Marubozu , MorningStar , Pennant , PiercingPattern , Rectangle , ResistanceLine , RisingThreeMethod , RisingWindow , ShavenBottom , ShavenHead , ShootingStar , SpinningTop , SupportLine , ThreeBlackCrows , ThreeWhiteSoldiers , TowerBottom , TowerTop , TweezerTop , TweezerBottom , UpsideGapTwoCrows .
  • Example Use Case:

    • To limit the indicator to specific patterns, enter only the desired patterns in Pattern Type setting. For example, setting Hammer, Doji, BullishEngulfing means JCP will only scan for and display these three patterns.
  • Tips for Customization:

    • Strategy-Specific Patterns:
      • For reversal strategies, you might prioritize patterns like Hammer , ShootingStar , Engulfing , and Doji .
      • For trend continuation, consider RisingThreeMethod , FallingThreeMethod , or Marubozu .
    • Limit Pattern Quantity: Using fewer patterns can help reduce visual clutter on the chart and improve chart readability, especially on lower timeframes.
    • Testing Different Combinations: Experiment with various pattern combinations to find setups that yield the most reliable signals for your trading style.

By adjusting Timeframe and Pattern Types thoughtfully, you can better align JCP’s analysis with your trading approach, whether it’s short-term scalping or long-term trend trading.

Use Strict Criteria

Tightens criteria for identifying patterns (e.g., for Doji and Hammer).

Big Body

Defines a candle’s “Big Body” size in terms of a ratio of the candle’s average body height. The average body height is defined as the average height of a candle’s body over a 14 candle period.

Big Candle

Defines a candle’s “Big Candle” size in terms of a ratio of the candle’s average whole height. The average candle height is defined as the average height of a whole candle over a 14 candle period.

Doji Body

Defines the maximum body size of a Doji pattern in terms of a ratio of the candle’s average body height. The average body height is defined as the average height of a candle’s body over a 14 candle period.

Small Body

Defines a candle’s “Small Body” size in terms of a ratio of the candle’s average body height. The average body height is defined as the average height of a candle’s body over a 14 candle period.

Small Candle

Defines a candle’s “Small Candle” size in terms of a ratio of the candle’s average whole height. The average candle height is defined as the average height of a whole candle over a 14 candle period.

Window Min Gap

Defines the minimum gap for a Falling or Rising Window pattern in terms of a ratio of the candle’s average whole height. The average candle height is defined as the average height of a whole candle over a 14 candle period.

Complex Pattern Tolerances

Define tolerances for channels, rectangles, and triangles as percentages of candle body height.

Trend Confirmation

Displays only patterns that align with the ADX-based trend.

ADX Period

Sets the ADX calculation period for smoothing trend identification.

ADX Trend Level

Sets the minimum ADX threshold to validate trends.

Use Symbol Names

When this setting is true the pattern’s abbreviated name is shown above or below the pattern on the chart. When this setting is false the pattern’s full name is shown above or below the pattern on the chart.

Using the Indicator

The following candle patterns are listed showing their full name, followed by their abbreviated name. The signs have the following meaning:

  • +: Bullish Pattern
  • -: Bearish Pattern
  • ++: Bullish Reversal Pattern
  • : Bearish Reversal Pattern

Standard Candle Patterns 1-2 (For a complete list see the online manual)

  1. Abandoned Baby Bottom (++ABB)
  • Description: The Abandoned Baby Bottom is a rare bullish reversal pattern, often appearing at the end of a downtrend. It consists of three candles: a strong bearish candle, a small-bodied Doji with a gap down, and a bullish candle with a gap up.
  • Pattern Criteria:
    • The first candle is bearish, reflecting strong selling pressure.
    • The second candle is a Doji with a gap below the first candle, signifying indecision in the market.
    • The third candle is bullish and opens with a gap above the Doji, showing that buyers have stepped in.
  • Trading Significance:
    • This pattern suggests that a downtrend is potentially reversing as buyers regain control, often signaling a shift in momentum toward the upside.
    • The two gaps (before and after the Doji) are key elements that strengthen the pattern’s reliability.
  • Interpretation Tips:
    • This pattern is most effective in strongly oversold markets where buying pressure is expected.
    • Confirmation with additional indicators like RSI (indicating oversold conditions) or volume can improve signal reliability.
  1. Abandoned Baby Top (–ABT)
  • Description: The Abandoned Baby Top is the bearish counterpart to the Abandoned Baby Bottom, typically appearing at the end of an uptrend. It signals a potential reversal to the downside.
  • Pattern Criteria:
    • The first candle is bullish, indicating strong buying momentum.
    • The second candle is a Doji with a gap above the first candle, signaling indecision and potential exhaustion.
    • The third candle is bearish and opens with a gap below the Doji, suggesting that sellers are regaining control.
  • Trading Significance:
    • This pattern often indicates a shift in sentiment from bullish to bearish, signaling that an uptrend may be ending.
    • The gaps on either side of the Doji enhance its reliability as a reversal signal.
  • Interpretation Tips:
    • This pattern is particularly valuable in overbought conditions, where a correction is anticipated.
    • Look for confirmation through volume analysis (increasing on the third candle) or with other trend indicators like ADX.

Complex Patterns 1-2 (For a complete list see the online manual)

  1. Ascending Channel (AC)
  • Description: The Ascending Channel is a bullish continuation pattern formed by two parallel upward-sloping trendlines, encompassing a series of higher highs and higher lows. This pattern indicates that the price is trending upward within a defined range and often signals continuation until a breakout or breakdown occurs.
  • Pattern Criteria:
    • The pattern consists of two parallel trendlines sloping upward, with price moving between the lines.
    • The price action includes a series of higher highs and higher lows, touching both the upper resistance and lower support trendlines.
  • Trading Significance:
    • This pattern is typically a bullish continuation signal, as the price gradually rises within the channel.
    • A breakout above the upper trendline suggests an acceleration in the uptrend, while a breakdown below the lower trendline may signal a reversal.
  • Interpretation Tips:
    • Traders can enter long positions near the lower trendline (support) and take profits near the upper trendline (resistance).
    • For confirmation of a breakout, watch for increased volume as the price moves above the upper trendline. If the price breaks below the lower trendline, it could signal a trend reversal.
  1. Ascending Triangle (AT)
  • Description: The Ascending Triangle is a bullish continuation pattern that forms with a horizontal resistance line and an upward-sloping support line. It signifies that the price is being compressed, with buyers becoming increasingly aggressive, often leading to a breakout above the resistance level.
  • Pattern Criteria:
    • The pattern consists of a horizontal resistance level, indicating that sellers are holding the price at a consistent level.
    • The support level slopes upward, showing that buyers are pushing the price higher, forming a series of higher lows.
  • Trading Significance:
    • The Ascending Triangle generally indicates a bullish continuation, as it shows building buying pressure against a static resistance level.
    • A breakout above the resistance line suggests that buyers have overwhelmed sellers, potentially leading to a strong upward move.
  • Interpretation Tips:
    • Ascending Triangles are more effective within an uptrend, where they signal continuation.
    • Volume often spikes on a breakout above the resistance level, adding strength to the bullish signal. Traders can enter on the breakout and set a target by measuring the height of the triangle and projecting it from the breakout point.

Advanced Usage and Strategy Integration

Indicator Buffers

  • Buffer 0: Candle Pattern Data
    • Bits 0-15: Pattern Type
    • Bits 16-19: Pattern Width In Bars
  • Buffer 1: Signal Flag values (Signal)
    • If (PatternTrendType Is Bearish Or PatternTrendType Is TopReversal Or PatternTrendType Is MajorTopReversal) Then Signal = Bearish
    • If (PatternTrendType Is Bullish Or PatternTrendType Is BottomReversal Or PatternTrendType Is MajorBottomReversal) Then Signal = Bullish

Strengthening Signals with Indicators

While Japanese Candlestick Patterns (JCP) can offer valuable insights into market psychology, their reliability and predictive power increase significantly when used in conjunction with other technical indicators. Each candlestick pattern provides a snapshot of market sentiment, but indicators like Moving Averages, RSI, and Bollinger Bands help confirm and strengthen these signals. By combining JCP with indicators, traders can reduce false signals, improve entry and exit timing, and make more informed decisions in both trending and volatile markets.

  1. Moving Averages (MA)
    Moving Averages help smooth out price data and highlight trend direction. Here’s how to integrate them with candlestick patterns:
  • Bullish Crossover and Bullish Patterns: When a shorter-term MA (e.g., 10-period) crosses above a longer-term MA (e.g., 50-period), it signals potential upward momentum. If this crossover aligns with a bullish pattern like a Hammer or Engulfing Bullish, it strengthens the likelihood of a trend reversal.

  • Bearish Patterns Below MA: Bearish patterns such as the Shooting Star or Bearish Engulfing forming below the MA suggest continued downward pressure, especially if the price remains below both short and long MAs.

    Example: In a downtrend, if the price briefly rises to test the 50-period MA and forms a Bearish Engulfing pattern, this combination can confirm a selling opportunity with higher confidence.

  1. Relative Strength Index (RSI)
    RSI measures the strength of price changes and is especially useful for identifying overbought or oversold conditions, enhancing JCP patterns:
  • Overbought Conditions with Bearish Patterns: If RSI is above 70 and a bearish pattern like Evening Star forms, it suggests a strong potential for a price reversal.

  • Oversold Conditions with Bullish Patterns: Similarly, an RSI below 30 alongside a Morning Star or Hammer indicates that buyers may soon gain control, suggesting a buying opportunity.

    Example: Suppose RSI has entered the oversold zone, and a Hammer pattern forms. This combination signals an opportune moment for a potential trend reversal, especially if it aligns with a support level.

  1. Bollinger Bands
    Bollinger Bands help gauge volatility, with price movements near the bands often signaling potential reversals:
  • Reversal Patterns at Upper Band: When the price touches the upper band and forms a bearish pattern like Shooting Star or Bearish Engulfing, it suggests that the asset might be overextended, signaling a sell opportunity.

  • Reversal Patterns at Lower Band: Conversely, if the price reaches the lower band and forms a bullish pattern like Hammer or Bullish Engulfing, it signals a potential reversal upwards.

    Example: During a period of high volatility, the price touches the upper Bollinger Band, followed by a Shooting Star. This often indicates a strong selling signal, especially if the price starts moving back toward the middle band.

Using JCP in combination with other indicators is essential for refining and validating trade signals. Indicators help filter out noise and reduce the impact of false signals that may appear from isolated patterns, thus providing a more holistic view of market conditions. This approach allows traders to make well-rounded decisions, improving the effectiveness of the JCP indicator as part of a comprehensive trading strategy.

Insights

Japanese Candlestick Patterns provide traders with nuanced insights into market psychology, yet some of their deeper interpretations are often overlooked. Here are advanced insights for applying JCP theory effectively:

  1. Psychological Layers of Reversal Patterns
    Reversal patterns like the Hammer and Shooting Star are more than mere entry signals; they reveal shifts in trader psychology. For instance, a Hammer forming after a downtrend indicates that buyers managed to regain control after a period of selling pressure, which might signal a bottom. Conversely, a Shooting Star shows buyer exhaustion at a peak, with sellers starting to dominate. Understanding the shift in momentum through these patterns allows traders to gauge when a trend may be reversing.

    • Example: In a downtrend, a Hammer forming near a key support level suggests a potential reversal. Combining this with oversold conditions (e.g., an RSI below 30) can provide a strong buy signal.
  2. The Power of Context in Continuation Patterns
    Continuation patterns like Rising Three Methods or Falling Three Methods suggest a temporary pause before the prevailing trend resumes. Observing these patterns in the context of trend strength can reveal the commitment of buyers or sellers. For example, the Rising Three Method in an uptrend reflects a momentary consolidation where sellers briefly control the market, but the trend resumes as buyers overpower them.

    • Example: If the Rising Three Method occurs after a period of high volume, it reinforces the likelihood of trend continuation, as the brief pause indicates that buyers are recharging before pushing prices higher.
  3. Complex Patterns for Detecting Breakouts and Reversals
    Patterns like Ascending Triangles or Descending Triangles provide unique opportunities by signaling a buildup of energy before a breakout. These patterns form as buyers and sellers become increasingly decisive, often leading to an explosive price move once a key level is breached.

    • Example: An Ascending Triangle forming in an uptrend near a resistance level with high volume is a strong signal of a breakout. Measuring the height of the triangle and projecting it from the breakout point offers a potential price target, allowing traders to set informed profit levels.
  4. Volume as a Confirmation Tool
    Volume plays a crucial role in confirming the reliability of candlestick patterns. Increased volume during the formation of a pattern—such as a Bearish Engulfing—can indicate stronger market commitment and enhance the signal’s reliability.

    • Example: A Bullish Engulfing pattern at a support level, accompanied by rising volume, signifies that buyers are taking control, increasing the likelihood of a reversal.
  5. Multi-Timeframe Analysis for Higher Accuracy
    Using candlestick patterns across multiple timeframes adds another dimension to their effectiveness. Patterns on higher timeframes, such as daily or weekly charts, often carry more weight, while shorter timeframes like 5-minute charts can fine-tune entry and exit points.

    • Example: A Bullish Engulfing on a daily chart signals a potential trend reversal. When confirmed by a smaller timeframe, like an hourly Hammer, it provides a more precise entry point with reduced risk.

By considering these advanced interpretations, traders can better leverage Japanese Candlestick Patterns as part of a holistic strategy, enhancing both the timing and reliability of trading decisions.

Prodotti consigliati
Trade smarter, not harder: Empower your trading with Harmonacci Patterns This is arguably the most complete harmonic price formation auto-recognition indicator you can find for the MetaTrader Platform. It detects 19 different patterns, takes fibonacci projections as seriously as you do, displays the Potential Reversal Zone (PRZ) and finds suitable stop-loss and take-profit levels. [ Installation Guide | Update Guide | Troubleshooting | FAQ | All Products ] It detects 19 different harmonic pri
Overview Harmonic Patterns MT5 is a technical analysis indicator designed for the MetaTrader 5 platform. It identifies and displays harmonic price patterns, such as Butterfly, Cypher, Crab, Bat, Shark, and Gartley, in both bullish and bearish directions. The indicator calculates key price levels, including entry, stop loss, and three take-profit levels, to assist traders in analyzing market movements. Visual elements and customizable alerts enhance usability on the chart. Features Detects six ha
Candle hunter
Ruslan Khasanov
5 (1)
Indicatore per analisi grafica. Segna i principali modelli di candele giapponesi sul grafico. Al momento, il trader ha a disposizione la seguente serie di modelli:  - Bearish/Bullish Abandoned Baby;  - Bearish Advance Block;  - Bearish Deliberation;  - Bearish/Bullish Belt Hold;  - Bearish/Bullish Engulfing;  - Bearish Shooting Star;  - Bearish Evening Star;  - Bearish Evening Doji Star;  - Bearish/Bullish Doji Star;    - Bearish/Bullish Tri-Star;  - Bearish Hanging Man;  - Bearish/Bullish Hara
Owl Smart Levels MT5
Sergey Ermolov
4.03 (32)
Versione MT4  |  FAQ L' indicatore Owl Smart Levels è un sistema di trading completo all'interno dell'unico indicatore che include strumenti di analisi di mercato popolari come i frattali avanzati di Bill Williams , Valable ZigZag che costruisce la corretta struttura a onde del mercato, e i livelli di Fibonacci che segnano i livelli esatti di entrata nel mercato e luoghi per prendere profitti. Descrizione dettagliata della strategia Istruzioni per lavorare con l'indicatore Consulente-assistente
Innanzitutto, vale la pena sottolineare che questo Strumento di Trading è un Indicatore Non-Ridipingente, Non-Ridisegnante e Non-Laggante, il che lo rende ideale per il trading professionale. Corso online, manuale utente e demo. L'Indicatore Smart Price Action Concepts è uno strumento molto potente sia per i nuovi che per i trader esperti. Racchiude più di 20 utili indicatori in uno solo, combinando idee di trading avanzate come l'Analisi del Trader del Circolo Interno e le Strategie di Tradin
Scan pattern
VLADISLAV AKINDINOV
The indicator is designed to help in making a decision on the direction of trading (buy or sell). It is a history scanner that searches for matches of the current pattern (combination of several current bars) with historical data in percentage terms by the relative vertical position of candles relative to each other, the size of each candle, the size of the candle body and the candle shadows. In history, the matches found are indicated by vertical lines on the candle of the beginning of the soug
MercariaPattern1-2-3 відстежує рух ціни, знаходить трьоххвильові структури 1-2-3 та підсвічує момент, коли сценарій підтверджується пробоєм ключового рівня. MercariaPattern1-2-3 tracks price movement, detects three-leg 1-2-3 structures and highlights the moment when the scenario is confirmed by a key level breakout. Індикатор збирає локальні свінги в компактну фігуру 0–1–2–3 , чекає підтвердженого пробою та будує стрілку входу з готовими рівнями SL/TP. The indicator combines local swings into a
Overview Mirror Signals Service EA (Text only)   is a powerful monitoring Expert Advisor that automatically sends   real-time Telegram notifications   for all important trade events on your MetaTrader 5 account. It is engineered specifically for   signal providers ,   trade-copier operators ,   auditors ,   educators , and   professional trading services   that require immediate, detailed, and reliable reporting. Everything from   entries, exits, SL/TP changes, comment changes, trailing sto
+++++++++++++++++++++++++++++++++++++++++++++++++++++++++++++++++++++++++++++++++++++++++++++++++++++++ +++ Link to EURUSD Only Free Version -->  https://www.mql5.com/en/market/product/156904 +++ Full License -->  https://www.mql5.com/en/market/product/156842 +++++++++++++++++++++++++++++++++++++++++++++++++++++++++++++++++++++++++++++++++++++++++++++++++++++++ +++ XMAS SALE +++ Get this indicator for free when renting the Forecast System Full License  (one license for one account)   +++ Please
Il livello Premium è un indicatore unico con una precisione superiore all'80% delle previsioni corrette! Questo indicatore è stato testato dai migliori Specialisti di Trading per più di due mesi! L'indicatore dell'autore che non troverai da nessun'altra parte! Dagli screenshot puoi vedere di persona la precisione di questo strumento! 1 è ottimo per il trading di opzioni binarie con un tempo di scadenza di 1 candela. 2 funziona su tutte le coppie di valute, azioni, materie prime, criptovalu
Overview The Market Perspective Structure Indicator is a comprehensive MetaTrader indicator designed to provide traders with a detailed analysis of market structure across multiple timeframes. It identifies and visualizes key price action elements, including swing highs and lows, Break of Structure (BOS), Change of Character (CHOCH), internal structures, equal highs/lows, premium/discount levels, previous levels from higher timeframes, and trading session zones. With extensive customization opt
Was: $249  Now: $99   Market Profile defines a number of day types that can help the trader to determine market behaviour. A key feature is the Value Area, representing the range of price action where 70% of trading took place. Understanding the Value Area can give traders valuable insight into market direction and establish the higher odds trade. It is an excellent addition to any system you may be using. Inspired by Jim Dalton’s book “Mind Over Markets”, this indicator is designed to suit the
Indicatore Crypto_Forex Pattern PINBAR per MT5, senza ridisegnare, senza ritardi. - L'indicatore "PINBAR Pattern" è un indicatore molto potente per il trading basato sull'azione dei prezzi. - L'indicatore rileva le PinBar sul grafico: - PinBar rialzista - Segnale a freccia blu sul grafico (vedi immagini). - PinBar ribassista - Segnale a freccia rossa sul grafico (vedi immagini). - Con avvisi su PC e dispositivi mobili. - L'indicatore "PINBAR Pattern" è eccellente da combinare con i livelli di
TradePilotmt5
Hossein Khalil Alishir
TradePilot Expert Advisor (EA) for MetaTrader 5 TradePilot is a professional and user-friendly Expert Advisor (EA) for MetaTrader 5 (MT5) . It simplifies automated trading , risk management , and trade execution with a smart trading panel . Perfect for beginners and experienced traders looking for a reliable trade manager EA with automated lot size calculation and smart position management. Key Advantages User-Friendly Trading Panel: Customizable panel with buttons and hotkeys for fast ex
Pro Gold System Indicator
PEDRO JOAQUIM GONCALVES GOMES
ADVANCED FUNCTIONALITIES: Trend Score (0-100) with visual bar Intelligent signals with adjustable strength (1-10) Risk management with automatic TP/SL Audible and visual alerts Price zones with smooth filling Multi-indicator analysis (RSI, ATR, BB, EMAs) DESIGN FEATURES Modern Visual: Smooth and well-spaced lines (EMA with 2-3px width) Vibrant and professional colors (Sky Blue, Orange, Gold) Modern arrows (code 233/234) for buy/sell signals Configurable dark/light theme Adjustable transparency f
Incinerat8
Paulos Ngwenya
This algorithm uses real time data to generate signals with an accuracy rate of 80%. It shows entries and where you should place both the stoploss and the take profit for each trade. It determines trend! It can even help you to become a signal provider! And it can generate up to 8 signals a day! You get access to a free forex trading community  Operates on any broker compatible to synthetic indices and forex   if you need any assistance whatsapp +2774 35 35 744 or telegram link @pipsempire01
Monster Harmonics Indicator is a harmonic pattern indicator. It recognizes Gartley, Bat, Crab, Butterfly, Cypher, White Swan, Black Swan, Shark and AB=CD patterns. Projected patterns that are not yet completed are recognized, too. Monster even shows the PRZ (Potential Reversal Zone). Users can add their own user defined patterns to Monster. Besides the current pattern, Monster also shows all patterns in the symbols history. Monster will provide alerts for developing patterns. Introduced by H.M.
"Impulses and Corrections 5" is created to help traders navigate the market situation. The indicator shows multi-time frame upward and downward "Impulses" of price movements. These impulses are the basis for determining the "Base" , which is composed of zones of corrections of price movements, as well as "Potential" zones for possible scenarios of price movement. Up and down impulses are determined based on a modified formula of Bill Williams' "Fractals" indicator. The last impulse is always "U
Forex traders often observe increased market activity near Supply and Demand zones, which are levels formed based on zones where strong price movements have previously occurred. The Supply Demand Strong Weak Confirm Indicator utilizes fractals and the ATR indicator to identify and plot support and resistance zones on the price chart. These zones are categorized as follows: - Weak: significant high and low points in the trend. - Untested: crucial turning points in the price chart that the pric
Noize Absorption Index - is the manual trading system that measures the difference of pressure between bears forces and bulls forces. Green line - is a noize free index that showing curent situation. Zero value of index shows totally choppy/flat market.Values above zero level shows how powerfull bullish wave is and values below zero measures bearish forces.Up arrow appears on bearish market when it's ready to reverse, dn arrow appears on weak bullish market, as a result of reverse expectation.
The diamond top and bottom are reversal patterns. It represents a rally to a new high with a drop to a support level followed by a rally to make a new high and a quick decline, breaking the support level to make a higher low. The bounce from the higher low is then followed by a rally, but making a lower high instead. Once this behavior is identified, prices then break the trend line connecting the first and second lows and start to decline further. You can find MT4 version hier Indicator shows
Gann Time–Price Square Cycles (MT5) This indicator applies the concept of time–price balance introduced by W.D. Gann. It detects price swings on the chart and projects Quarter, Half, and Full cycle time intervals forward, marking them with vertical lines. The tool is designed to help traders study the relationship between swing size and elapsed time directly on MT5 charts. Functions Detects swing highs and lows based on pivot depth and minimum swing size. Projects Quarter, Half, and Full harmon
Inverted_Chart_EA Utility Expert Advisor Inverted_Chart_EA creates and maintains a mirror-inverted chart of any symbol and timeframe. It automatically generates a custom instrument (e.g. US30_INV ) and keeps its price history updated in real time, with bars mirrored around a chosen pivot. This utility gives traders a new way to analyze the market from a different perspective by flipping the chart upside down. Why use an inverted chart? Highlight hidden patterns – price formations that look ordin
Unlock powerful breakout opportunities The 123 Pattern is one of the most popular, powerful and flexible chart patterns. The pattern is made up of three price points: a bottom, a peak or valley, and a Fibonacci retracement between 38.2% and 71.8%. A pattern is considered valid when the price breaks beyond the last peak or valley, moment at which the indicator plots an arrow, rises an alert, and the trade can be placed. [ Installation Guide | Update Guide | Troubleshooting | FAQ | All Products ]
Harmonic Pattern Structure Harmonic Pattern Structure is a professional MetaTrader 5 indicator that automatically detects classic harmonic patterns using strict Fibonacci ratio validation and XABCD price structure. Designed for traders who value precision, clean visuals, and structured analysis, the indicator highlights potential reversal zones based on price geometry, supporting consistent and objective decision-making. SUPPORTED HARMONIC PATTERNS Gartley (222) Butterfly Bat Crab Shark Cy
Overview If you trade using Smart Money Concepts or market structure strategies, this tool instantly makes your charts cleaner and your structure reading much easier. Smart Leg Structure PRO automatically identifies the most recent market leg, marks the high, low, and equilibrium, and shows every Fair Value Gap (FVG) and swing point in seconds. No more guessing or manually redrawing lines — this indicator gives you a full view of how price moves between premium and discount zones. It uses profes
Monthly Levels Pro
N'da Lemissa Kouame
ITALIANO – Monthly Levels Pro v1.0 L’indicatore definitivo dei livelli mensili di mercato Controlla le zone chiave del mercato a colpo d’occhio. Monthly Levels Pro ti permette di analizzare le tendenze a lungo termine e individuare rapidamente supporti e resistenze mostrando automaticamente High, Low, Open e Close della candela mensile. Vantaggi: Analisi immediata Trading più intelligente Chiarezza visiva Flessibile Semplice ed efficace Compatibilità: MT5, tutti i timeframe
Informazioni sull'indicatore Questo indicatore si basa sulle simulazioni Monte Carlo sui prezzi di chiusura di uno strumento finanziario. Per definizione, Monte Carlo è una tecnica statistica utilizzata per modellare la probabilità di diversi risultati in un processo che coinvolge numeri casuali basati su risultati osservati in precedenza. Come funziona? Questo indicatore genera diversi scenari di prezzo per un titolo modellando i cambiamenti di prezzo casuali nel tempo sulla base dei dati stor
Precision trading: leverage wolfe waves for accurate signals Wolfe Waves are naturally occurring trading patterns present in all financial markets and represent a fight towards an equilibrium price. These patterns can develop over short and long-term time frames and are one of the most reliable predictive reversal patterns in existence, normally preceding strong and long price movements. [ Installation Guide | Update Guide | Troubleshooting | FAQ | All Products ] Clear trading signals Amazingly
Auto Fab
Thabang John Wotsa
Indicator Overview AUTO FAB   is a professional, fully-automated Fibonacci retracement indicator for MetaTrader 5 that combines advanced technical analysis with an intuitive control panel. It automatically detects significant swing points and draws Fibonacci retracement levels in real-time, giving traders a powerful tool for identifying potential support/resistance levels and market reversal points.   Core Features 1.   AUTOMATIC SWING POINT DETECTION Smart Algorithm : Automatically identifies s
Gli utenti di questo prodotto hanno anche acquistato
ARIPoint
Temirlan Kdyrkhan
ARIPoint is a powerful trading companion designed to generate high-probability entry signals with dynamic TP/SL/DP levels based on volatility. Built-in performance tracking shows win/loss stats, PP1/PP2 hits, and success rates all updated live. Key Features: Buy/Sell signals with adaptive volatility bands Real-time TP/SL/DP levels based on ATR Built-in MA Filter with optional ATR/StdDev volatility Performance stats panel (Success, Profit/Loss, PP1/PP2) Alerts via popup, sound, push, or email Cu
Azimuth Pro
Ottaviano De Cicco
5 (4)
LAUNCH PROMO Azimuth Pro price is initially set at 299$ for the first 100 buyers. Final price will be 499$ . THE DIFFERENCE BETWEEN RETAIL AND INSTITUTIONAL ENTRIES ISN'T THE INDICATOR — IT'S THE LOCATION. Most traders enter at arbitrary price levels, chasing momentum or reacting to lagging signals. Institutions wait for price to reach structured levels where supply and demand actually shift. Azimuth Pro maps these levels automatically: swing-anchored VWAP, multi-timeframe structure lines, an
Divergence Bomber
Ihor Otkydach
4.89 (81)
Ogni acquirente dell’indicatore riceverà inoltre gratuitamente: L’utilità esclusiva “Bomber Utility”, che gestisce automaticamente ogni operazione, imposta i livelli di Stop Loss e Take Profit e chiude le posizioni secondo le regole della strategia I file di configurazione (set file) per adattare l’indicatore a diversi asset I set file per configurare il Bomber Utility in tre modalità: “Rischio Minimo”, “Rischio Bilanciato” e “Strategia di Attesa” Una guida video passo-passo per installare, conf
Top indicator for MT5   providing accurate signals to enter a trade without repainting! It can be applied to any financial assets:   forex, cryptocurrencies, metals, stocks, indices .  Watch  the video  (6:22) with an example of processing only one signal that paid off the indicator! MT4 version is here It will provide pretty accurate trading signals and tell you when it's best to open a trade and close it. Most traders improve their trading results during the first trading week with the help of
Ogni giorno, molti trader affrontano una sfida comune: il prezzo sembra rompere un livello chiave, entrano in un'operazione, e poi il mercato si inverte, attivando il loro stop loss. Questo è noto come falsa rottura (false breakout) — un movimento di prezzo che supera brevemente un livello di supporto o resistenza prima di invertire la direzione. Questi movimenti possono causare l'attivazione degli stop loss prima che la direzione effettiva del prezzo diventi chiara. Nell'analisi tecnica, questo
L'indicatore " Dynamic Scalper System MT5 " è progettato per il metodo di scalping, ovvero per il trading all'interno di onde di trend. Testato sulle principali coppie di valute e sull'oro, è compatibile con altri strumenti di trading. Fornisce segnali per l'apertura di posizioni a breve termine lungo il trend, con ulteriore supporto al movimento dei prezzi. Il principio dell'indicatore. Le frecce grandi determinano la direzione del trend. Un algoritmo per generare segnali per lo scalping sott
L’indicatore evidenzia le zone in cui viene dichiarato interesse sul mercato , per poi mostrare la zona di accumulo degli ordini . Funziona come un book degli ordini su larga scala . Questo è l’indicatore per i grandi capitali . Le sue prestazioni sono eccezionali. Qualsiasi interesse ci sia nel mercato, lo vedrai chiaramente . (Questa è una versione completamente riscritta e automatizzata – non è più necessaria un’analisi manuale.) La velocità di transazione è un indicatore concettualmente nuo
Super Signal – Skyblade Edition Sistema professionale di segnali di tendenza senza repaint / senza ritardo con tasso di vincita eccezionale | Per MT4 / MT5 Funziona meglio su timeframe più bassi, come 1 minuto, 5 minuti e 15 minuti. Caratteristiche principali: Super Signal – Skyblade Edition è un sistema intelligente di segnali progettato specificamente per il trading di tendenza. Utilizza una logica di filtraggio multilivello per identificare esclusivamente i movimenti direzionali forti, supp
Grabber System MT5
Ihor Otkydach
4.82 (22)
Ti presento un eccellente indicatore tecnico: Grabber, che funziona come una strategia di trading "tutto incluso", pronta all’uso. In un solo codice sono integrati strumenti potenti per l’analisi tecnica del mercato, segnali di trading (frecce), funzioni di allerta e notifiche push. Ogni acquirente di questo indicatore riceve anche gratuitamente: L’utility Grabber: per la gestione automatica degli ordini aperti Video tutorial passo dopo passo: per imparare a installare, configurare e utilizzare
Quantum TrendPulse
Bogdan Ion Puscasu
5 (20)
Ecco   Quantum TrendPulse   , lo strumento di trading definitivo che combina la potenza di   SuperTrend   ,   RSI   e   Stocastico   in un unico indicatore completo per massimizzare il tuo potenziale di trading. Progettato per i trader che cercano precisione ed efficienza, questo indicatore ti aiuta a identificare con sicurezza le tendenze di mercato, i cambiamenti di momentum e i punti di entrata e uscita ottimali. Caratteristiche principali: Integrazione SuperTrend:   segui facilmente l'andame
Quantum Entry   è un potente sistema di trading basato sull'azione del prezzo, costruito su una delle strategie più popolari e conosciute tra i trader: la strategia di   Breakout ! Questo indicatore genera segnali di acquisto e vendita chiari e cristallini basati sulla rottura di aree chiave di supporto e resistenza. A differenza dei tipici indicatori di breakout, utilizza calcoli avanzati per confermare con precisione la rottura! Quando si verifica una rottura, ricevi avvisi immediati. Nessun r
Bill Williams Advanced
Siarhei Vashchylka
5 (10)
Bill Williams Advanced is designed for automatic chart analysis using Bill Williams' "Profitunity" system. The indicator analyzes four timeframes at once. Manual (Be sure to read before purchasing) Advantages 1. Analyzes the chart using Bill Williams' "Profitunity" system. Signals are displayed in a table in the corner of the screen and on the price chart. 2. Finds all known AO and AC signals, as well as zone signals. Equipped with a trend filter based on the Alligator. 3. Finds "Divergence Bar
TrendMaestro5
Stefano Frisetti
Attenzione alle truffe, questo indicatore e' distribuito esclusivamente su MQL5.com nota: questo indicatore e' per METATRADER5, se vuoi la versione per  METATRADER4 questo e' il link:   https://www.mql5.com/it/market/product/108106 TRENDMAESTRO ver 2.5 TRENDMAESTRO   riconosce un nuovo TREND sul nascere, non sbaglia mai. La sicurezza di identificare un nuovo TREND non ha prezzo. DESCRIZIONE TRENDMAESTRO identifica un nuovo TREND sul nascere, questo indicatore prende in esame la volatilita' i
PillowIndicator
Sergey Shevchenko
Se hai bisogno di un indicatore che mostri i punti di ingresso nel mercato, allora questo è il tuo indicatore.  L'indicatore non viene ridisegnato. Mostra i punti di acquisto e vendita per qualsiasi TF (intervallo di tempo) e qualsiasi coppia di valute. Le impostazioni sono regolabili per tutti gli strumenti. Puoi configurare ciascun parametro per qualsiasi broker, per qualsiasi account. Questo è un CUSCINO comodo :)) Dai un'occhiata.....
TPA True Price Action indicator reveals the true price action of the market makers through 100% non-repainting signals strictly at the close of a candle! TPA shows entries and re-entries, every time the bulls are definitely stronger than the bears and vice versa. Not to confuse with red/green candles. The shift of power gets confirmed at the earliest stage and is ONE exit strategy of several. There are available now two free parts of the TPA User Guide for our customers. The first "The Basics"
Trend deviation scalper - is the manual system to scalp choppy market places. Indicator defines bull/bear trend and it's force. Inside exact trend system also defines "weak" places, when trend is ready to reverse. So as a rule, system plots a sell arrow when bull trend becomes weak and possibly reverses to bear trend. For buy arrow is opposite : arrow is plotted on bear weak trend. Such arrangement allows you to get a favorable price and stand up market noise. Loss arrows are closing by common p
The AX Forex Indicator MT5 is a sophisticated trading tool designed to provide traders with a comprehensive analysis of multiple currency pairs. This   powerful indicator   simplifies the complex nature of the forex market, making it accessible for both novice and experienced traders. AX Forex Indicator uses   advanced algorithms   to detect trends, patterns and is an essential tool for traders aiming to enhance their forex trading performance. With its robust features, ease of use, and reliabl
La soluzione migliore per ogni principiante o trader esperto! Questo indicatore è uno strumento di trading unico, di alta qualità e conveniente perché abbiamo incorporato una serie di caratteristiche proprietarie e una formula segreta. Con un solo grafico fornisce avvisi per tutte le 28 coppie di valute. Immaginate come migliorerà il vostro trading perché sarete in grado di individuare l'esatto punto di innesco di una nuova tendenza o opportunità di scalping! Costruito su nuovi algoritmi sott
PZ Divergence Trading MT5
PZ TRADING SLU
3.71 (7)
Unlock hidden profits: accurate divergence trading for all markets Tricky to find and scarce in frequency, divergences are one of the most reliable trading scenarios. This indicator finds and scans for regular and hidden divergences automatically using your favourite oscillator. [ Installation Guide | Update Guide | Troubleshooting | FAQ | All Products ] Easy to trade Finds regular and hidden divergences Supports many well known oscillators Implements trading signals based on breakouts Displays
Current event:  https://c.mql5.com/1/326/A2SR2025_NoMusic.gif A2SR per MT5 Indicatore: Domanda e Offerta Effettive Automatizzate (S/R). + Strumenti di Trading. Product description in English here. --   Guidance   : -- at   https://www.mql5.com/en/blogs/post/734748/page4#comment_16532516 -- and  https://www.mql5.com/en/users/yohana/blog Potente, Autentico e Risparmio di Tempo per Decisioni di Trading più Intelligenti + Oggetti compatibili con EA. Vantaggi Principali Livelli di SR Effettivi
ARIScalping
Temirlan Kdyrkhan
ARIScalp is a powerful trading companion designed to generate high-probability entry signals with dynamic TP/SL/DP levels based on volatility. Built-in performance tracking shows win/loss stats, PP1/PP2 hits, and success rates all updated live. Key Features: Buy/Sell signals with adaptive volatility bands Real-time TP/SL/DP levels based on ATR Built-in MA Filter with optional ATR/StdDev volatility Performance stats panel (Success, Profit/Loss, PP1/PP2) Alerts via popup, sound, push, or email Cus
Advanced Supply Demand MT5
Bernhard Schweigert
4.5 (14)
La migliore soluzione per qualsiasi principiante o trader esperto! Questo indicatore è uno strumento di trading unico, di alta qualità e conveniente perché abbiamo incorporato una serie di funzionalità proprietarie e una nuova formula. Con questo aggiornamento, sarai in grado di mostrare fusi orari doppi. Non solo potrai mostrare una TF più alta, ma anche entrambe, la TF del grafico, PIÙ la TF più alta: SHOWING NESTED ZONES. Tutti i trader di domanda di offerta lo adoreranno. :) Informazioni imp
RelicusRoad Pro: Sistema Operativo Quantitativo di Mercato 70% DI SCONTO ACCESSO A VITA (TEMPO LIMITATO) - UNISCITI A 2.000+ TRADER Perché la maggior parte dei trader fallisce anche con indicatori "perfetti"? Perché operano su Singoli Concetti isolati. Un segnale senza contesto è una scommessa. Per vincere serve CONFLUENZA . RelicusRoad Pro non è un semplice indicatore. È un Ecosistema Quantitativo completo . Mappa la "Fair Value Road", distinguendo tra rumore e rotture strutturali. Smetti di in
Berma Bands
Muhammad Elbermawi
5 (7)
L'indicatore Berma Bands (BBs) è uno strumento prezioso per i trader che cercano di identificare e capitalizzare i trend di mercato. Analizzando la relazione tra il prezzo e le BBs, i trader possono discernere se un mercato è in una fase di trend o di range. Visita il [ Berma Home Blog ] per saperne di più. Le Berma Bands sono composte da tre linee distinte: la Upper Berma Band, la Middle Berma Band e la Lower Berma Band. Queste linee sono tracciate attorno al prezzo, creando una rappresentazion
Trend Forecaster
Alexey Minkov
5 (7)
The Trend Forecaster indicator utilizes a unique proprietary algorithm to determine entry points for a breakout trading strategy. The indicator identifies price clusters, analyzes price movement near levels, and provides a signal when the price breaks through a level. The Trend Forecaster indicator is suitable for all financial assets, including currencies (Forex), metals, stocks, indices, and cryptocurrencies. You can also adjust the indicator to work on any time frames, although it is recommen
ARICoins
Temirlan Kdyrkhan
ARICoin is a powerful trading companion designed to generate high-probability entry signals with dynamic TP/SL/DP levels based on volatility. Built-in performance tracking shows win/loss stats, PP1/PP2 hits, and success rates all updated live. Key Features: Buy/Sell signals with adaptive volatility bands Real-time TP/SL/DP levels based on ATR Built-in MA Filter with optional ATR/StdDev volatility Performance stats panel (Success, Profit/Loss, PP1/PP2) Alerts via popup, sound, push, or email Cust
Shock Pullback
Suleiman Alhawamdah
5 (1)
Semplicemente, puoi iniziare a fare trading quando il movimento dei numeri bianchi — noti come "pips" — inizia ad apparire accanto alla candela corrente. I "pips" bianchi indicano che un'operazione di acquisto o vendita è attualmente attiva e si sta muovendo nella direzione corretta, come indicato dal colore bianco. Quando il movimento dei pips bianchi si interrompe e diventa di colore verde statico, questo segnala la fine della spinta attuale. Il colore verde dei numeri rappresenta il profitto
AriX
Temirlan Kdyrkhan
AriX Indicator for MT5 A powerful trend-following and signal-evaluation tool AriX is a custom MT5 indicator that combines Moving Averages and ATR-based risk/reward logic to generate clear buy/sell signals. It visualizes dynamic SL/TP levels, evaluates past trade outcomes, and displays win/loss statistics in a clean on-chart panel. Key features include: Buy/Sell signals based on MA crossovers ATR-based SL/TP1/TP2/TP3 levels with visual lines and labels Signal outcome tracking with real-time stat
Weis Wave with Alert MT5
Trade The Volume Waves Single Member P.C.
4.94 (17)
Rental/Lifetime Package Options and Privileges  Rent Monthly Six Months   Yearly/Lifetime Weis Wave with Speed with Alert+Speed Index x x x Manual  x x x Quick Set up Video x x x Blog x x x Lifetime Updates x x x Setup and Training Material x x Discord Access Channel "The SI traders"          x Rectangle Break Alert Tool      x How to trade with it:    http://www.tradethevolumewaves.com   ** If you purchase please contact me to setup your  : Training Room and  complete manual access.  Wei
Gartley Hunter Multi
Siarhei Vashchylka
5 (11)
Gartley Hunter Multi - An indicator for searching for harmonic patterns simultaneously on dozens of trading instruments and on all possible timeframes. Manual (Be sure to read before purchasing) | Version for MT4 Advantages 1. Patterns: Gartley, Butterfly, Shark, Crab. Bat, Alternate Bat, Deep Crab, Cypher 2. Simultaneous search for patterns on dozens of trading instruments and on all possible timeframes 3. Search for patterns of all possible sizes. From the smallest to the largest 4. All fou
Altri dall’autore
AutoFib: Advanced Fibonacci Retracement for MetaTrader 5 Automate Fibonacci Analysis for Smarter Trading Decisions AutoFib simplifies Fibonacci retracement analysis by automatically identifying key levels of support and resistance directly on your MT5 charts. Whether you're new to Fibonacci analysis or an advanced trader, AutoFib enhances your ability to identify potential reversals, continuations, and critical price levels. Key Features: Automatic Fibonacci Levels – Identify retracement and ext
EAsiTrader: Advanced Strategy Creation & Automation for MetaTrader 5 EAsiTrader is designed for those who want to eliminate the hassle of programming and drastically accelerate the process of creating Expert Advisors, making strategy development faster and more efficient. EAsiTrader is a versatile trading tool designed specifically for MetaTrader 5, providing automation features and a comprehensive set of tools to help users build, test, and refine and run trading strategies. EAsiTrader adapts
NTL Pivot Lines
Northen Trading Labs
Pivot Lines (PL) User Guide Overview and Features The Pivot Lines Indicator (PL) provides traders with a powerful tool for identifying potential support and resistance levels based on well-established pivot point calculation methods. By offering insights into possible price turning points, this indicator helps traders make more informed trading decisions and refine their entry and exit strategies. With customizable settings for different timeframes and calculation methods, PL is versatile and a
ABH - Candle Component Analysis - User Guide Overview and Features The   ABH - Average Bar Height   indicator is designed to help traders analyze market volatility and identify potential buy and sell signals by measuring the average size of each candlestick component over a specific period. The indicator calculates and displays four lines representing different candlestick metrics. By analyzing these values, traders can interpret market strength, volatility, and potential trend changes. Beyond
NTL Market Times
Northen Trading Labs
NTL Market Times Indicator The NTL Market Times Indicator for MT5 provides a clear unobtrusive display of the opening and closing times of the world’s major Forex trading centers. It automatically adjusts for UK daylight saving time, ensuring reliable market session information all year round. Main Features Major Markets: Displays New York, London, Frankfurt, Sydney, and Tokyo trading hours. Color-Coded Sessions: Each market session is uniquely color-coded for quick identification on the chart.
NTL HLines
Northen Trading Labs
HLines User Guide Overview and Features The NTL HLines Indicator is designed to elevate your trading with precise support and resistance analysis. Utilizing a sophisticated algorithm, this MQL5 indicator scans for high-probability price levels across multiple timeframes, helping traders pinpoint strategic entry and exit zones. With fully customizable pivot scanning and multi-timeframe support, HLines provides a powerful, adaptable toolset for traders of all experience levels. Key features includ
Filtro:
Nessuna recensione
Rispondi alla recensione