NTL Japanese Candle Patterns

Japanese Candle Patterns (JCP) User Guide

Overview and Features

Japanese candlestick patterns, a foundational element of technical analysis, provide traders with visual insights into market psychology. Each pattern represents the battle between bulls and bears, encapsulating critical information about market sentiment, potential reversals, and continuation signals. Developed centuries ago and later popularized by Steve Nison in Japanese Candlestick Charting Techniques, these patterns are now widely recognized tools for assessing market conditions.

This indicator, leveraging the power of the JCP (Japanese Candle Patterns) methodology, assists traders in identifying and acting upon these vital patterns, enhancing both strategy formulation and execution.

Key Features

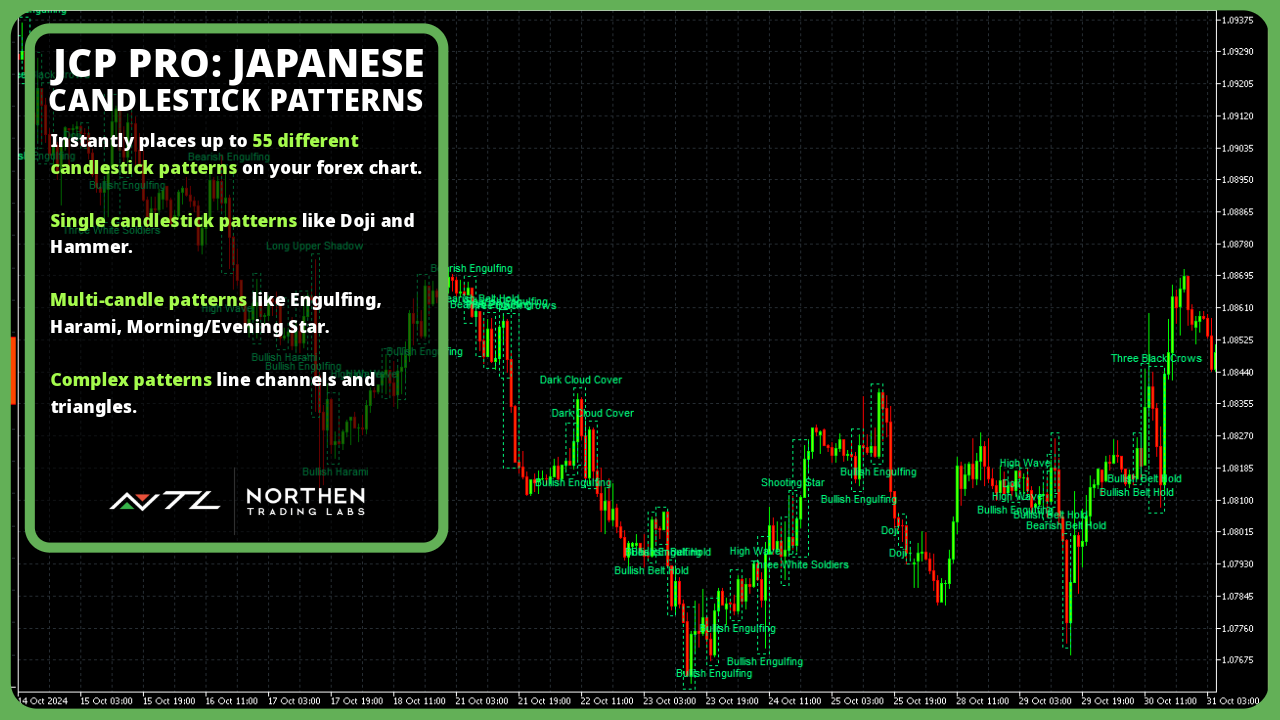
  • Comprehensive Pattern Recognition: Detects 55 well-known candlestick patterns such as the Doji, Hammer, and Engulfing patterns, each marked on the chart for clear visibility and immediate interpretation.

    • Single-Candle Patterns: Patterns like the Hammer, Shooting Star, and Doji.
    • Multi-Candle Patterns: Patterns that unfold over several candles, such as the Engulfing, Harami, and Morning/Evening Star.
    • Complex Patterns: Channels, Triangles, and support/resistance-based patterns which provide insights into broader market structures.
    • Trend Reversals: Patterns like the Hammer, Engulfing, or Doji Star are known for signaling possible reversals in price direction.
    • Continuation Signals: Patterns such as the Rising Three Method or Falling Three Method can indicate that a trend is likely to continue, which is valuable for trend-following strategies.
    • Confirmation of Market Strength: Patterns like the Marubozu, which lack shadows, show strong conviction by buyers or sellers, confirming strength in a given direction.
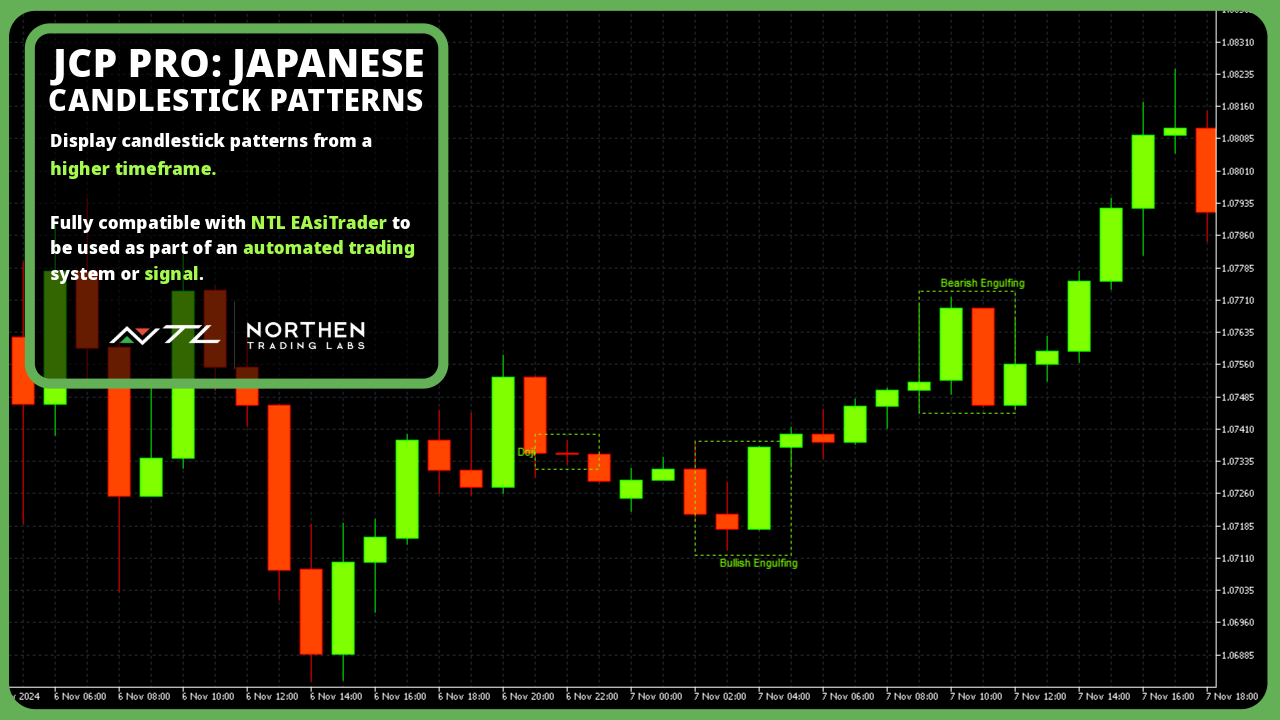
  • Multi-Timeframe Scanning: Whether trading on the 1-minute chart or the monthly chart, the JCP indicator adapts seamlessly, allowing users to examine patterns across multiple timeframes, from intra-day to long-term perspectives. Note: To use this feature effectively, fully load tick data for your desired timeframe.

  • Reduces Subjectivity: Manual identification of patterns can be subjective, while JCP applies consistent criteria.

  • Improves Efficiency: JCP scans the chart automatically, allowing traders to stay focused on strategic decision-making.

  • Compatible with EAsiTrader EA: Provides signals to NTL EAsiTrader EA for automated trading.

Whether you are a novice or experienced trader, JCP provides a systematic approach to identifying and utilizing candlestick patterns, combining the insights of centuries-old techniques with the power of modern trading tools.

Installation and Settings

Installation

  1. Installing the Indicator:

    • Download the JCP indicator JCP.ex5 file and place it in the Indicators\NTL folder of your MQL5 platform directory. You may need to create folder NTL if it doesn’t already exist.
    • The typical file path is Terminal -> MQL5 -> Indicators -> NTL . Once the file is in this folder, restart the platform to ensure it appears in the Navigator panel.
  2. Applying JCP to the Chart:

    • Open the chart of the symbol and timeframe on which you’d like to use the JCP indicator.
    • Drag the JCP indicator from the Navigator panel (under Indicators\NTL) onto your chart.
    • After adding JCP, you’ll see Inputs that allow you to customize how patterns are displayed, which patterns to include, and more.
  3. Customizing Settings:

    • Access input settings after dragging JCP onto a chart or by double-clicking on the indicator in the Navigator panel or selecting Properties after applying it to the chart.
    • Choose Your Timeframe: Use the Timeframe setting to select the timeframe for pattern analysis. For example, if your chart timeframe is M30 but you set Timeframe to H1 , JCP will identify patterns based on hourly data but display them on the 30-minute chart. Selecting timeframes lower than the chart timeframe is not possible, e.g. M10 timeframe on a M30 timeframe chart.
    • Select Patterns: In the input settings, enable or disable specific patterns based on your trading strategy. For example, if you focus on reversal signals, you might prioritize patterns like the Hammer or Engulfing patterns.
    • Pattern Customization: If you have specific preferences for pattern definitions, such as stricter criteria for Doji or Hammer patterns, adjust the relevant parameters in the Standard Patterns Definition Settings section.
    • Trend Confirmation Settings: For traders using trend-following strategies, the TrendConfirmation setting lets you filter patterns based on alignment with the ADX indicator. Adjust the ADXPeriod and ADXTrendLevel settings to fine-tune this feature.
  4. Verifying JCP’s Functionality on the Chart:

    • Once configured, observe how JCP displays patterns on the chart. Patterns appear with abbreviations or symbols, making it easy to spot key signals without clutter.
    • Tip: Test different configurations and timeframes in a demo environment to find the setup that best complements your trading strategy.
  5. Saving Your Custom JCP Template:

    • To avoid reconfiguring JCP each time, save your preferred settings as a template. Right-click on the chart, select Template -> Save Template, and name it something descriptive, like JCP_Custom .
    • You can load this template on other charts to quickly apply your JCP settings.

Settings

Timeframe

The Timeframe setting allows you to select the specific timeframe from which JCP will analyze candlestick patterns, regardless of the chart’s current timeframe. This feature is helpful if you want to analyze patterns on a higher timeframe than the one currently displayed, giving you a multi-timeframe perspective. Timeframe must be greater than or equal to the chart’s timeframe.

  • Example Use Case:

    • Let’s say your chart’s timeframe is set to M15 (15 minutes), but you want to identify patterns based on hourly (H1) data. Set the Timeframe input to H1 . JCP will then scan the data of each completed H1 candle and display any detected patterns on the M15 chart.
  • Common Applications:

    • Timeframe Analysis: Setting a higher timeframe (e.g., H4 on an H1 chart) can help capture more stable, long-term patterns that are less affected by noise.
  • Recommendation:

    • Match the timeframe to your trading strategy. For instance, trend traders might prefer higher timeframes (H4, D1), while intraday traders may choose M15 or M30 for quicker signals.

Pattern Types (CSV List)

This setting is a powerful feature that lets you customize which patterns JCP will scan for and display. It accepts a comma-separated list of pattern types, enabling you to fine-tune the indicator based on your trading strategy and preferred signals.

  • Full Pattern List:

    • AbandonedBabyBottom , AbandonedBabyTop , AscendingChannel , AscendingTriangle , BearishBeltHold , BearishCounterAttack , BearishEngulfing , BearishHarami , BearishHLinePin , BearishSeparating , BullishBeltHold , BullishCounterAttack , BullishEngulfing , BullishHarami , BullishHLinePin , BullishSeparating , DarkCloudCover , DescendingChannel , DescendingTriangle , Doji , DojiStar , DragonFlyDoji , EveningStar , FallingThreeMethod , FallingWindow , FlatLowerBody , FlatUpperBody , GravestoneDoji , Hammer , HangingMan , HighWave , InvertedHammer , LongLeggedDoji , LongLowerShadow , LongUpperShadow , Marubozu , MorningStar , Pennant , PiercingPattern , Rectangle , ResistanceLine , RisingThreeMethod , RisingWindow , ShavenBottom , ShavenHead , ShootingStar , SpinningTop , SupportLine , ThreeBlackCrows , ThreeWhiteSoldiers , TowerBottom , TowerTop , TweezerTop , TweezerBottom , UpsideGapTwoCrows .
  • Example Use Case:

    • To limit the indicator to specific patterns, enter only the desired patterns in Pattern Type setting. For example, setting Hammer, Doji, BullishEngulfing means JCP will only scan for and display these three patterns.
  • Tips for Customization:

    • Strategy-Specific Patterns:
      • For reversal strategies, you might prioritize patterns like Hammer , ShootingStar , Engulfing , and Doji .
      • For trend continuation, consider RisingThreeMethod , FallingThreeMethod , or Marubozu .
    • Limit Pattern Quantity: Using fewer patterns can help reduce visual clutter on the chart and improve chart readability, especially on lower timeframes.
    • Testing Different Combinations: Experiment with various pattern combinations to find setups that yield the most reliable signals for your trading style.

By adjusting Timeframe and Pattern Types thoughtfully, you can better align JCP’s analysis with your trading approach, whether it’s short-term scalping or long-term trend trading.

Use Strict Criteria

Tightens criteria for identifying patterns (e.g., for Doji and Hammer).

Big Body

Defines a candle’s “Big Body” size in terms of a ratio of the candle’s average body height. The average body height is defined as the average height of a candle’s body over a 14 candle period.

Big Candle

Defines a candle’s “Big Candle” size in terms of a ratio of the candle’s average whole height. The average candle height is defined as the average height of a whole candle over a 14 candle period.

Doji Body

Defines the maximum body size of a Doji pattern in terms of a ratio of the candle’s average body height. The average body height is defined as the average height of a candle’s body over a 14 candle period.

Small Body

Defines a candle’s “Small Body” size in terms of a ratio of the candle’s average body height. The average body height is defined as the average height of a candle’s body over a 14 candle period.

Small Candle

Defines a candle’s “Small Candle” size in terms of a ratio of the candle’s average whole height. The average candle height is defined as the average height of a whole candle over a 14 candle period.

Window Min Gap

Defines the minimum gap for a Falling or Rising Window pattern in terms of a ratio of the candle’s average whole height. The average candle height is defined as the average height of a whole candle over a 14 candle period.

Complex Pattern Tolerances

Define tolerances for channels, rectangles, and triangles as percentages of candle body height.

Trend Confirmation

Displays only patterns that align with the ADX-based trend.

ADX Period

Sets the ADX calculation period for smoothing trend identification.

ADX Trend Level

Sets the minimum ADX threshold to validate trends.

Use Symbol Names

When this setting is true the pattern’s abbreviated name is shown above or below the pattern on the chart. When this setting is false the pattern’s full name is shown above or below the pattern on the chart.

Using the Indicator

The following candle patterns are listed showing their full name, followed by their abbreviated name. The signs have the following meaning:

  • +: Bullish Pattern
  • -: Bearish Pattern
  • ++: Bullish Reversal Pattern
  • –: Bearish Reversal Pattern

Standard Candle Patterns 1-2 (For a complete list see the online manual)

  1. Abandoned Baby Bottom (++ABB)
  • Description: The Abandoned Baby Bottom is a rare bullish reversal pattern, often appearing at the end of a downtrend. It consists of three candles: a strong bearish candle, a small-bodied Doji with a gap down, and a bullish candle with a gap up.
  • Pattern Criteria:
    • The first candle is bearish, reflecting strong selling pressure.
    • The second candle is a Doji with a gap below the first candle, signifying indecision in the market.
    • The third candle is bullish and opens with a gap above the Doji, showing that buyers have stepped in.
  • Trading Significance:
    • This pattern suggests that a downtrend is potentially reversing as buyers regain control, often signaling a shift in momentum toward the upside.
    • The two gaps (before and after the Doji) are key elements that strengthen the pattern’s reliability.
  • Interpretation Tips:
    • This pattern is most effective in strongly oversold markets where buying pressure is expected.
    • Confirmation with additional indicators like RSI (indicating oversold conditions) or volume can improve signal reliability.
  1. Abandoned Baby Top (–ABT)
  • Description: The Abandoned Baby Top is the bearish counterpart to the Abandoned Baby Bottom, typically appearing at the end of an uptrend. It signals a potential reversal to the downside.
  • Pattern Criteria:
    • The first candle is bullish, indicating strong buying momentum.
    • The second candle is a Doji with a gap above the first candle, signaling indecision and potential exhaustion.
    • The third candle is bearish and opens with a gap below the Doji, suggesting that sellers are regaining control.
  • Trading Significance:
    • This pattern often indicates a shift in sentiment from bullish to bearish, signaling that an uptrend may be ending.
    • The gaps on either side of the Doji enhance its reliability as a reversal signal.
  • Interpretation Tips:
    • This pattern is particularly valuable in overbought conditions, where a correction is anticipated.
    • Look for confirmation through volume analysis (increasing on the third candle) or with other trend indicators like ADX.

Complex Patterns 1-2 (For a complete list see the online manual)

  1. Ascending Channel (AC)
  • Description: The Ascending Channel is a bullish continuation pattern formed by two parallel upward-sloping trendlines, encompassing a series of higher highs and higher lows. This pattern indicates that the price is trending upward within a defined range and often signals continuation until a breakout or breakdown occurs.
  • Pattern Criteria:
    • The pattern consists of two parallel trendlines sloping upward, with price moving between the lines.
    • The price action includes a series of higher highs and higher lows, touching both the upper resistance and lower support trendlines.
  • Trading Significance:
    • This pattern is typically a bullish continuation signal, as the price gradually rises within the channel.
    • A breakout above the upper trendline suggests an acceleration in the uptrend, while a breakdown below the lower trendline may signal a reversal.
  • Interpretation Tips:
    • Traders can enter long positions near the lower trendline (support) and take profits near the upper trendline (resistance).
    • For confirmation of a breakout, watch for increased volume as the price moves above the upper trendline. If the price breaks below the lower trendline, it could signal a trend reversal.
  1. Ascending Triangle (AT)
  • Description: The Ascending Triangle is a bullish continuation pattern that forms with a horizontal resistance line and an upward-sloping support line. It signifies that the price is being compressed, with buyers becoming increasingly aggressive, often leading to a breakout above the resistance level.
  • Pattern Criteria:
    • The pattern consists of a horizontal resistance level, indicating that sellers are holding the price at a consistent level.
    • The support level slopes upward, showing that buyers are pushing the price higher, forming a series of higher lows.
  • Trading Significance:
    • The Ascending Triangle generally indicates a bullish continuation, as it shows building buying pressure against a static resistance level.
    • A breakout above the resistance line suggests that buyers have overwhelmed sellers, potentially leading to a strong upward move.
  • Interpretation Tips:
    • Ascending Triangles are more effective within an uptrend, where they signal continuation.
    • Volume often spikes on a breakout above the resistance level, adding strength to the bullish signal. Traders can enter on the breakout and set a target by measuring the height of the triangle and projecting it from the breakout point.

Advanced Usage and Strategy Integration

Indicator Buffers

  • Buffer 0: Candle Pattern Data
    • Bits 0-15: Pattern Type
    • Bits 16-19: Pattern Width In Bars
  • Buffer 1: Signal Flag values (Signal)
    • If (PatternTrendType Is Bearish Or PatternTrendType Is TopReversal Or PatternTrendType Is MajorTopReversal) Then Signal = Bearish
    • If (PatternTrendType Is Bullish Or PatternTrendType Is BottomReversal Or PatternTrendType Is MajorBottomReversal) Then Signal = Bullish

Strengthening Signals with Indicators

While Japanese Candlestick Patterns (JCP) can offer valuable insights into market psychology, their reliability and predictive power increase significantly when used in conjunction with other technical indicators. Each candlestick pattern provides a snapshot of market sentiment, but indicators like Moving Averages, RSI, and Bollinger Bands help confirm and strengthen these signals. By combining JCP with indicators, traders can reduce false signals, improve entry and exit timing, and make more informed decisions in both trending and volatile markets.

  1. Moving Averages (MA)
    Moving Averages help smooth out price data and highlight trend direction. Here’s how to integrate them with candlestick patterns:
  • Bullish Crossover and Bullish Patterns: When a shorter-term MA (e.g., 10-period) crosses above a longer-term MA (e.g., 50-period), it signals potential upward momentum. If this crossover aligns with a bullish pattern like a Hammer or Engulfing Bullish, it strengthens the likelihood of a trend reversal.

  • Bearish Patterns Below MA: Bearish patterns such as the Shooting Star or Bearish Engulfing forming below the MA suggest continued downward pressure, especially if the price remains below both short and long MAs.

    Example: In a downtrend, if the price briefly rises to test the 50-period MA and forms a Bearish Engulfing pattern, this combination can confirm a selling opportunity with higher confidence.

  1. Relative Strength Index (RSI)
    RSI measures the strength of price changes and is especially useful for identifying overbought or oversold conditions, enhancing JCP patterns:
  • Overbought Conditions with Bearish Patterns: If RSI is above 70 and a bearish pattern like Evening Star forms, it suggests a strong potential for a price reversal.

  • Oversold Conditions with Bullish Patterns: Similarly, an RSI below 30 alongside a Morning Star or Hammer indicates that buyers may soon gain control, suggesting a buying opportunity.

    Example: Suppose RSI has entered the oversold zone, and a Hammer pattern forms. This combination signals an opportune moment for a potential trend reversal, especially if it aligns with a support level.

  1. Bollinger Bands
    Bollinger Bands help gauge volatility, with price movements near the bands often signaling potential reversals:
  • Reversal Patterns at Upper Band: When the price touches the upper band and forms a bearish pattern like Shooting Star or Bearish Engulfing, it suggests that the asset might be overextended, signaling a sell opportunity.

  • Reversal Patterns at Lower Band: Conversely, if the price reaches the lower band and forms a bullish pattern like Hammer or Bullish Engulfing, it signals a potential reversal upwards.

    Example: During a period of high volatility, the price touches the upper Bollinger Band, followed by a Shooting Star. This often indicates a strong selling signal, especially if the price starts moving back toward the middle band.

Using JCP in combination with other indicators is essential for refining and validating trade signals. Indicators help filter out noise and reduce the impact of false signals that may appear from isolated patterns, thus providing a more holistic view of market conditions. This approach allows traders to make well-rounded decisions, improving the effectiveness of the JCP indicator as part of a comprehensive trading strategy.

Insights

Japanese Candlestick Patterns provide traders with nuanced insights into market psychology, yet some of their deeper interpretations are often overlooked. Here are advanced insights for applying JCP theory effectively:

  1. Psychological Layers of Reversal Patterns
    Reversal patterns like the Hammer and Shooting Star are more than mere entry signals; they reveal shifts in trader psychology. For instance, a Hammer forming after a downtrend indicates that buyers managed to regain control after a period of selling pressure, which might signal a bottom. Conversely, a Shooting Star shows buyer exhaustion at a peak, with sellers starting to dominate. Understanding the shift in momentum through these patterns allows traders to gauge when a trend may be reversing.

    • Example: In a downtrend, a Hammer forming near a key support level suggests a potential reversal. Combining this with oversold conditions (e.g., an RSI below 30) can provide a strong buy signal.
  2. The Power of Context in Continuation Patterns
    Continuation patterns like Rising Three Methods or Falling Three Methods suggest a temporary pause before the prevailing trend resumes. Observing these patterns in the context of trend strength can reveal the commitment of buyers or sellers. For example, the Rising Three Method in an uptrend reflects a momentary consolidation where sellers briefly control the market, but the trend resumes as buyers overpower them.

    • Example: If the Rising Three Method occurs after a period of high volume, it reinforces the likelihood of trend continuation, as the brief pause indicates that buyers are recharging before pushing prices higher.
  3. Complex Patterns for Detecting Breakouts and Reversals
    Patterns like Ascending Triangles or Descending Triangles provide unique opportunities by signaling a buildup of energy before a breakout. These patterns form as buyers and sellers become increasingly decisive, often leading to an explosive price move once a key level is breached.

    • Example: An Ascending Triangle forming in an uptrend near a resistance level with high volume is a strong signal of a breakout. Measuring the height of the triangle and projecting it from the breakout point offers a potential price target, allowing traders to set informed profit levels.
  4. Volume as a Confirmation Tool
    Volume plays a crucial role in confirming the reliability of candlestick patterns. Increased volume during the formation of a pattern—such as a Bearish Engulfing—can indicate stronger market commitment and enhance the signal’s reliability.

    • Example: A Bullish Engulfing pattern at a support level, accompanied by rising volume, signifies that buyers are taking control, increasing the likelihood of a reversal.
  5. Multi-Timeframe Analysis for Higher Accuracy
    Using candlestick patterns across multiple timeframes adds another dimension to their effectiveness. Patterns on higher timeframes, such as daily or weekly charts, often carry more weight, while shorter timeframes like 5-minute charts can fine-tune entry and exit points.

    • Example: A Bullish Engulfing on a daily chart signals a potential trend reversal. When confirmed by a smaller timeframe, like an hourly Hammer, it provides a more precise entry point with reduced risk.

By considering these advanced interpretations, traders can better leverage Japanese Candlestick Patterns as part of a holistic strategy, enhancing both the timing and reliability of trading decisions.
推荐产品
Enigmera MT5
Ivan Stefanov
3.67 (3)
Enigmera 是一款用于 MetaTrader 5 的手动指标与交易系统。它利用分形周期计算支撑与阻力位,标记积累阶段,并绘制当前走势的方向与目标。该分析在趋势行情与回调行情中均适用。 该指标通过图表上的按钮手动操作。可以在 MetaTrader 策略测试器的可视模式下运行,在购买前查看它在历史数据上的表现;部分由按钮控制的功能在测试器中的表现可能与实盘图表不同。 工作原理 指标根据品种的分形周期推导出当前趋势的支撑线、支撑线周围的允许偏离通道、三个偏离水平以及目标线。支撑线定义了市场状态:价格保持在其上方时趋势延续,跌破该线则表示趋势改变。已经绘制的线条不会重绘。 大部分功能通过图表左侧的按钮控制,因此可以在市场状况变化时快速调整显示内容。 按钮 ON/OFF:显示或隐藏整个指标。 Support:趋势的主支撑线。 Ch:启用支撑通道,显示允许的偏离范围。 Dev1:价格在支撑偏离范围内运行,表示盘整或积累。 Dev2:价格在各偏离水平之间运行,表示趋势形成及其方向。 Dev3:价格运行显示趋势加速与波动加大。 45deg:显示市场相对于 45 度线的运行速度。 Tgt:趋势的目
可以说,这是您可以为MetaTrader平台找到的最完整的谐波价格形成自动识别指标。它检测19种不同的模式,像您一样认真对待斐波那契投影,显示潜在的反转区域(PRZ),并找到合适的止损和获利水平。 [ 安装指南 | 更新指南 | 故障排除 | 常见问题 | 所有产品 ] 它检测19种不同的谐波价格形态 它绘制了主要,衍生和互补的斐波那契投影(PRZ) 它评估过去的价格走势并显示每个过去的形态 该指标分析其自身的质量和性能 它显示合适的止损和获利水平 它使用突破来表明合适的交易 它在图表上绘制所有样式比率 它实现了电子邮件/声音/视觉警报 受斯科特·M·卡尼(Scott M. Carney)的书的启发,该指标旨在满足最纯粹和最熟练的交易者的需求。但是,它采取了一种使交易更容易的方式:在向交易发出信号之前,它会等待Donchian朝正确方向突破,从而使交易信号非常可靠。 斐波那契投影与向量无关 它实现了电子邮件/声音/推送警报 它绘制了ABCD投影 重要提示: 为了符合 Scott M. Carney先生 的商标申诉,某些图案名称已重命名为不言自明的替代方式, Scott M.
Overview Harmonic Patterns MT5 is a technical analysis indicator designed for the MetaTrader 5 platform. It identifies and displays harmonic price patterns, such as Butterfly, Cypher, Crab, Bat, Shark, and Gartley, in both bullish and bearish directions. The indicator calculates key price levels, including entry, stop loss, and three take-profit levels, to assist traders in analyzing market movements. Visual elements and customizable alerts enhance usability on the chart. Features Detects six ha
Harmonic Pattern Hunter
Shingidzano Lesetedi
5 (1)
Harmonic Pattern Hunter Harmonic Pattern Hunter is a technical indicator for MetaTrader 5 that automatically identifies and draws high-probability harmonic patterns directly on the chart. It is designed to assist traders who use harmonic analysis as part of their trading methodology. How It Works The indicator scans historical and live price data for completed XABCD harmonic structures using Fibonacci ratio validation. When a valid pattern is detected, it draws the full pattern geometry, marks t
"Impulses and Corrections 5" is created to help traders navigate the market situation. The indicator shows multi-time frame upward and downward "Impulses" of price movements. These impulses are the basis for determining the "Base" , which is composed of zones of corrections of price movements, as well as "Potential" zones for possible scenarios of price movement. Up and down impulses are determined based on a modified formula of Bill Williams' "Fractals" indicator. The last impulse is always "U
Reversal Master for MT5
Alexey Minkov
5 (1)
Reversal Master for MT5 Reversal Master for MT5 是一款适用于 MetaTrader 5 的不重绘反转指标。它可以帮助您识别潜在的市场反转点,并在每一个历史信号之后显示价格的最大有利运动幅度,从而让您更好地理解价格在类似历史情形中的运行方式。 MT5 版本保留了原始 MT4 版 Reversal Master 熟悉的反转信号逻辑,同时增加了更好的可视化效果、历史统计以及基于点值的汇总面板。该指标可在 MetaTrader 5 支持的任意品种和任意时间周期上运行,可用作独立的反转分析工具、作为您交易系统中的附加确认过滤器,或作为智能交易系统(Expert Advisors)的信号来源。 Key Features 自动检测潜在的趋势反转点。 不重绘箭头:信号在 K 线收盘后固定,不会移动或消失。 两个工作模式:Mode 1 Classic(经典 MT4 风格逻辑)和 Mode 2 Advanced(带统计模块)。 Max Potential 数值,用于显示历史信号之后价格的最大有利运动幅度(Mode 2)。 内置点值汇总面板,显示正/负/总计等
Candle hunter
Ruslan Khasanov
5 (1)
圖形分析指標。 在圖表上標記主要的日本燭台形態。 目前,交易者可以使用以下一組模式:  - Bearish/Bullish Abandoned Baby;  - Bearish Advance Block;  - Bearish Deliberation;  - Bearish/Bullish Belt Hold;  - Bearish/Bullish Engulfing;  - Bearish Shooting Star;  - Bearish Evening Star;  - Bearish Evening Doji Star;  - Bearish/Bullish Doji Star;    - Bearish/Bullish Tri-Star;  - Bearish Hanging Man;  - Bearish/Bullish Harami;  - Bearish/Bullish Harami Cross;  - Bearish Two Crows;  - Bearish Identical Three Crows;  - Bearish Three Black Crows
CosmiCLab FIBO
Kirils Subins
CosmiCLab SMC FIBO CosmiCLab SMC FIBO is a professional trading indicator designed for traders who use Smart Money Concepts (SMC), market structure analysis and Fibonacci retracement levels. The indicator automatically detects market swings and builds Fibonacci levels based on the latest impulse movement. It also identifies market structure changes such as BOS (Break of Structure) and CHOCH (Change of Character), helping traders understand the current market direction. CosmiCLab SMC FIBO also pr
AutoTrend Pro
Aram Hussein Mohammed
TL Method — Automatic Trendline Detection & Strength Indicator Tired of drawing trendlines manually? TL Method does it for you — automatically detecting, drawing, and scoring trendlines in real time. What it does: Scans up to 1000 bars to find valid support and resistance trendlines Scores each trendline by counting confirmed anchor touches Generates buy/sell signal arrows when price approaches strong trendlines Alerts you via popup, push notification, or sound — with smart cooldown to avoid spa
RSI Divergence Risk Target Signals RSI Divergence Risk Target Signals is a MetaTrader 5 indicator that detects confirmed bullish and bearish RSI divergence and combines the signals with optional trend filters, ATR-based Stop Loss levels, three Take Profit targets, alerts and an internal trade statistics dashboard. The indicator compares confirmed RSI pivot structure with corresponding price highs and lows. It is designed to help traders identify momentum divergence while providing a structure
Cumulative Volume Delta MA-X MTF(带梯度动量) 该指标为 MetaTrader 5 提供多时区累积成交量德尔塔(CVD)分析。它通过分析报价成交量(Tick Volume)或真实成交量(Real Volume)数据,计算买盘与卖盘压力之间的净差值,从而直观地展示订单流(Order Flow)情绪。 指标逻辑与特性 本指标采用数学方法进行成交量分析: 数据来源 :支持交易所资产的 真实成交量 (Real Volume) ,以及针对外汇/CFD 市场的 OHLC 影线代理算法 (OHLC Wick Proxy) 。 梯度系统 :4 色移动平均线用于识别趋势阶段: 深天蓝 (DeepSkyBlue) :数值为正且正在上升。 橙色 (Orange) :数值为正但正在下降。 洋红色 (Magenta) :数值为负且正在下降。 紫色 (Purple) :数值为负但正在上升。 五层共振系统 (5-Layer Confluence System) 指标集成了五种不同的分析方法: 第一层:成交量德尔塔核心 (Volume Delta Core) —— 计算成交量德尔塔的
GANN Master 为当前的日、周或月绘制江恩(W. D. Gann)平方根水平,并标出买方与卖方目标相遇的区域。水平由上一周期的最高价和最低价计算,在整个周期内保持不变,不会重画。 水平如何构建 上一周期的最高价成为 TOP 线,其最低价成为 BOTTOM 线。指标从 TOP 向下量出三个看跌目标(Bears' interest 1、2 和 3),从 BOTTOM 向上量出三个看涨目标(Bulls' interest 1、2 和 3),使用江恩的平方根步长 1/8、2/8 和 3/8。 江恩计算始终需要一个比例。GANN Master 会自行选择:它尝试每一个比例,并保留使看涨线与看跌线彼此最接近的那一个。当一条看跌线与一条看涨线相互靠近时,双方的利益就在此相遇。指标把这些位置着色为共同利益区域。每个周期最多绘制五个区域。 每个区域周围有两条虚线的区域突破线,位于该区域上方和下方,距离为 TOP-BOTTOM 区间的 1/8。TOP 和 BOTTOM 周围也有一条同样大小的着色带。 图表上显示的内容 TOP 与 BOTTOM、六条江恩线及其名称,显示在当前K线的右侧 当前日、周或
Exp5 Duplicator
Vladislav Andruschenko
4.78 (9)
Duplicator for MetaTrader 5 —— 单终端内的专业持仓复制系统 这是一款面向专业交易者的可靠 Expert Advisor,用于在 MetaTrader 5 中自动复制已经打开的持仓、放大总仓位、应用自定义手数规则,并按照明确的逻辑管理复制出来的持仓。 它非常适合手动交易者、自动化系统使用者,以及希望在同一个终端内更灵活地管理已有持仓的用户。 Duplicator for MT5 并不会依靠自己的交易策略主动开仓。它的职责是监控 MetaTrader 5 账户中已经存在的持仓,并根据你的设置创建对应副本,包括复制次数、手数、Stop Loss、Take Profit、注释以及额外的管理条件。 如果你需要的是 同一个 MetaTrader 5 终端内部 的持仓复制工具,而不是不同平台或不同终端之间的复制系统,那么 MT5 版 Duplicator 正是为这种需求而设计。 MT4 版本 详细描述 + DEMO + PDF 如何购买 如何安装 如何获取日志文件 如何测试和优化 Expforex 的所有产品 链接 如果你需要 MetaTrader 终端之间 的交易复
Scan pattern
VLADISLAV AKINDINOV
The indicator is designed to help in making a decision on the direction of trading (buy or sell). It is a history scanner that searches for matches of the current pattern (combination of several current bars) with historical data in percentage terms by the relative vertical position of candles relative to each other, the size of each candle, the size of the candle body and the candle shadows. In history, the matches found are indicated by vertical lines on the candle of the beginning of the soug
极值突破信号 是一种基于价格突破关键支撑和阻力位的交易策略。当价格突破这些极值点时,通常意味着市场趋势发生变化,交易者可捕捉到新的上涨或下跌机会。 参数 extreme radius:极值半径(不同周期可以设置不同参数) 核心原理 支撑与阻力 :价格在支撑或阻力位附近往往受限,突破后可能引发新趋势。 突破确认 :突破后需确认有效性,通常结合成交量或其他指标。 信号类型 买入信号 :价格突破上方阻力位,可能进入上涨趋势。 卖出信号 :价格突破下方支撑位,可能进入下跌趋势。 应用 确认突破 :结合其他技术指标(如成交量、RSI、MACD)确认突破的有效性。 止损止盈 :止损设在突破前的支撑/阻力位,止盈根据市场波动设置。 优缺点 优点 :有助于提前抓住趋势初期,适用多种市场。 缺点 :假突破的风险较高,震荡行情中效果差。 总结 :极值突破信号有助于捕捉新趋势,但需要结合其他指标,避免假突破带来的风险。
Titan Action HUD Titan Action HUD, MetaTrader 5 terminali içinde piyasa izlemeyi optimize etmek için tasarlanmış kapsamlı çok zaman dilimli analitik bir gösterge panelidir. Birden fazla dönemden alınan gerçek zamanlı teknik verileri tek bir ekrana toplayarak, çeşitli grafikler arasında sürekli geçiş yapma ihtiyacını ortadan kaldırır. Panel, piyasa ortamlarını sürekli tarar, yapısal trendleri, hacim metriklerini ve aktif işlem oturumlarını birleşik bir görsel matriks içinde gösterir. 6.10 sürümün
CyberTradeTHxAI Gold Sniper MT5 Professional Gold Trading Signal Indicator for MetaTrader 5 CyberTradeTHxAI Gold Sniper MT5 is a professional-grade Gold (XAUUSD) trading indicator developed to identify high-probability Buy and Sell opportunities using trend analysis, pullback confirmation, and intelligent market structure detection. Designed for both beginner and advanced traders, the indicator automatically calculates optimal Entry Zones, Stop Loss, and multiple Take Profit levels while provid
MercariaPattern1-2-3 відстежує рух ціни, знаходить трьоххвильові структури 1-2-3 та підсвічує момент, коли сценарій підтверджується пробоєм ключового рівня. MercariaPattern1-2-3 tracks price movement, detects three-leg 1-2-3 structures and highlights the moment when the scenario is confirmed by a key level breakout. Індикатор збирає локальні свінги в компактну фігуру 0–1–2–3 , чекає підтвердженого пробою та будує стрілку входу з готовими рівнями SL/TP. The indicator combines local swings into a
Cycle Projection Pro is a cyclical analysis indicator for MetaTrader 5, designed for the Daily timeframe. It identifies and projects recurring price cycles forward in time, helping you estimate when — not how much — the market may be approaching a turning point. How it works The indicator sums six harmonic cycles with explicit periods — Weekly, Biweekly, Monthly, Quarterly, Semiannual, Annual — each independently adjustable and can be turned on or off. Their combination produces a composite wav
MetaTrader 5 智能多层突破与回调探测器 "智能 · 简单 · 快速!" 您是否厌倦了错过高概率的突破入场机会? 您是否花费数小时扫描多张图表,试图将突破与趋势方向和货币动能对齐——却仍然错过了行情? Break Pullback 用一个指标解决所有这些问题。 什么是 Break Pullback? Break Pullback 是一款专业级 MetaTrader 5 指标,专为交易市场结构、突破和趋势延续形态的交易者而设计。 它能实时自动检测多个货币对的突破与回调形态——并通过三层确认过滤每个信号: 结构突破检测——识别图表上的关键突破位 高时间框架日线偏向——将入场与主导日线趋势方向对齐 货币强弱指数——确认配对货币间的动能失衡 结果:更少的虚假信号,更强的信心,更快的执行——无需面对图表过载。 适合哪些交易者? Break Pullback 专为使用以下方法的交易者设计: 突破与回测策略 市场结构分析(BOS、 OB Order Block 、结构位) 聪明钱概念(SMC)或 ICT 风格入场 趋势跟踪与延续形态 跨外汇和黄金(XAUUSD)的多对扫描 日内和波段
Overview Mirror Signals Service EA (Text only)   is a powerful monitoring Expert Advisor that automatically sends   real-time Telegram notifications   for all important trade events on your MetaTrader 5 account. It is engineered specifically for   signal providers ,   trade-copier operators ,   auditors ,   educators , and   professional trading services   that require immediate, detailed, and reliable reporting. Everything from   entries, exits, SL/TP changes, comment changes, trailing sto
适用于 MetaTrader 5 的 Rhino Chart Drawing Tools Rhino Chart Drawing Tools 为 MetaTrader 5 提供类似 TradingView 的绘图操作体验。它包含 54 种绘图工具、可自定义工具栏、收藏夹、快速样式设置、对象设置、模板以及对象管理器。 绘图工具 线条 趋势线、射线、延长线、水平线、垂直线、水平射线、十字线、趋势角、箭头、路径、折线和信息线。 通道 平行通道、回归通道、水平通道、分离通道和斐波那契扩展叉。 斐波那契 回撤、扩展、通道、速度扇和时间区间。 江恩 江恩箱和江恩扇。 形状 矩形、旋转矩形、椭圆、圆形、三角形和折线。 标注 文本、备注、标注框、价格标签、指示标记、旗帜和箭头标记。 形态 XABCD、ABCD、Cypher、头肩形、三角形、三驱动、艾略特推动浪和艾略特调整浪。 投影 多头仓位、空头仓位、预测、价格范围、日期范围以及日期和价格范围。 画笔 自由绘制画笔和荧光笔。 时间和价格坐标 绘图对象使用 时间和价格 坐标保存锚点。对象显示时,根据这些坐标计算屏幕像素位置。 因此,当图表缩放、滚动、调
+++++++++++++++++++++++++++++++++++++++++++++++++++++++++++++++++++++++++++++++++++++++++++++++++++++++ +++ Link to EURUSD Only Free Version -->  https://www.mql5.com/en/market/product/156904 +++ Full License -->  https://www.mql5.com/en/market/product/156842 +++++++++++++++++++++++++++++++++++++++++++++++++++++++++++++++++++++++++++++++++++++++++++++++++++++++ +++ XMAS SALE +++ Get this indicator for free when renting the Forecast System Full License  (one license for one account)   +++ Please
Here   our more valuable tools SMC Trend Trading   ,  Easy SMC Trading  ,  Institutional SMC Architect Volume Analysis Tools  ,  Volume flow Profile  ,  Market volume profile  , FVG with Volume  , Liquidity Heatmap Profile  ,  Volume Spread Analysis The    Liquidity Heatmap   is a sophisticated institutional trading tool designed to reveal where over-leveraged traders are trapped. By calculating estimated liquidation levels based on volume spikes and leverage, this indicator draws a dynamic "h
VELOS Trading Indicator Precision. Speed. Confidence. The VELOS Trading Indicator is a professional, non-repainting MT5 trading system developed by DC Trading to help traders identify high-probability trading opportunities with confidence. Designed for both beginner and experienced traders, VELOS combines trend analysis, momentum confirmation, and volatility filtering into one intelligent indicator, delivering precise entry and exit signals while reducing false setups. Built for fast-moving m
Trend Master V2
Oratile Pitsoane
What Is Trend Master Pro? Trend Master Pro   is a professional-grade trend trading indicator built for MetaTrader 5. It was designed with one goal in mind — to keep you on the right side of the market at all times by combining three powerful technical tools into a single, clean, easy-to-read display directly on your price chart. Instead of cluttering your screen with multiple separate indicators, Trend Master Pro fuses an   EMA Ribbon trend filter , a   ZigZag swing point engine , and a   breako
Usdjpy Trend Follower
Marcos Ramon Aparicio Pelaez
Trade USDJPY automatically with a robust, backtested MetaTrader 5 robot. Momentum Master H1 uses a high-probability long-only strategy based on dynamic Bulls Power and ATR-based entries. Key features include: Time-tested: Backtested from 2019–2025 on H1 charts. Precision entries: Long trades triggered on short-term pullbacks and confirmed trend signals. Smart risk management: ATR-based Stop Loss and Profit Targets for adaptive sizing. Flexible trading hours: Works all week, configurable session
RBreaker
Zhong Long Wu
RBreaker Gold Indicators 是黄金期货一种短线日内交易策略,它结合了趋势跟踪和日内反转两种交易方式,既能捕捉趋势行情的利润,又能在行情反转时及时止盈并顺势反手。 该策略曾连续15年被美国《Futures Truth》杂志评选为前十大最赚钱的交易策略之一,具有很长的生命周期,至今仍在国内外普遍使用与研究。 本指标结合了2026年期货黄金的走势,依据14日ATR指标,分别定义了突破系数A,观察系数B,反转系数R更合理的数值,非常不错的指标,已实现年稳定盈利,值得推荐~ 以上指标适合高波动品种,参数适合期货黄金,股指期货等,如果需要其他品种行情,需要单独设定 突破系数A,观察系数B,反转系数R,进行回测才能使用。 欢迎指标售后有问题可以加+V:504282029
Overview The Market Perspective Structure Indicator is a comprehensive MetaTrader indicator designed to provide traders with a detailed analysis of market structure across multiple timeframes. It identifies and visualizes key price action elements, including swing highs and lows, Break of Structure (BOS), Change of Character (CHOCH), internal structures, equal highs/lows, premium/discount levels, previous levels from higher timeframes, and trading session zones. With extensive customization opt
该产品的买家也购买
Trend Sniper X
Sarvarbek Abduvoxobov
4.9 (39)
Trend Sniper X 是一款适用于 MetaTrader 5 的多周期趋势跟踪指标,可帮助交易者清晰精准地识别趋势方向和潜在的反转点。 适用于 MT4: https://www.mql5.com/en/market/product/193245 价格信息: 当前价格为促销价,随着后续更新和新功能的推出,价格可能会有所变动。 赠品优惠: 购买后联系作者,即可免费获取该指标的 Auto-Trade Assistant EA(自动交易助手 EA)。 Code2Profit 频道 通过多时间框架分析掌控市场! 如何使用 Trend Sniper X 最大化您的胜率:核心规则与交易时段技巧 技术规格 平台 MetaTrader 5 指标类型 多时间周期趋势指标 运行时间周期 任何图表时间周期,可独立选择更高的时间周期 (M1–MN1) 主要交易品种 外汇、黄金 (XAUUSD) 及其他差价合约 (CFD) 推荐账户 任何账户类型 可视化 彩色趋势蜡烛 (买入/卖出/微弱/变化) + 买入/卖出箭头 附加模块 交易时段方框 (悉尼、东京、伦敦、纽约) 主要功能 多时间周期趋势分析: 直接在
Neuro Poseidon MT5
Daria Rezueva
4.75 (52)
Neuro Poseidon is a new indicator by Daria Rezueva. It combines precise trading signals with adaptive TP/SL levels - creating best possible trades as a result! Message me and get  Neuro Poseidon Assistant  as a gift to automize your trading process! What makes it stand out? 1. Proven profitability on all assets and timeframes 2. Only confirmed BUY and SELL signals present on the chart 3. Adaptive TP & SL levels generated by the software for each trade 4. Easy to understand - suitable for al
Gann Made Easy MT5
Oleg Rodin
5 (10)
Gann Made Easy   是一个专业且易于使用的外汇交易系统,它基于使用先生理论的最佳交易原则。 W.D.江恩。该指标提供准确的买入和卖出信号,包括止损和获利水平。您甚至可以使用推送通知在旅途中进行交易。 购买后请联系我,即可免费获得交易指导和超棒的额外指标! 您可能已经多次听说过江恩交易方法。通常 Gann 的理论不仅对于新手交易者而且对于那些已经有一定交易经验的人来说都是非常复杂的东西。这是因为江恩的交易方法在理论上并不那么容易应用。我花了几年时间来完善这些知识,并将最好的原则应用到我的外汇指标中。 该指标非常易于应用。您所需要的只是将其附加到您的图表并遵循简单的交易建议。该指标不断进行市场分析工作并寻找交易机会。当它检测到一个好的入口点时,它会为您提供一个箭头信号。该指标还显示止损和获利水平。 换句话说,当您像先生一样进行交易时,该指标会为您提供最佳江恩建议。江恩亲自告诉你此时此刻该做什么。但最好的部分是您不需要了解任何有关江恩交易原则的知识,因为该指标会为您完成整个市场分析工作。
M1 Sniper MT5
Oleg Rodin
5 (7)
M1 SNIPER   是一款易于使用的交易指标系统。它是一个专为 M1 时间框架设计的箭头指标。该指标可以作为独立的系统在 M1 时间框架下进行剥头皮交易,也可以作为您现有交易系统的一部分使用。虽然该交易系统专为 M1 时间框架交易而设计,但它也可以用于其他时间框架。我最初设计此方法是为了交易 XAUUSD 和 BTCUSD。但我发现这种方法在其他市场交易中也同样有用。 指标信号既可以顺势交易,也可以逆势交易。我教授一种特殊的交易技巧,帮助您利用指标信号进行双向交易。该方法基于使用特殊的动态支撑位和阻力位区域。 购买后,您可以立即下载 M1 SNIPER 箭头指标。此外,我还为所有 M1 SNIPER 工具用户免费提供下方屏幕截图所示的 Apollo Dynamic SR 指标!这两个指标的组合可以帮助您更轻松、更准确地利用 M1 时间框架进行交易。 购买后请联系我,免费获取交易提示和奖励指标! 祝您交易成功!
Entry Points Pro for MT5
Yury Orlov
4.52 (151)
传奇回归:Entry Points Pro 10。 这款传奇指标曾 3 年稳居 MQL5 Market 前三,如今全面重启。 数百条热情好评(两个版本合计 589 条),每天有数千名交易者用它交易,演示版下载 31,000+   MT4+MT5  次。 五年来我读过你们的每一条评价——在第 10 版里,我没有给出许诺,而是把答案直接做进了产品。指标作者自 1999 年入市, 珍视诚信、自己的声誉和自己的客户 。 Entry Points Pro 给出的入场信号严格不重绘。 而且这一次不再只是作者的一面之词,而是可验证的事实:确认信号只在 K 线收盘后标出,自动化测试记录到 零重绘 (在 EURUSD、XAUUSD 和 BTCUSD 上共 2,486,568 次不变量检查——0 次违规)。测试方法完全公开——您可以在策略测试器中自行复现。 购买后请务必第一时间给我发私信。 我会发给您 扩展版说明书《交易者圣经》 ——使用本指标交易的完整指南——并告诉您如何免费获得 赠品:市场扫描器 ,它能同时分析多个品种和多个时间周期,并在一个界面上显示 Entry Points Pro 此刻在哪里表现
货币强度向导是一个非常强大的指标,为您提供成功交易的一体化解决方案。该指标使用多个时间范围内所有货币的数据来计算这个或那个外汇对的力量。此数据以易于使用的货币指数和货币电力线的形式表示,您可以使用它们来查看这种或那种货币的力量。 您所需要的只是将指标附加到您要交易的图表上,该指标将向您显示您交易的货币的真实强度。该指标还向您显示买卖量压力的极值,您可以在顺势交易时利用这些压力。该指标还显示了基于斐波那契的可能目标。该指标可用于各种交易时间范围。该指标支持各种货币对的交易。   该指标为您提供所有类型的警报,包括推送通知。 购买后请联系我。我将与您分享我的交易技巧,并免费为您提供丰厚的红利指标! 祝您交易愉快,获利丰厚!
M1 Quantum MT5
Hamed Dehgani
4.2 (10)
使用 M1 Quantum 的实盘交易信号 : 信号 (交易由 Quantum Trade Assistant 自动 执行,并作为本产品 免费 提供。) 最新消息: 版本 1.64 已发布。现在所有交易的止损都会设置在相应的支撑位/阻力位之后。Smart Close 功能也进行了改进,以提升此版本 EA 的性能。 自 8 月 9 日起,实盘信号一直运行在版本 1.64 上。 价格计划: 当前价格: $169 (早期用户优惠) 下一阶段计划价格: $189 计划零售价: $299 开发者提示: 购买后请联系我,以获取 最新推荐的参数设置文件(Set File) 、交易建议,以及加入 VIP 支持群组 ,与其他 M1 Quantum 用户交流经验。 常见问题 - 设置文件 - 安装指南 M1 Quantum 是一款专业的 M1 交易系统,提供快速且精准的交易信号,并内置止损(Stop Loss)、止盈(Take Profit)以及智能资金管理功能。 M1 Quantum 包含专业的资金管理系统,通过专注于 连续盈利交易 ,帮助交易者更快地增长账户资金。 M1 Quantum 指标 的主
Volatility Master for MetaTrader is a real-time dashboard tool that scans up to  50 symbols  to identify high-volatility , trending markets instantly. With bullish/bearish signals, customizable alerts, and a user-friendly interface, it helps you avoid range-bound conditions and focus on high-probability trades. Clarity leads to confidence. Trade confidently and protect your capital effectively with this powerful dashboard. We don't offer free or bonus indicators in exchange of reviews from you.
PZ Trend Trading MT5
PZ TRADING SLU
3.8 (5)
许多盈利交易者不仅知道如何识别市场趋势,而且也能把握趋势建立后的交易机会。 Pz 趋势交易 指标设计用来在趋势行情中尽可能的赚取利润。 已建立的趋势提供了一揽子交易机会,但大多数趋势交易指标完全忽视了它们,让交易者在趋势行情时完全不知道该如何做!一般趋势指标只通知有关的趋势变化,但根本不足以得到卓越的回报. Pz 趋势交易 指标比一般趋势指标显示多达 20 倍的交易 , 因为它注重所谓的市场时机。它不仅显示当前的市场趋势,也有回调,内柱线的突破和调整。它令您在趋势回调之后介入,安全的柱线内突破金字塔加仓,以及发现潜在的反转,和已知的调整。 趋势改变 一个趋势改变在市场方向变化时发生。趋势变化在图表上用带数字的彩色圆圈显示。蓝色 (1) 信号为上涨开始, 而红色 (1) 信号为下跌开始。趋势变化并非评估当前价格动作的结果, 它意味着交易设置是不定时地。如果您正确使用本指标, 在趋势变化时, 您将将已经入场 (参看下面的调整)。 回调 但凡趋势在运动中,行情上下抖动,盈利者收割利润,且其它参与者入场。趋势回调代表好的买入机会,通常是由主力获利离场导致。如果行情在回调后回归上行, 指标将
Scalper Vault   是一个专业的剥头皮系统,为您提供成功剥头皮所需的一切。该指标是一个完整的交易系统,可供外汇和二元期权交易者使用。推荐的时间范围是 M5。 该系统为您提供趋势方向的准确箭头信号。它还为您提供顶部和底部信号以及江恩市场水平。无论您拥有何种交易经验,该系统都易于使用。您只需要遵循简单的规则并每天重复该过程。 建议将此系统用于主要货币对。感谢您的关注! 请注意,该指标在策略测试器中可能无法正常工作。因此,我建议仅在模拟或真实账户的真实交易条件下使用该系统。 指示器提供所有类型的警报,包括推送通知。 购买指标后请与我联系。我将免费与您分享我的个人交易建议和出色的奖励指标! 祝您交易愉快,盈利!
IQ FX Gann Levels a precision trading indicator based on W.D. Gann’s square root methods . It plots real-time, non-repainting support and resistance levels to help traders confidently spot intraday and scalping opportunities with high accuracy. William Delbert Gann (W.D. Gann) was an exceptional market analyst, whose trading technique was based on a complex blend of mathematics, geometry, astrology, and ancient mathematics which proved to be extremely accurate. We don't offer free or bonus indic
Divergence Bomber
Ihor Otkydach
4.89 (94)
购买该指标的每位用户将额外免费获得以下内容: 原创工具“Bomber Utility”,该工具会自动跟踪每一笔交易,设置止损和止盈点,并根据策略规则自动平仓; 适用于不同交易品种的指标设置文件(Set 文件); 三种不同风险模式下的 Bomber Utility 设置文件:“最低风险”、“平衡风险” 和 “观望策略”; 一套详细的 视频操作手册,帮助您快速完成安装、配置并开始使用本交易系统。 注意: 要获取以上所有赠品,请通过 MQL5 的私人消息系统联系卖家。 我为您介绍原创的自定义指标 “Divergence Bomber”(背离轰炸机),它是一套基于 MACD 背离交易策略 的“全功能”交易系统。 该技术指标的主要任务是识别 价格与 MACD 指标之间的背离,并发出交易信号(包括推送通知),指示未来价格可能的运动方向。平均而言,这些信号的准确率超过 98%。有关该指标如何工作的详细说明,请观看本页面上的视频演示。 该系统使用 止损订单 和 动态回撤平仓机制 来管理交易。 Divergence Bomber 指标的主要特点: 支持交易的品种: AUDCAD、AUDCHF、AUDS
First time on MetaTrader, introducing IQ Star Lines - an original Vedic Astrology based indicator. "Millionaires don't use astrology, billionaires do" . - J.P. Morgan, Legendary American financier and banker. We don't offer free or bonus indicators in exchange of reviews from you. You won't need any free products with this indicator to make it work. ;) Enjoy! Welcome to  the new and updated  IQ Star Lines , the ultimate fusion of ancient planetary harmonic cycles and modern quantitative trading.
Gartley Hunter Multi
Siarhei Vashchylka
5 (12)
Gartley Hunter Multi - An indicator for searching for harmonic patterns simultaneously on dozens of trading instruments and on all possible timeframes. Manual (Be sure to read before purchasing) | Version for MT4 Advantages 1. Patterns: Gartley, Butterfly, Shark, Crab. Bat, Alternate Bat, Deep Crab, Cypher 2. Simultaneous search for patterns on dozens of trading instruments and on all possible timeframes 3. Search for patterns of all possible sizes. From the smallest to the largest 4. All fou
SkyHammer Signal Pro
Shengzu Zhong
5 (4)
SkyHammer Signal Pro Professional No-Repaint Trend Signal Indicator with Locked Entry, SL and TP Levels SkyHammer Signal Pro is a structured trend and momentum signal indicator designed for traders who want clear, fixed, and verifiable trading signals. It works best on lower timeframes such as M1 and M5 . The indicator does not try to predict tops or bottoms. Instead, it waits for confirmed market structure, trend direction, momentum strength, volatility quality, and target space before generati
PZ Divergence Trading MT5
PZ TRADING SLU
3.71 (7)
棘手的发现和频率稀缺是最可靠的交易方案之一。该指标使用您喜欢的振荡器自动查找并扫描常规和隐藏的发散。 [ 安装指南 | 更新指南 | 故障排除 | 常见问题 | 所有产品 ] 容易交易 发现常规和隐藏的分歧 支持许多知名的振荡器 根据突破实现交易信号 显示适当的止损和获利水平 可配置的振荡器参数 可自定义的颜色和尺寸 按条形过滤大小差异 实现绩效统计 它实现了电子邮件/声音/视觉警报 为了提供广阔的市场前景,可以使用不同的振荡器在同一张图表中多次加载该指标,而不会产生干扰。该指标支持以下振荡器: RSI CCI MACD OSMA 随机 动量 很棒的振荡器 加速器振荡器 威廉姆斯百分比范围 相对活力指数 由于差异可能会扩大很多,尤其是在外汇市场中,因此该指标产生了转折:它在等待交易突破之前等待donchian突破确认差异。最终结果是带有非常可靠的交易信号的重新粉刷指示器。 输入参数 幅度:用于寻找差异的之字形周期 振荡器-选择要加载到图表的振荡器。 突破期-交易信号的突破期,以柱为单位。 发散类型-启用或禁用发散类型:隐藏,常规或两者。 最小散度单位为条形-最小散度单位为条形
Superhero
Ihor Otkydach
5 (3)
SUPERHERO 指標是一款基於「全方位」原則設計的多貨幣交易系統。該指標能獨立分析市場,並提供開倉與平倉的交易訊號。它採用止損與獲利了結訂單,風險報酬比(R:R)為 1:1。 此系統可向您的智慧型手機發送推播通知,讓您無需綁定電腦,即可「隨時隨地」進行交易。這對於自營交易公司而言再適合不過了。 每位顧客皆可享額外好禮: 每位購買此指標的買家,都將收到我贈送的一項特別實用工具,該工具: 自動下達止損與獲利了結訂單 當價格達到目標水準時,系統會自動平倉 支援待執行訂單交易 支援均值交易模式 如果您希望將這款優秀且極為便利的工具作為禮物獲贈,請在購買 SUPERHERO 指標後,立即透過 MQL5 平台的私訊與我聯繫。此外,您還將獲得培訓課程「如何安裝與設定 SUPERHERO 並開始穩定獲利」的存取權限。 關於「超級英雄」策略 SUPERHERO 策略是利用價格回調時,順應趨勢方向進行盤中交易。 「超級英雄」程式碼內含數個強大的技術指標,用以分析價格通道的趨勢方向與波動範圍,並能識別在修正性回調後形成的盤中波段反轉形態。 SUPERHERO 指標採用獨特的自我優化演算法,一旦添加至價格
Mahra Pro Indicator MT5
Mahra Said Mohammed Al Kaabi
Mahra Pro Indicator MT5 Overview Mahra Pro is a MetaTrader 5 chart indicator designed to support structured analysis of XAUUSD (Gold). It combines trend, momentum, volatility and price-structure conditions to identify potential buy and sell setups and display them directly on the chart. The indicator does not open, modify or close trades. All trading decisions and order execution remain under the user's control. Main features • Buy and sell signal arrows on the chart. • Fast and slow EMA lines w
Volume Profile Multiple — 多区块成交量分布指标,带缓冲区数据接口,支持算法交易 还在为每次切换周期都要重新绘制、重新计算成交量分布图而烦恼吗? Volume Profile Multiple 可在图表上自动绘制多个连续的成交量分布区块,揭示机构资金在市场各个阶段的真实活动区域——而不仅仅局限于最近可见的价格区间。 功能说明 该指标将历史价格按每 N 根K线划分为若干区块(区块数量和每区块的K线数量均可自定义),并为每个区块计算完整的成交量分布数据:控制点(POC)、价值区上下沿(VAH/VAL),以及高成交量节点和低成交量节点(HVN/LVN)。最终呈现的是一幅逐区块的市场结构可视化地图,便于识别基于真实成交量的筹码集中区、支撑阻力位,以及价格在不同价值区之间的轮动情况。 同样为算法交易而设计 与大多数成交量分布指标不同,本指标不仅提供可视化功能:它还输出 3个数据缓冲区 (最新区块的 POC、VAH、VAL),完全兼容 StrategyQuant X 以及任何 MQL5 智能交易系统(EA)。这意味着您可以直接基于这些关键价位构建交易策略,无需重新编写成交量
Presenting one-of-a-kind Gann Indicator for XAUUSD IQ Gold Gann Levels is a non-repainting, precision tool designed exclusively for XAUUSD intraday trading. It uses W.D. Gann’s square root method to plot real-time support and resistance levels, helping traders spot high-probability entries with confidence and clarity. William Delbert Gann (W.D. Gann) was an exceptional market analyst whose trading technique was based on a complex blend of mathematics, geometry, astrology, and ancient calculation
Quantum Direction 是一款专业的趋势跟踪指标,旨在识别市场方向、发现趋势早期变化,并提供经过过滤的入场和出场信号。 该指标包含免费的 Quantum Trade Assistant ,这是一款专业的交易管理工具,可在 MQL5 Market 获取。它可以直接连接到 Quantum Direction ,并在出现有效信号时自动开仓,或在满足设定的出场条件时自动平仓。 在此下载免费的 Quantum Trade Assistant 该指标的主要功能: 多逻辑趋势检测 — 结合多种市场分析条件,用于识别潜在的趋势开始以及趋势方向变化。 交易时段过滤器 — 将信号集中在所选择的交易时段,帮助您在市场活跃度和波动性较高的时期分析交易机会。 高周期过滤器 — 使用更高时间周期确认市场方向,并帮助减少由短期突破或暂时性市场方向变化产生的信号。 入场与出场提醒 — 提供多种入场和出场信号提醒方式,帮助您无需持续盯盘即可监控市场。 点数盈亏仪表盘 — 在图表上显示信号累计点数盈亏,以便快速进行历史评估和回测。 我将这套策略应用于自己的交易,并在 YouTube 频道记录我的交易历程。购买
UZFX {SSS} 超短线智能信号 v5.0 MT5 是一款无重绘的高性能交易指标,专为在快速波动的市场中需要精准、实时信号的超短线交易者、日内交易者和波段交易者设计。该指标由 (UZFX-LABS) 开发,融合了价格行为分析、趋势确认和智能过滤技术,可在所有货币对和时间周期内生成高概率的买卖信号、预警信号以及趋势延续机会。 别再对交易犹豫不决了,开始遵循这一专为追求清晰、精准和纪律性市场执行的交易者设计的结构化信号系统吧。 相信我,这是 MQL5 上最优秀的指标之一,所以千万不要错过!!“为睿智交易者打造的智能信号” 最新 5.0 版本现已发布,价格可能会在未事先通知的情况下上涨至 499.99 美元,所以请尽快入手,以免错失良机!! 最终购买前!如果您想获取免费试用版,请通过 WhatsApp 号码 +923030751987 联系我!! 如果您遇到任何问题“或”有任何不明白的地方,请在私聊中向我咨询!!! 主要功能更新 • 自动买入和卖出信号检测 • 先进的反转识别逻辑 • 潜在市场反转前的预警信号 • 趋势延续确认信号 • 内置风险管理功能,包含入场点、止损点、TP1、
Gem SIGNAL
Shengzu Zhong
5 (1)
GEM Signal Pro GEM Signal Pro 是一款適用於 MetaTrader 5 的趨勢跟隨指標,專為希望在圖表上獲得更清晰訊號、更有結構的交易設定,以及更實用風險管理的交易者而設計。 它不僅僅顯示一個簡單的箭頭,GEM Signal Pro 還能以更清晰、更易讀的方式呈現完整的交易思路。當條件確認完成後,指標可在圖表上顯示進場價、止損價與止盈目標,幫助交易者更有效率地評估交易設定。 運作方式 該指標首先根據其內部邏輯識別有效的初始訊號。 當確認條件滿足後,GEM Signal Pro 會在圖表上顯示完整的交易設定。這讓交易者可以更清楚地看到交易結構,並減少手動分析與計算的工作量。 圖表上的交易價位 對於已確認的訊號,GEM Signal Pro 可顯示: 進場價 止損價 止盈 1 止盈 2 止盈 3 風險報酬比 這讓交易設定更容易理解,也有助於讓圖表分析更有條理。 內建風險管理 風險管理是此指標設計的重要部分。 止損位基於近期市場結構,結合附近的擺動高低點與可選的 ATR 緩衝距離。這能讓交易價位更貼近當前市場條件,而不只是依賴固定距離。 圖表資訊面板 GEM Si
Btmm state engine pro
Garry James Goodchild
5 (4)
BTMM State Engine Pro by G-Labs — Beat The Market Maker indicator for MetaTrader 5. Asian session range, London and New York kill zones, level progression (L1/L2/L3), peak formation detection (PFH/PFL), entry signals, and a multi-pair scanner from one chart. Stop scanning charts one pair at a time. The State Engine tracks the BTMM daily cycle automatically — Asian box, room boundaries, level blocks, peak formations, and filtered entries — while the scanner dashboard shows level, peak status, d
SR Liquidity MT5
Oleg Rodin
5 (2)
SR Liquidity   是一款旨在揭示市场流动性高度集中且价格反应最剧烈的隐蔽区域的交易指标。这些特殊的流动性区域充当着强有力的支撑位与阻力位,为您清晰呈现市场最可能发生反转的位置。 SR Liquidity 指标并非简单地绘制常规的支撑/阻力线,而是通过分析实际的价格行为,识别买卖压力积聚的区域。这些区域实际上是推动市场真实波动的流动性池。通过在图表上直观呈现这些区域,该指标能助您在价格反应发生前预判走势——这意味着它实际上能够预测价格方向可能发生的变化。它将原始的价格行为转化为清晰且具实操价值的市场蓝图,标示出那些可能成为市场转折点的关键价位。 该指标适用于任何交易品种和时间周期——包括外汇、指数、金属、加密货币等。支持任意时间周期。 购买后请联系我,以获取交易指南及免费赠送的优质附加指标!
The Louis SMC & Liquidity Master is a complete, institutional-grade market structure and liquidity mapping system built for MetaTrader 5. Designed for serious Smart Money Concepts (SMC) traders, this tool dynamically tracks multi-timeframe trends, supply and demand zones, and critical liquidity sweeps without cluttering your chart. Whether you trade major Forex currency pairs or highly volatile synthetic indices like Boom and Crash, the indicator automatically adapts to price action, filtering
ARICoins
Temirlan Kdyrkhan
ARICoin is a powerful trading companion designed to generate high-probability entry signals with dynamic TP/SL/DP levels based on volatility. Built-in performance tracking shows win/loss stats, PP1/PP2 hits, and success rates all updated live. Key Features: Buy/Sell signals with adaptive volatility bands Real-time TP/SL/DP levels based on ATR Built-in MA Filter with optional ATR/StdDev volatility Performance stats panel (Success, Profit/Loss, PP1/PP2) Alerts via popup, sound, push, or email Cust
The Oracle Pro
Ottaviano De Cicco
5 (1)
The Oracle Pro:用于 MT5 的合成多周期偏向引擎 ️ 夏季上市优惠 — 早期买家可以 199 USD 获得 The Oracle Pro。价格将随关注度上升;最终价格 399 USD。 The Oracle Pro 是一款面向高要求与专业交易者的 MetaTrader 5 高级多周期 偏向引擎 。它以纪律回答一个问题:当前每个周期的方向偏向是什么、强度如何、各周期之间的一致程度如何?一切仅在已收盘的 K 线上计算——绝不重绘。 The Oracle Pro 是一套多因子共识系统。它将专有指标与优化算法整合为单一而精密的共识向量,并在单个指标实例内,跨当前周期与更高周期的堆栈进行读取——而不是在多个图表上堆叠互不相关的工具。 它是 Oracle 共识方法的专业进化版:完整重建为高级操作控制台,面向希望在一个纪律化工作流中获得深度、多周期背景与背离洞察的交易者。 是偏向引擎,而非信号生成器 The Oracle Pro 明确自身定位。它是一款提供纪律化方向背景的 多周期多因子偏向指标 。它 不是 信号生成器:不承诺入场、出场或盈利。偏向是背景——你在其方向上交易自己的设置
Ace Trend
Mikhail Sergeev
5 (3)
我们为您呈现一个革命性的指标,它改变了趋势交易世界的游戏规则。 该指标旨在重新思考性能并将您的交易体验提升到前所未有的高度。 我们的指标拥有先进功能的独特组合,使其有别于竞争对手。 "真实定价因素"的先进技术即使在最困难和最不稳定的市场条件下也能确保无与伦比的稳定性。 告别不稳定的模式,破碎的指标,欢迎有意识的,受控的交易。 该指标不仅仅是一个美丽的画面! 指标应该将赔率转移到交易者身边,从而赚取利润。 熟悉基于指标信号的交易结果(全自动模式): https://www.mql5.com/zh/signals/2339244 AceTrend在根据RBTI版本的趋势指标排名中排名第一。 AceTrend-最大的盈利能力和交易控制. 我们的指标根据当前市场报价而不是历史来突出盈利能力。 加入革命-释放您的交易经验的潜力! 指标不会在已形成的柱上重绘。 如果柱形已形成,指标读数保持不变。 该指标适用于从M1到MN的任何时间框架。 标准是H1时间框架。 您的反馈非常重要! 您有任何问题,建议,或只是想分享您的意见? 写评论或发送消息-我总是保持联系! 指标参数: PreSets - 如果选择
Azimuth Pro
Ottaviano De Cicco
5 (7)
Azimuth Pro V2:MT5合成分形结构分析与确认入场 概述 Azimuth Pro 是 Merkava Labs 推出的多层级波段结构指标。四层嵌套波段层级、锚定波段的VWAP、ABC形态识别、三时间框架结构过滤以及收盘确认入场——一个图表,一个从微观波段到宏观周期的完整工作流程。 这不是盲目的信号产品。它是一个以结构为先的工作流程,专为重视位置、背景和时机的交易者打造。 ️ 夏季促销 — 庆祝夏至与 The Oracle Pro 上市:Azimuth Pro 七折优惠,现价 279 美元(原价 399 美元)。限时夏季优惠。 1. V2的变化 合成多时间框架引擎 高时间框架分析从零开始重建,采用与Meridian Pro相同的专有合成架构。更清晰的HTF背景、稳定的实时行为、无经典MTF同步问题。合成引擎还解锁了 固定比率时间框架级联 (x2、x3、x4、x6)——不再在经纪商的固定时间框架之间任意跳转,您可以按图表时间框架的固定倍数分析结构,在每个尺度上保持相同的分形关系。 确认入场箭头 作为稳定且可恢复的执行层而设计的收盘确认箭头。当ABC设置形成且自适应确认逻辑
作者的更多信息
AutoFib: Advanced Fibonacci Retracement for MetaTrader 5 Automate Fibonacci Analysis for Smarter Trading Decisions AutoFib simplifies Fibonacci retracement analysis by automatically identifying key levels of support and resistance directly on your MT5 charts. Whether you're new to Fibonacci analysis or an advanced trader, AutoFib enhances your ability to identify potential reversals, continuations, and critical price levels. Key Features: Automatic Fibonacci Levels – Identify retracement and ext
NTL Pivot Lines
Northen Trading Labs
Pivot Lines (PL) User Guide Overview and Features The Pivot Lines Indicator (PL) provides traders with a powerful tool for identifying potential support and resistance levels based on well-established pivot point calculation methods. By offering insights into possible price turning points, this indicator helps traders make more informed trading decisions and refine their entry and exit strategies. With customizable settings for different timeframes and calculation methods, PL is versatile and a
ABH - Candle Component Analysis - User Guide Overview and Features The   ABH - Average Bar Height   indicator is designed to help traders analyze market volatility and identify potential buy and sell signals by measuring the average size of each candlestick component over a specific period. The indicator calculates and displays four lines representing different candlestick metrics. By analyzing these values, traders can interpret market strength, volatility, and potential trend changes. Beyond
NTL Market Times
Northen Trading Labs
NTL Market Times Indicator The NTL Market Times Indicator for MT5 provides a clear unobtrusive display of the opening and closing times of the world’s major Forex trading centers. It automatically adjusts for UK daylight saving time, ensuring reliable market session information all year round. Main Features Major Markets: Displays New York, London, Frankfurt, Sydney, and Tokyo trading hours. Color-Coded Sessions: Each market session is uniquely color-coded for quick identification on the chart.
NTL HLines
Northen Trading Labs
HLines User Guide Overview and Features The NTL HLines Indicator is designed to elevate your trading with precise support and resistance analysis. Utilizing a sophisticated algorithm, this MQL5 indicator scans for high-probability price levels across multiple timeframes, helping traders pinpoint strategic entry and exit zones. With fully customizable pivot scanning and multi-timeframe support, HLines provides a powerful, adaptable toolset for traders of all experience levels. Key features includ
筛选:
无评论
回复评论