Elder ray

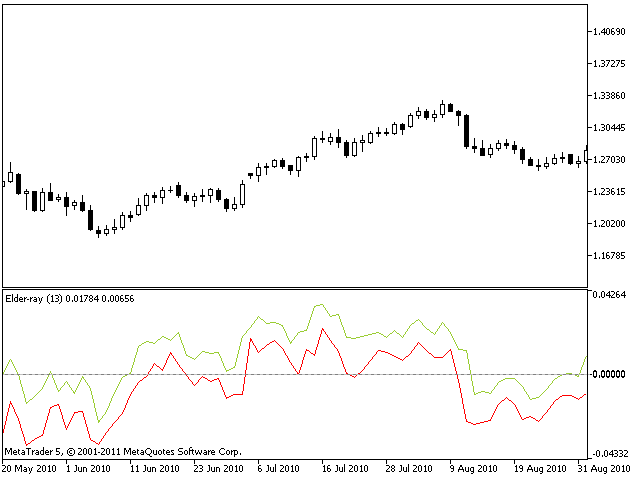
Elder-Ray is made of both Bulls Power and Bears Power as described in "Come into my Trading Room" book. It is tracking the relative power of bulls and bears by measuring how far the high and the low of each bar get away from the average price.

Elder-ray is an indicator developed by Dr. Elder and named for its similarity to x-rays. It shows the structure of bullish and bearish power below the surface of the markets. Elder-ray combines a trendfollowing moving average with two oscillators to show when to enter and exit long or short positions.

Parameters:

  • EMA_Length (13) – The number of periods to smooth Bulls Power and Bears Power lines.
Prodotti consigliati
Indicatore Heiken Ashi Smoothed per MT5 Heiken Ashi avanzato con filtro di smoothing. Riduce il rumore, elimina falsi segnali e individua trend precocemente. Ideale per Forex, indici e crypto (H1-D1). Come funziona e come viene levigato? L'Heiken Ashi tradizionale calcola le candele mediando i valori di apertura, chiusura, massimo e minimo dei periodi precedenti, riducendo già l'impatto delle fluttuazioni minori. Tuttavia, l' Heiken Ashi Smoothed eleva questo approccio applicando un filtro di le
FREE
Candle Colors
Paulo Henrique Da Silva
The Color Candles Indicator uses custom colors to highlight candles that follow the main market trend, based on the Moving Average. This simplifies the analysis of price movements, making it clearer and more direct. When the price is above the rising Moving Average, candles are highlighted indicating a BUY opportunity. When the price is below the declining Moving Average, candles are highlighted indicating a SELL opportunity. Input Parameters : Period Method Applied Price The moving averages
FREE
Gold Levels MTF MT5
Sergei Linskii
5 (8)
Gold Levels MTF - this is a fine stock technical indicator. The indicator algorithm analyzes the movement of the asset price, displays price levels of support and resistance from all time frames (TF) using the Murray method based on the Gann theory. The indicator indicates overbought and oversold fields, giving an idea of possible reversal points and at the same time giving some idea of the strength of the current trend. Description of levels: (Extreme Overshoot) - these levels are the ultimate
FREE
TTM Squeeze MT5
Tinashe Ndarimani
4.75 (4)
Overview The TTM Squeeze indicator helps identify low volatility periods (squeeze) that often precede price breakouts. It uses Bollinger Bands (BB) and Keltner Channels (KC) to determine when the market is "coiling" and ready to move. Configuration Guide Volatility Settings The indicator uses Bollinger Bands to measure market volatility. When BBs are inside Keltner Channels, a squeeze is detected. The squeeze suggests the market is consolidating and may soon break out. True Range Option Optional
FREE
Ichimoku V2
Quang Huy Quach
1. Overview The Ichimoku Kinko Hyo (or Ichimoku Cloud) is a comprehensive, all-in-one technical analysis indicator designed to provide a deep understanding of market trends, momentum, and dynamic support and resistance levels. This indicator provides a clean, standard implementation of the five core Ichimoku lines. Its key feature is a non-intrusive Status Dashboard that gives you an at-a-glance summary of the current market situation according to the Ichimoku system, allowing for quick and effi
FREE
ChannelRSI5
Iurii Tokman
5 (5)
ChannelRSI5   The Relative Strength Index (RSI) indicator with dynamic levels of overbought and oversold zones. Dynamic levels change and adjust to the current changes in the indicator and prices, and represent a kind of channel. Indicator settings period_RSI - Averaging period for calculating the RSI index. applied_RSI - The applied price. It can be any of the price constants: PRICE_CLOSE - Closing price, PRICE_OPEN - Opening price, PRICE_HIGH - Maximum price for the period, PRICE_LOW - Minimum
FREE
Ict institutional zones
Marrion Netondo Wabomba
SMC VALID EA (MT5) Version: 1.10 Author: Marrion Brave Wabomba Category: Smart Money Concepts (SMC) and  ICT concepts ICT Smart Money Daily Zones (SMC Pro)  ICT Smart Money Daily Zones (SMC Pro) – ICT Daily Buy & Sell Zones Pro is a professional-grade Smart Money Concepts (SMC) / ICT trading indicator for MetaTrader 5, designed to clearly map institutional daily levels and guide traders with high-probability decision zones . This indicator automatically analyzes the Daily timeframe (PDH / PD
There is a strong correlation between tick volume and real volume.  This is important for 2 reasons: Real volume is a very important indicator because, among many other benefits, it provides strong confirmations of the emergence/dissipation of trends. Real volume is not available in Forex, instead, one has to make do with tick volume. Unfortunately, tick volume is highly broker dependent.  Additionally, it is often not used effectively to define indicators.  Virtually all indicators that use
Indicador Volatilidade Histórica Indicador é um oscilador que faz o plot da volatilidade histórica de um ativo, representado pelas fórmulas: Volatilidade Histórica = Raiz quadrada da média das diferenças ao quadrado * Fator de anualização. Média das diferenças ao quadrado = soma de todas as diferenças de retorno diário / número total das diferenças. Retorno diário = (preço atual - preço anterior) / preço anterior. Nesse indicador estamos utilizando os preços de fechamento de cada barra e fazemos
FREE
Breakout Boxes with Volume Pressure This indicator automates the identification of key consolidation zones (Supply and Demand) based on Market Pivots and Volatility (ATR). Unlike standard support/resistance tools, this indicator provides a unique   Volume Pressure Analysis   inside every box, giving you insight into the battle between Buyers and Sellers before a breakout occurs. Key Features Automated Supply & Demand Zones:   Automatically detects significant Pivot Highs and Lows to draw dyna
FractalEfficiencyIndicator   A ratio between 0 and 1 with the higher values representing a more efficient or trending market,  It is used in the calculation of Perry J. Kaufman Adaptive Moving Average (KAMA), dividing the price change over a period by the absolute sum of the price movements that occurred to achieve that change. The Fractal Efficiency or also known as Efficiency Ratio was first published by Perry J. Kaufman in his book   ‘Smarter Trading‘. This is mostly considered a filter for v
FREE
True Volatility
Cristian Eriksson
5 (1)
ATR is an excellent indicator to visualize if volatility is increasing or decreasing. But what if you want to compare the volatility to another pair or instrument? Since each pair with different quote currency has different pip value, the output of the ATR doesn't really say that much. Comparing pairs to other instruments is even harder.  What you as a trader care about is how much the pair has moved up or down in percentage, therefore normalizing ATR to percent would make things much easier.  T
FREE
This indicator studies the price action as a combination of micro-trends. All micro-trends are analyzed and averaged. Price movement is filtered based on this averaging. IP_High and IP_Low (blue and red dashed lines) show the instantaneous price movement. They display the forecast only for the current price values, taking into account only the number of bars defined by the 'Filter level' parameter. SP_High and SP_Low (blue and red solid lines) smooth the price movements with respect to history.
AdaptiveCCiMt5
Francis Dube
4 (2)
The Commodity Channel Index computes the deviation of the typical price of each bar from the average price over a particular time period. Multiplying the median deviation by 0.015 facilitates normalization, which makes all deviations below the first standard deviation less than  -100, and all deviations above the first standard deviation more than 100. This adaptive version is based on the indicator described by John Ehlers, in the book Rocket Science for traders. The indicator uses the homodyne
FREE
The SuperTrend MTF indicator is an excellent trend tracking indicator . It can not only display SuperTrend trends within the timeframe of the chart, but also set up to display SuperTrend trends for larger time frames simultaneously . This will be beneficial for grasping trends at a larger time scale and predicting future trends . At the same time, the price of the trend line can also be displayed at a glance, making it easy to observe. Input parameters :  ATR period used at chart timeframe   
Zigzag indicator
Aleksandr Puchkin
L'indicatore funziona con due periodi di tempo, ha una visualizzazione visiva delle onde direttamente sul grafico di lavoro e visualizza i livelli delle onde orizzontali. L'indicatore ZigZag collega massimi e minimi significativi sul grafico dei prezzi con linee inclinate visibili che rendono più facile percepire il movimento dell'onda e divide le onde in intervalli per livelli. Gli estremi sono calcolati dai prezzi High \ Low o dai prezzi Close. I livelli delle onde vengono proiettati sull'onda
Offerta speciale : TUTTI GLI STRUMENTI , solo $35 ciascuno! I nuovi strumenti   saranno a   $30   per la   prima settimana   o per i   primi 3 acquisti !  Canale Trading Tools su MQL5 : unisciti al mio canale MQL5 per ricevere le ultime novità Questo indicatore visualizza   livelli di liquidità   e   zone di liquidità   basati su   concetti ICT   , oltre a Liquidity Voids per evidenziare gli spostamenti di prezzo monodirezionali. Si concentra su dove tendono ad accumularsi ordini stop o pendent
Dsc Oscillator
Diogo Sawitzki Cansi
Recomended broker: https://tinyurl.com/5ftaha7c Indicator used to monitor price fluctuations in the market and discover possible reversals through reversal points or divergences in the indicator. All assets and all timeframes.   SEE OUR RESULTS ON INSTAGRAM:  https://www.instagram.com/diogo.cansi/   TELEGRAM GROUP =  https://t.me/robosdsc More information by email dscinvestimentos@gmail.com or by Whatsapp 55-991372299
FREE
The Turning point of price indicator displays assumed turning points of the price on the chart. It is based on data of the Prise Reversal oscillator and standard ADX. When the value of Prise Reversal is in overbought or oversold area (area size is set by a user), and the value of the ADX main line exceeds the preset value, the Turning point of price indicator draws an arrow pointed to the further assumed price movement. This idea is described in the article Indicator of Price Reversal . Inputs
25% off. Original price: $40  (Ends on February 15) RSI Scanner is a multi symbol multi timeframe RSI dashboard that monitors Relative Strength Index indicator for price entering and exiting overbought and oversold in up to 28 symbols and 9 timeframes. Download Demo here  (Scans only M1, M5 and M10) Settings description   here MT4 version   here RSI Scanner features: Signals RSI entering and exiting the overbought and oversold zones. Monitors 28 customizable instruments and 9 timeframes at th
This is a regression tree indicator for MT4/MT5. This indicator classificate nodes on the time period so that the deviation becomes smaller, and displays regression line and channel for each node. It's free! Attached CartDemo.ex4 and CartDemo.ex5 is a Demo version and has the following limitations: Can't use HighSpeed method (default method is RandomForest) Maximum number of bars is 260 (increase from 200) There is no expiration date and can be started many times, but it stops after an hour.
FREE
Sessions PRO MT5
Andrzej Grzegorz Kwiatkowski
5 (1)
Sessions PRO  is a perfect tool which divide your chart screen by 3 main market sessions: 1> asian 2> european (with division for Frankfurt and London start) 3> american Sessions PRO  is perfect especially for trading indices, where main pivot points often occurs along with new market center enters the market. With  Sessions PRO  you see what events happened at their exact corresponding time - European and American moves and pivot points are much more important than asian. Stop analyzing your c
Volume Time
Mauricio Bornancin Cit
Apresentação:  - O Indicador "Volume Time" da CIT Group é um indicador especializado na bolsa brasileira (B3). Objetivo:  - Especificamente desenvolvido para o perfil de pessoas que operam IntraDay. Funcionamento:  - Calculado com base nos trades realizados durante o pregão, sendo atualizado a cada 1 segundo, tendo maior precisão dos volumes Funcionalidades:  - Entrega de um conjunto de parâmetros como tipo de indicador (Financeiro, Volume ou Quantidade), estes podendo ser calculado (Unitário, U
Best Scalper 5min TF
Bruno Alexandre Azevedo Dantas
Se procuras um robô rápido, agressivo e de alta frequência , o Best Scalper 5min TF é uma das melhores opções. Projetado para timeframes ultra curtos (M5 – 5 minutos) , ele entra e sai de operações rapidamente, capitalizando nos pequenos movimentos do mercado. Este robô combina filtros de volatilidade, padrões de candles e suporte/resistência dinâmica para identificar as melhores oportunidades. Ele é otimizado para pares de moedas e índices altamente voláteis , como US100 e GOLD , onde os peque
FREE
Lomb Periodogram
Alfred Mirzasalikhov
The Lomb algorithm is designed to find the dominant cycle length in noisy data. It is used commonly in the field of astronomy and is very good at extracting cycle out of really noisy data sets. The Lomb phase plot is very similar to the Stochastics indicator. It has two threshold levels. When it crosses above the lower level it’s a buy signal. When it crosses the upper level it’s a sell signal. This is cycle-based indicator, the nicer waves look, the better the signal. Caution Also It’s really i
Bollinger Bands Technical Indicator (BB) is similar to envelopes. The only difference is that the bands of Envelopes are plotted a fixed distance (%) away from the moving average, while the Bollinger Bands are plotted a certain number of standard deviations away from it. Standard deviation is a measure of volatility, therefore Bollinger Bands adjust themselves to the market conditions. When the markets become more volatile, the bands widen and they contract during less volatile periods. This ada
FREE
Raymond Cloudy Day
The Hung Ngo
5 (3)
Raymond Cloudy Day Indicator for MT5 – Pivot-Based Reversal and Trend Levels Raymond Cloudy Day Indicator is a pivot-based level indicator for MetaTrader 5 (MT5). It was developed by Ngo The Hung based on Raymond’s original idea and is designed to give a structured view of potential reversal zones, trend extensions and support/resistance levels directly on the chart. The default settings are optimised for XAUUSD on the H1 timeframe, but the indicator can be tested and adjusted for other symbols
FREE
Wolf Countdown
Tiziano Zambelli Sopalu
Wolf Countdown helps you not to waste the right amount of time, it gives you back the time remaining until the candle closes. How to use: Download and install the  Wolf Countdown Indicator on your MetaTrader 5. Apply the indicator to your favorite chart. this works on any timeframe... Thanks to this indicator you will never miss the right moment to enter your trades.
FREE
MFI Diver
Andrii Kovalevskyi
5 (1)
MFI Divergence is a technical indicator that detects regular bullish and bearish divergences between price and the Money Flow Index (MFI) at swing highs and lows. It highlights potential reversal points by drawing clean green (bullish) and red (bearish) arrows directly on the chart. The indicator uses configurable swing detection, customizable MFI period, and an optional MFI threshold filter to show signals only in oversold/overbought zones. Alerts are triggered only once per bar on candle close
FREE
Will Spread
Paulo Henrique Faquineli Garcia
The Larry Wiliams' indicator named WillSpread considers the influence of the secondary Asset (Symbol) on the current Asset (trading). Indicator essence is to transform the correlation between assets in accumulated history data, providing an opportunity to detect various peculiarities and patterns in price dynamics which are invisible to the naked eye. Based on this information, traders can assume further price movement and adjust their strategy accordingly. As exposed on his Book, Larry says: "a
Gli utenti di questo prodotto hanno anche acquistato
Se acquisti questo indicatore, riceverai il mio Trade Manager Professionale + EA  GRATUITAMENTE. Innanzitutto è importante sottolineare che questo sistema di trading è un indicatore Non-Repainting, Non-Redrawing e Non-Lagging, il che lo rende ideale sia per il trading manuale che per quello automatico. Corso online, manuale e download di preset. Il "Sistema di Trading Smart Trend MT5" è una soluzione completa pensata sia per i trader principianti che per quelli esperti. Combina oltre 10 indicat
ARIPoint
Temirlan Kdyrkhan
ARIPoint is a powerful trading companion designed to generate high-probability entry signals with dynamic TP/SL/DP levels based on volatility. Built-in performance tracking shows win/loss stats, PP1/PP2 hits, and success rates all updated live. Key Features: Buy/Sell signals with adaptive volatility bands Real-time TP/SL/DP levels based on ATR Built-in MA Filter with optional ATR/StdDev volatility Performance stats panel (Success, Profit/Loss, PP1/PP2) Alerts via popup, sound, push, or email Cu
SuperScalp Pro
Van Minh Nguyen
5 (2)
SuperScalp Pro – Sistema avanzato di indicatore per scalping con filtri multipli SuperScalp Pro è un sistema avanzato di indicatore per scalping che combina il classico Supertrend con molteplici filtri di conferma intelligenti. L’indicatore funziona in modo efficiente su tutti i timeframe da M1 a H4 ed è particolarmente adatto per XAUUSD, BTCUSD e le principali coppie Forex. Può essere utilizzato come sistema stand-alone o integrato in modo flessibile nelle strategie di trading esistenti. L’indi
Entry In The Zone and SMC Multi Timeframe is a real-time market analysis tool developed based on Smart Money Concepts (SMC). It is designed to analyze market structure, price direction, reversal points, and key zones across multiple timeframes in a systematic way. The system displays Points of Interest (POI) and real-time No Repaint signals, with instant alerts when price reaches key zones or when signals occur within those zones. It functions as both an Indicator and a Signal System (2-in-1), c
Divergence Bomber
Ihor Otkydach
4.89 (82)
Ogni acquirente dell’indicatore riceverà inoltre gratuitamente: L’utilità esclusiva “Bomber Utility”, che gestisce automaticamente ogni operazione, imposta i livelli di Stop Loss e Take Profit e chiude le posizioni secondo le regole della strategia I file di configurazione (set file) per adattare l’indicatore a diversi asset I set file per configurare il Bomber Utility in tre modalità: “Rischio Minimo”, “Rischio Bilanciato” e “Strategia di Attesa” Una guida video passo-passo per installare, conf
Azimuth Pro
Ottaviano De Cicco
5 (3)
LAUNCH PROMO Azimuth Pro price is initially set at 299$ for the first 100 buyers. Final price will be 499$ . THE DIFFERENCE BETWEEN RETAIL AND INSTITUTIONAL ENTRIES ISN'T THE INDICATOR — IT'S THE LOCATION. Most traders enter at arbitrary price levels, chasing momentum or reacting to lagging signals. Institutions wait for price to reach structured levels where supply and demand actually shift. Azimuth Pro maps these levels automatically: swing-anchored VWAP, multi-timeframe structure lines, an
Game Changer è un indicatore di tendenza rivoluzionario, progettato per essere utilizzato su qualsiasi strumento finanziario, per trasformare il tuo Metatrader in un potente analizzatore di trend. L'indicatore non ridisegna e non subisce ritardi. Funziona su qualsiasi intervallo temporale e aiuta a identificare i trend, segnala potenziali inversioni, funge da meccanismo di trailing stop e fornisce avvisi in tempo reale per risposte tempestive del mercato. Che tu sia un trader esperto, un profess
Power Candles MT5
Daniel Stein
5 (6)
Power Candles – Segnali di ingresso basati sulla forza per tutti i mercati Power Candles porta l’analisi di forza collaudata di Stein Investments direttamente sul grafico dei prezzi. Invece di reagire solo al prezzo, ogni candela viene colorata in base alla reale forza di mercato, consentendo di identificare immediatamente accumuli di momentum, accelerazioni della forza e transizioni di trend pulite. Un’unica logica per tutti i mercati Power Candles funziona automaticamente su tutti i simboli di
FX Power MT5 NG
Daniel Stein
5 (31)
FX Power: Analizza la Forza delle Valute per Decisioni di Trading Più Intelligenti Panoramica FX Power è lo strumento essenziale per comprendere la reale forza delle principali valute e dell'oro in qualsiasi condizione di mercato. Identificando le valute forti da comprare e quelle deboli da vendere, FX Power semplifica le decisioni di trading e rivela opportunità ad alta probabilità. Che tu segua le tendenze o anticipi inversioni utilizzando valori estremi di Delta, questo strumento si adatta
TrendMaestro5
Stefano Frisetti
Attenzione alle truffe, questo indicatore e' distribuito esclusivamente su MQL5.com nota: questo indicatore e' per METATRADER5, se vuoi la versione per  METATRADER4 questo e' il link:   https://www.mql5.com/it/market/product/108106 TRENDMAESTRO ver 2.5 TRENDMAESTRO   riconosce un nuovo TREND sul nascere, non sbaglia mai. La sicurezza di identificare un nuovo TREND non ha prezzo. DESCRIZIONE TRENDMAESTRO identifica un nuovo TREND sul nascere, questo indicatore prende in esame la volatilita' i
Atomic Analyst MT5
Issam Kassas
4.07 (28)
Innanzitutto, vale la pena sottolineare che questo indicatore di trading non è repaint, non è ridisegno e non presenta ritardi, il che lo rende ideale sia per il trading manuale che per quello automatico. Manuale utente: impostazioni, input e strategia. L'Analista Atomico è un indicatore di azione del prezzo PA che utilizza la forza e il momentum del prezzo per trovare un miglior vantaggio sul mercato. Dotato di filtri avanzati che aiutano a rimuovere rumori e segnali falsi, e aumentare il pote
Grabber System MT5
Ihor Otkydach
4.82 (22)
Ti presento un eccellente indicatore tecnico: Grabber, che funziona come una strategia di trading "tutto incluso", pronta all’uso. In un solo codice sono integrati strumenti potenti per l’analisi tecnica del mercato, segnali di trading (frecce), funzioni di allerta e notifiche push. Ogni acquirente di questo indicatore riceve anche gratuitamente: L’utility Grabber: per la gestione automatica degli ordini aperti Video tutorial passo dopo passo: per imparare a installare, configurare e utilizzare
Top indicator for MT5   providing accurate signals to enter a trade without repainting! It can be applied to any financial assets:   forex, cryptocurrencies, metals, stocks, indices .  Watch  the video  (6:22) with an example of processing only one signal that paid off the indicator! MT4 version is here It will provide pretty accurate trading signals and tell you when it's best to open a trade and close it. Most traders improve their trading results during the first trading week with the help of
Trend Screener Pro MT5
STE S.S.COMPANY
4.84 (100)
Indicatore di tendenza, soluzione unica rivoluzionaria per il trading di tendenze e il filtraggio con tutte le importanti funzionalità di tendenza integrate in un unico strumento! È un indicatore multi-timeframe e multi-valuta al 100% non ridipingibile che può essere utilizzato su tutti i simboli/strumenti: forex, materie prime, criptovalute, indici e azioni. Trend Screener è un indicatore di tendenza che segue un indicatore efficiente che fornisce segnali di tendenza a freccia con punti nel gra
L’indicatore evidenzia le zone in cui viene dichiarato interesse sul mercato , per poi mostrare la zona di accumulo degli ordini . Funziona come un book degli ordini su larga scala . Questo è l’indicatore per i grandi capitali . Le sue prestazioni sono eccezionali. Qualsiasi interesse ci sia nel mercato, lo vedrai chiaramente . (Questa è una versione completamente riscritta e automatizzata – non è più necessaria un’analisi manuale.) La velocità di transazione è un indicatore concettualmente nuo
L'indicatore " Dynamic Scalper System MT5 " è progettato per il metodo di scalping, ovvero per il trading all'interno di onde di trend. Testato sulle principali coppie di valute e sull'oro, è compatibile con altri strumenti di trading. Fornisce segnali per l'apertura di posizioni a breve termine lungo il trend, con ulteriore supporto al movimento dei prezzi. Il principio dell'indicatore. Le frecce grandi determinano la direzione del trend. Un algoritmo per generare segnali per lo scalping sott
Smart Stop Indicator – Precisione intelligente dello stop-loss direttamente sul grafico Panoramica Smart Stop Indicator è la soluzione ideale per i trader che desiderano posizionare il loro stop-loss in modo chiaro e metodico, senza dover indovinare o affidarsi all’intuizione. Questo strumento combina la logica classica del price action (massimi e minimi strutturali) con un moderno riconoscimento dei breakout per identificare il prossimo livello di stop realmente logico. In trend, in range o i
RelicusRoad Pro: Sistema Operativo Quantitativo di Mercato 70% DI SCONTO ACCESSO A VITA (TEMPO LIMITATO) - UNISCITI A 2.000+ TRADER Perché la maggior parte dei trader fallisce anche con indicatori "perfetti"? Perché operano su Singoli Concetti isolati. Un segnale senza contesto è una scommessa. Per vincere serve CONFLUENZA . RelicusRoad Pro non è un semplice indicatore. È un Ecosistema Quantitativo completo . Mappa la "Fair Value Road", distinguendo tra rumore e rotture strutturali. Smetti di in
Super Signal – Skyblade Edition Sistema professionale di segnali di tendenza senza repaint / senza ritardo con tasso di vincita eccezionale | Per MT4 / MT5 Funziona meglio su timeframe più bassi, come 1 minuto, 5 minuti e 15 minuti. Caratteristiche principali: Super Signal – Skyblade Edition è un sistema intelligente di segnali progettato specificamente per il trading di tendenza. Utilizza una logica di filtraggio multilivello per identificare esclusivamente i movimenti direzionali forti, supp
Support And Resistance Screener è in un indicatore di livello per MetaTrader che fornisce più strumenti all'interno di un indicatore. Gli strumenti disponibili sono: 1. Screener della struttura del mercato. 2. Zona di ritiro rialzista. 3. Zona di ritiro ribassista. 4. Punti pivot giornalieri 5. Punti pivot settimanali 6. Punti pivot mensili 7. Forte supporto e resistenza basati sul modello e sul volume armonici. 8. Zone a livello di banca. OFFERTA A TEMPO LIMITATO: il supporto HV e l'indicatore
TPSproTREND PrO MT5
Roman Podpora
4.74 (19)
TPSproTrend PRO identifica il momento in cui il mercato cambia effettivamente direzione e forma un punto di ingresso all'inizio del movimento. Si entra nel mercato quando il prezzo sta appena iniziando a muoversi, e non dopo che il movimento si è già verificato.   Indicatore       Non ridisegna i segnali e visualizza automaticamente i punti di ingresso, lo Stop Loss e il Take Profit, rendendo il trading chiaro, visivo e strutturato. ISTRUZIONI RUS   -   VERSIONE MT4 Vantaggi principali Segnali
IX Power MT5
Daniel Stein
4.92 (12)
IX Power: Scopri approfondimenti di mercato per indici, materie prime, criptovalute e forex Panoramica IX Power è uno strumento versatile progettato per analizzare la forza di indici, materie prime, criptovalute e simboli forex. Mentre FX Power offre la massima precisione per le coppie di valute utilizzando i dati di tutte le coppie disponibili, IX Power si concentra esclusivamente sui dati di mercato del simbolo sottostante. Questo rende IX Power una scelta eccellente per mercati non correlat
FX Levels MT5
Daniel Stein
5 (12)
FX Levels: Supporti e Resistenze di Precisione Eccezionale per Tutti i Mercati Panoramica Rapida Cercate un modo affidabile per individuare livelli di supporto e resistenza in ogni mercato—coppie di valute, indici, azioni o materie prime? FX Levels fonde il metodo tradizionale “Lighthouse” con un approccio dinamico all’avanguardia, offrendo una precisione quasi universale. Basato sulla nostra esperienza reale con i broker e su aggiornamenti automatici giornalieri più quelli in tempo reale, FX
The AX Forex Indicator MT5 is a sophisticated trading tool designed to provide traders with a comprehensive analysis of multiple currency pairs. This   powerful indicator   simplifies the complex nature of the forex market, making it accessible for both novice and experienced traders. AX Forex Indicator uses   advanced algorithms   to detect trends, patterns and is an essential tool for traders aiming to enhance their forex trading performance. With its robust features, ease of use, and reliabl
Dark Support Resistance  is an Indicator for intraday trading. This Indicator is programmed to identify  Support and Resistance Lines , providing a high level of accuracy and reliability. Key benefits Easily visible lines Only the most important levels will be displayed Automated adjustment for each timeframe and instrument Easy to use even for beginners Never repaints, never backpaints, Not Lag 100% compatible with Expert Advisor development All types of alerts available: Pop-up, Email, Push
Weis Wave with Alert MT5
Trade The Volume Waves Single Member P.C.
4.94 (17)
Rental/Lifetime Package Options and Privileges  Rent Monthly Six Months   Yearly/Lifetime Weis Wave with Speed with Alert+Speed Index x x x Manual  x x x Quick Set up Video x x x Blog x x x Lifetime Updates x x x Setup and Training Material x x Discord Access Channel "The SI traders"          x Rectangle Break Alert Tool      x How to trade with it:    http://www.tradethevolumewaves.com   ** If you purchase please contact me to setup your  : Training Room and  complete manual access.  Wei
Innanzitutto, vale la pena sottolineare che questo Strumento di Trading è un Indicatore Non-Ridipingente, Non-Ridisegnante e Non-Laggante, il che lo rende ideale per il trading professionale. Corso online, manuale utente e demo. L'Indicatore Smart Price Action Concepts è uno strumento molto potente sia per i nuovi che per i trader esperti. Racchiude più di 20 utili indicatori in uno solo, combinando idee di trading avanzate come l'Analisi del Trader del Circolo Interno e le Strategie di Tradin
Ogni giorno, migliaia di trader cadono nella stessa trappola. Il prezzo rompe un livello chiave. Tu entri nel trade. Poi BOOM — il mercato inverte e ti stoppa. Quello non era un breakout reale. Era un’illusione, progettata per intrappolare i soldi retail prima che parta il vero movimento. I trader professionisti lo chiamano “liquidity sweep”. Lo smart money lo chiama “stop hunt”. PRESENTIAMO: MIRAGE TRADING SYSTEM — trasforma i falsi breakout nel tuo vantaggio. LANCIO LIMITATO: Acquista ora e o
M1 Scalper Pro MT5
Elif Kaya
4.64 (11)
- Real price is 80$ - 45% Discount (It is 45$ now) Contact me for extra bonus   indicator, instruction or any questions! - Lifetime update free - Non-repaint - Related product: Gann Gold EA - I just sell my products in Elif Kaya Profile, any other websites are stolen old versions, So no any new updates or support. Advantages of  M1 Scalper Pro  Profitability: M1 Scalper Pro is highly profitable with a strict exit strategy. Frequent Opportunities: M1 Scalper Pro  takes advantage of numerous smal
Trend indicator AI mt5
Ramil Minniakhmetov
5 (14)
Trend Ai indicator è un ottimo strumento che migliorerà l'analisi di mercato di un trader combinando l'identificazione della tendenza con punti di ingresso utilizzabili e avvisi di inversione. Questo indicatore consente agli utenti di navigare nelle complessità del mercato forex con fiducia e precisione Oltre ai segnali primari, l'indicatore Ai di tendenza identifica i punti di ingresso secondari che si presentano durante i pullback o i ritracciamenti, consentendo ai trader di capitalizzare le
Altri dall’autore
Elder Impulse System
Financial Trading Seminars Inc.
Il sistema di impulso è stato descritto per la prima volta nel libro "Vieni nella mia Trading Room". Utilizza la direzione sia dell'istogramma MACD che di una media mobile esponenziale (EMA) del prezzo per definire un impulso. La regola è non commerciare mai contro l'impulso. Il suo codice colore ti dà diversi segnali: Quando sia l'EMA che l'istogramma MACD sono in aumento, il sistema Impulse colora il colore della barra è verde (nessun cortocircuito consentito). Quando sia l'EMA che l'istogra
Elder Impulse Release
Financial Trading Seminars Inc.
The purpose of Impulse Release is to prevent trading in the wrong direction. While the Impulse System operates in a single timeframe, Impulse Release is based on two timeframes. It tracks both the longer and the shorter timeframes to find when the Impulse points in the same direction on both. Its color bar flashes several signals: If one timeframe is in a buy mode and the other in a sell mode, the signal is "No Trade Allowed", a  black bar. If both are neutral, then any trades are allowed, showi
Elder MACD Combo
Financial Trading Seminars Inc.
MACD Histogram tracks the difference between the MACD line and the Signal line (which is the exponential moving average of the first line). For better visibility, when plotting the lines and the histogram in the same window, we scale up the histogram by a factor of 2. Furthermore, we use two separate plots for the histogram, which allows us to color-code the bars for upticks and downticks. The MACD Combo overlays MACD lines on MACD Histogram. Putting both plots in the same window enables you to
Elder Chandelier Long Exit
Financial Trading Seminars Inc.
The Chandelier Exit, introduced by Charles LeBeau, is described in "Come into My Trading Room" book. It calculates each stop on a long position in an uptrend from the highest point reached during that rally, and gets its name from the chandelier, which hangs from the highest point in the room. The Chandelier Exit uses a multiple of the Average True Range (ATR), subtracting it from the highest high since the trade was entered. It creates a new trade whenever the previous trade is stopped out. Cha
Elder Chandelier Long Entries
Financial Trading Seminars Inc.
One of the key rules in trading is never move your stops in such a way that your risk increases. Our stop sequence shows the automatic tightening of stops. They appear as a series of decreasing risk points until the trade is eventually stopped out. The problem is that if you enter a trade at any other point than the initial dot of the sequence, you may be placing the stop too close. Stop-entry plots show you the initial value for the stop for each bar. You can use them when you put on a trade, a
Elder Chandelier Short Exit
Financial Trading Seminars Inc.
The Chandelier Exit, introduced by Charles LeBeau, is described in "Come into My Trading Room" book. It calculates each stop on a short position in a downtrend from the lowest point reached during that decline. The Chandelier Exit uses a multiple of the Average True Range (ATR), adding it to the lowest low since the trade was entered. It creates a new trade whenever the previous trade is stopped out. Chandelier Stops differ from traditional stops by having the ability to move against you if the
Elder Chandelier Short Entries
Financial Trading Seminars Inc.
One of the key rules in trading is never move your stops in such a way that your risk increases. Our stop sequence shows the automatic tightening of stops. They appear as a series of decreasing risk points until the trade is eventually stopped out. The problem is that if you enter a trade at any other point than the initial dot of the sequence, you may be placing the stop too close. Stop-entry plots show you the initial value for the stop for each bar. You can use them when you put on a trade, a
Elder MACD XOver
Financial Trading Seminars Inc.
The MACD XOver indicator was developed by John Bruns to predict the price point at which MACD Histogram will reverse the direction of its slope. The indicator is plotted one day ahead into the future, allowing, if your strategy depends on MACD Histogram, to predict its reversal point for tomorrow (or the next bar in any timeframe). If the closing price tomorrow is above the value of this indicator, then MACD Histogram will tick up. If the closing price tomorrow is below the value of this indicat
Elder Market Thermometer
Financial Trading Seminars Inc.
The Market Thermometer is described in "Come into my Trading Room" book.  It measures the degree of volatility, as reflected in greater or smaller intraday ranges. When the Market Temperature spikes above its average or stays below its average for a number of days, it gives trading signals, as described in the book. Parameters: Thermometer_EMA_Length (22) – The length of the moving average of the Market Temperature. The default 22, the average number of trading days in a month. Spike_Alert_Facto
Elder SafeZone Long
Financial Trading Seminars Inc.
SafeZone is a method for setting stops on the basis of recent volatility, outside the level of market noise. It is described in "Come into my Trading Room" book. In an uptrend, SafeZone defines noise as that portion of the current bar that extends below the low of the previous bar, going against the prevailing trend. It averages the noise level over a period of time and multiplies it by a trader-selected factor. For long trades, SafeZone subtracts the average noise level, multiplied by a factor
Elder SafeZone Long Entries
Financial Trading Seminars Inc.
One of the key rules in trading is never move your stops in such a way that your risk increases. Our stop sequence shows the automatic tightening of stops. They appear as a series of decreasing risk points until the trade is eventually stopped out. The problem is that if you enter a trade at any other point than the initial dot of the sequence, you may be placing the stop too close. Stop-entry plots show you the initial value for the stop for each bar. You can use them when you put on a trade,
Elder SafeZone Short
Financial Trading Seminars Inc.
SafeZone is a method for setting stops on the basis of recent volatility, outside the level of market noise. It is described in "Come into my Trading Room" book. In a downtrend, SafeZone defines noise as the portion of the current bar that extends above the high of the previous bar, against the downtrend. It averages the noise level over a period of time and multiplies it by a trader-selected factor. For short trades, it adds the average noise level, multiplied by a factor, to the latest high t
Elder SafeZone Short Entries
Financial Trading Seminars Inc.
One of the key rules in trading is never move your stops in such a way that your risk increases. Our stop sequence shows the automatic tightening of stops. They appear as a series of decreasing risk points until the trade is eventually stopped out. The problem is that if you enter a trade at any other point than the initial dot of the sequence, you may be placing the stop too close. Stop-entry plots show you the initial value for the stop for each bar. You can use them when you put on a trade,
Elder Smoothed ROC
Financial Trading Seminars Inc.
The Smoothed ROC indicator, developed by Fred Schutzman, is described in "Trading for a Living" book. It is created by calculating the rate of change for an exponential moving average of closing prices. When it changes direction, it helps identify and confirm trend changes. Parameters Smoothing_EMA_Length (13) – The length of the EMA used for smoothing; ROC_Period (21) – The length of the rate of change calculation.
Elder Force Index With ATR Channels
Financial Trading Seminars Inc.
3 (1)
L'aggiunta dei canali Average True Range (ATR) al Force Index è stata suggerita da Kerry Lovvorn. L'aggiunta di questi canali trasforma Force Index in uno strumento eccellente per identificare i massimi e i minimi intermedi. L'indice di forza con i canali ATR non cattura tutte le curve, ma quelle che identifica meritano un'attenzione molto seria. Nota: la parola “vero” in Average True Range si riferisce alla gestione dei divari di prezzo. Poiché non ci sono lacune nell'indice di forza, qui l'A
Filtro:
Nessuna recensione
Rispondi alla recensione