Elder ray

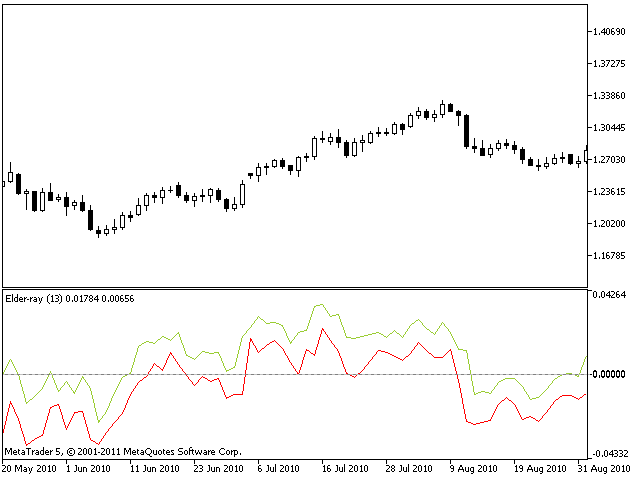
L'Elder-Ray est composé à la fois des indicateurs Bulls Power et Bears Power, comme décrit dans le livre "Venez dans ma Salle de Trading". Il suit la puissance relative des acheteurs (bears) et des vendeurs (bears) en mesurant à quelle distance le haut et le bas de chaque barre s'éloignent du prix moyen.


L'Elder-ray est un indicateur développé par le Dr Elder et nommé pour sa similitude avec les rayons X. Il montre la structure de la puissance haussière et baissière sous la surface des marchés. L'Elder-ray combine une moyenne mobile de suivi de tendance avec deux oscillateurs pour montrer quand entrer et sortir des positions longues ou courtes.


Paramètres:

  • EMA_Length (13) - Le nombre de périodes pour lisser les lignes Bulls Power et Bears Power.

Produits recommandés
Indicateur Heiken Ashi Smoothed pour MT5 Heiken Ashi avancé avec filtre de lissage. Réduit le bruit, élimine les faux signaux et détecte les tendances tôt. Idéal pour Forex, indices et crypto (H1-D1). Fonctionnement et lissage Le Heiken Ashi traditionnel calcule les bougies en moyennant les valeurs d'ouverture, de clôture, de haut et de bas des périodes précédentes, réduisant déjà l'impact des fluctuations mineures. Cependant, le Heiken Ashi Smoothed élève cette approche en appliquant un filtre
FREE
Gold Levels MTF MT5
Sergei Linskii
5 (8)
Gold Levels MTF - this is a fine stock technical indicator. The indicator algorithm analyzes the movement of the asset price, displays price levels of support and resistance from all time frames (TF) using the Murray method based on the Gann theory. The indicator indicates overbought and oversold fields, giving an idea of possible reversal points and at the same time giving some idea of the strength of the current trend. Description of levels: (Extreme Overshoot) - these levels are the ultimate
FREE
TTM Squeeze MT5
Tinashe Ndarimani
4.75 (4)
Overview The TTM Squeeze indicator helps identify low volatility periods (squeeze) that often precede price breakouts. It uses Bollinger Bands (BB) and Keltner Channels (KC) to determine when the market is "coiling" and ready to move. Configuration Guide Volatility Settings The indicator uses Bollinger Bands to measure market volatility. When BBs are inside Keltner Channels, a squeeze is detected. The squeeze suggests the market is consolidating and may soon break out. True Range Option Optional
FREE
Ichimoku V2
Quang Huy Quach
1. Overview The Ichimoku Kinko Hyo (or Ichimoku Cloud) is a comprehensive, all-in-one technical analysis indicator designed to provide a deep understanding of market trends, momentum, and dynamic support and resistance levels. This indicator provides a clean, standard implementation of the five core Ichimoku lines. Its key feature is a non-intrusive Status Dashboard that gives you an at-a-glance summary of the current market situation according to the Ichimoku system, allowing for quick and effi
FREE
ChannelRSI5
Iurii Tokman
5 (5)
ChannelRSI5   The Relative Strength Index (RSI) indicator with dynamic levels of overbought and oversold zones. Dynamic levels change and adjust to the current changes in the indicator and prices, and represent a kind of channel. Indicator settings period_RSI - Averaging period for calculating the RSI index. applied_RSI - The applied price. It can be any of the price constants: PRICE_CLOSE - Closing price, PRICE_OPEN - Opening price, PRICE_HIGH - Maximum price for the period, PRICE_LOW - Minimum
FREE
Indicateur Crypto_Forex : Oscillateur HTF MACD pour MT5. - HTF signifie « période supérieure ». - L'indicateur MACD est l'un des indicateurs les plus populaires pour le trading de tendance. - Cet indicateur est idéal pour les systèmes de trading multi-périodes avec des entrées d'action de prix ou en combinaison avec d'autres indicateurs. - L'indicateur HTF MACD vous permet d'ajouter la MACD d'une période supérieure à votre graphique actuel, une approche de trading professionnelle. - L'indicate
Ict institutional zones
Marrion Netondo Wabomba
SMC VALID EA (MT5) Version: 1.10 Author: Marrion Brave Wabomba Category: Smart Money Concepts (SMC) and  ICT concepts ICT Smart Money Daily Zones (SMC Pro)  ICT Smart Money Daily Zones (SMC Pro) – ICT Daily Buy & Sell Zones Pro is a professional-grade Smart Money Concepts (SMC) / ICT trading indicator for MetaTrader 5, designed to clearly map institutional daily levels and guide traders with high-probability decision zones . This indicator automatically analyzes the Daily timeframe (PDH / PD
There is a strong correlation between tick volume and real volume.  This is important for 2 reasons: Real volume is a very important indicator because, among many other benefits, it provides strong confirmations of the emergence/dissipation of trends. Real volume is not available in Forex, instead, one has to make do with tick volume. Unfortunately, tick volume is highly broker dependent.  Additionally, it is often not used effectively to define indicators.  Virtually all indicators that use
Indicador Volatilidade Histórica Indicador é um oscilador que faz o plot da volatilidade histórica de um ativo, representado pelas fórmulas: Volatilidade Histórica = Raiz quadrada da média das diferenças ao quadrado * Fator de anualização. Média das diferenças ao quadrado = soma de todas as diferenças de retorno diário / número total das diferenças. Retorno diário = (preço atual - preço anterior) / preço anterior. Nesse indicador estamos utilizando os preços de fechamento de cada barra e fazemos
FREE
Breakout Boxes with Volume Pressure This indicator automates the identification of key consolidation zones (Supply and Demand) based on Market Pivots and Volatility (ATR). Unlike standard support/resistance tools, this indicator provides a unique   Volume Pressure Analysis   inside every box, giving you insight into the battle between Buyers and Sellers before a breakout occurs. Key Features Automated Supply & Demand Zones:   Automatically detects significant Pivot Highs and Lows to draw dyna
FractalEfficiencyIndicator   A ratio between 0 and 1 with the higher values representing a more efficient or trending market,  It is used in the calculation of Perry J. Kaufman Adaptive Moving Average (KAMA), dividing the price change over a period by the absolute sum of the price movements that occurred to achieve that change. The Fractal Efficiency or also known as Efficiency Ratio was first published by Perry J. Kaufman in his book   ‘Smarter Trading‘. This is mostly considered a filter for v
FREE
True Volatility
Cristian Eriksson
5 (1)
ATR is an excellent indicator to visualize if volatility is increasing or decreasing. But what if you want to compare the volatility to another pair or instrument? Since each pair with different quote currency has different pip value, the output of the ATR doesn't really say that much. Comparing pairs to other instruments is even harder.  What you as a trader care about is how much the pair has moved up or down in percentage, therefore normalizing ATR to percent would make things much easier.  T
FREE
This indicator studies the price action as a combination of micro-trends. All micro-trends are analyzed and averaged. Price movement is filtered based on this averaging. IP_High and IP_Low (blue and red dashed lines) show the instantaneous price movement. They display the forecast only for the current price values, taking into account only the number of bars defined by the 'Filter level' parameter. SP_High and SP_Low (blue and red solid lines) smooth the price movements with respect to history.
AdaptiveCCiMt5
Francis Dube
4 (2)
The Commodity Channel Index computes the deviation of the typical price of each bar from the average price over a particular time period. Multiplying the median deviation by 0.015 facilitates normalization, which makes all deviations below the first standard deviation less than  -100, and all deviations above the first standard deviation more than 100. This adaptive version is based on the indicator described by John Ehlers, in the book Rocket Science for traders. The indicator uses the homodyne
FREE
The SuperTrend MTF indicator is an excellent trend tracking indicator . It can not only display SuperTrend trends within the timeframe of the chart, but also set up to display SuperTrend trends for larger time frames simultaneously . This will be beneficial for grasping trends at a larger time scale and predicting future trends . At the same time, the price of the trend line can also be displayed at a glance, making it easy to observe. Input parameters :  ATR period used at chart timeframe   
MT5 All Icons
Danny Giovanni Romero Lozano
MT5 All Icons is a high-utility developer tool designed to simplify the visual customization of indicators and Expert Advisors. It provides a comprehensive, interactive reference table of all 255 Wingdings symbols directly within a separate chart subwindow. Instead of guessing character codes or looking up external charts, this tool allows you to see every available icon, its visual representation, and its corresponding ID number in real-time. Key Features: Full Library Access: Displays the com
FREE
L'indicateur fonctionne avec deux périodes de temps, a un affichage visuel des vagues directement sur le graphique de travail et affiche les niveaux de vagues horizontaux. L'indicateur ZigZag relie les hauts et les bas significatifs sur le graphique des prix avec des lignes inclinées visibles qui facilitent la perception du mouvement des vagues et divisent les vagues en plages par niveaux. Les extrêmes sont calculés par les prix High \ Low ou par les prix Close. Les niveaux de vague sont projeté
Offre spéciale : TOUS LES OUTILS , seulement $35 chacun ! Les nouveaux outils   seront à   $30   pendant la   première semaine   ou pour les   3 premiers achats !  Chaîne Trading Tools sur MQL5 : rejoignez ma chaîne MQL5 pour recevoir mes dernières actualités Cet indicateur visualise   les niveaux de liquidité   et   les zones de liquidité   basés sur les   concepts ICT   , ainsi que des Liquidity Voids pour mettre en évidence les déplacements de prix unidirectionnels. Il se concentre sur les e
Overview REW Signal is a technical indicator for MetaTrader 5 that generates BUY and SELL entry signals by combining three components operating inside the RSI sub-window: a raw RSI line, a Fast Moving Average of RSI, and a Slow Moving Average of RSI. A signal fires only when both the RSI line and the Fast MA cross the Slow MA in the same direction within a configurable time window. This dual-confirmation requirement significantly reduces false positives compared to a standard RSI crossover appro
FREE
Dsc Oscillator
Diogo Sawitzki Cansi
Recomended broker: https://tinyurl.com/5ftaha7c Indicator used to monitor price fluctuations in the market and discover possible reversals through reversal points or divergences in the indicator. All assets and all timeframes.   SEE OUR RESULTS ON INSTAGRAM:  https://www.instagram.com/diogo.cansi/   TELEGRAM GROUP =  https://t.me/robosdsc More information by email dscinvestimentos@gmail.com or by Whatsapp 55-991372299
FREE
The Turning point of price indicator displays assumed turning points of the price on the chart. It is based on data of the Prise Reversal oscillator and standard ADX. When the value of Prise Reversal is in overbought or oversold area (area size is set by a user), and the value of the ADX main line exceeds the preset value, the Turning point of price indicator draws an arrow pointed to the further assumed price movement. This idea is described in the article Indicator of Price Reversal . Inputs
RSI Scanner is a multi symbol multi timeframe RSI dashboard that monitors Relative Strength Index indicator for price entering and exiting overbought and oversold in up to 28 symbols and 9 timeframes. Download Demo here  (Scans only M1, M5 and M10) Settings description   here MT4 version   here RSI Scanner features: Signals RSI entering and exiting the overbought and oversold zones. Monitors 28 customizable instruments and 9 timeframes at the same time. Supports all 21 timeframes of Metatrade
This is a regression tree indicator for MT4/MT5. This indicator classificate nodes on the time period so that the deviation becomes smaller, and displays regression line and channel for each node. It's free! Attached CartDemo.ex4 and CartDemo.ex5 is a Demo version and has the following limitations: Can't use HighSpeed method (default method is RandomForest) Maximum number of bars is 260 (increase from 200) There is no expiration date and can be started many times, but it stops after an hour.
FREE
Sessions PRO MT5
Andrzej Grzegorz Kwiatkowski
5 (1)
Sessions PRO  is a perfect tool which divide your chart screen by 3 main market sessions: 1> asian 2> european (with division for Frankfurt and London start) 3> american Sessions PRO  is perfect especially for trading indices, where main pivot points often occurs along with new market center enters the market. With  Sessions PRO  you see what events happened at their exact corresponding time - European and American moves and pivot points are much more important than asian. Stop analyzing your c
Volume Time
Mauricio Bornancin Cit
Apresentação:  - O Indicador "Volume Time" da CIT Group é um indicador especializado na bolsa brasileira (B3). Objetivo:  - Especificamente desenvolvido para o perfil de pessoas que operam IntraDay. Funcionamento:  - Calculado com base nos trades realizados durante o pregão, sendo atualizado a cada 1 segundo, tendo maior precisão dos volumes Funcionalidades:  - Entrega de um conjunto de parâmetros como tipo de indicador (Financeiro, Volume ou Quantidade), estes podendo ser calculado (Unitário, U
Best Scalper 5min TF
Bruno Alexandre Azevedo Dantas
Se procuras um robô rápido, agressivo e de alta frequência , o Best Scalper 5min TF é uma das melhores opções. Projetado para timeframes ultra curtos (M5 – 5 minutos) , ele entra e sai de operações rapidamente, capitalizando nos pequenos movimentos do mercado. Este robô combina filtros de volatilidade, padrões de candles e suporte/resistência dinâmica para identificar as melhores oportunidades. Ele é otimizado para pares de moedas e índices altamente voláteis , como US100 e GOLD , onde os peque
FREE
Lomb Periodogram
Alfred Mirzasalikhov
The Lomb algorithm is designed to find the dominant cycle length in noisy data. It is used commonly in the field of astronomy and is very good at extracting cycle out of really noisy data sets. The Lomb phase plot is very similar to the Stochastics indicator. It has two threshold levels. When it crosses above the lower level it’s a buy signal. When it crosses the upper level it’s a sell signal. This is cycle-based indicator, the nicer waves look, the better the signal. Caution Also It’s really i
Bollinger Bands Technical Indicator (BB) is similar to envelopes. The only difference is that the bands of Envelopes are plotted a fixed distance (%) away from the moving average, while the Bollinger Bands are plotted a certain number of standard deviations away from it. Standard deviation is a measure of volatility, therefore Bollinger Bands adjust themselves to the market conditions. When the markets become more volatile, the bands widen and they contract during less volatile periods. This ada
FREE
Raymond Cloudy Day Indicator for MT5 – Pivot-Based Reversal and Trend Levels Raymond Cloudy Day Indicator is a pivot-based level indicator for MetaTrader 5 (MT5). It was developed by Ngo The Hung based on Raymond’s original idea and is designed to give a structured view of potential reversal zones, trend extensions and support/resistance levels directly on the chart. The default settings are optimised for XAUUSD on the H1 timeframe, but the indicator can be tested and adjusted for other symbols
FREE
Wolf Countdown
Tiziano Zambelli Sopalu
Wolf Countdown helps you not to waste the right amount of time, it gives you back the time remaining until the candle closes. How to use: Download and install the  Wolf Countdown Indicator on your MetaTrader 5. Apply the indicator to your favorite chart. this works on any timeframe... Thanks to this indicator you will never miss the right moment to enter your trades.
FREE
Les acheteurs de ce produit ont également acheté
ARICoins
Temirlan Kdyrkhan
ARICoin is a powerful trading companion designed to generate high-probability entry signals with dynamic TP/SL/DP levels based on volatility. Built-in performance tracking shows win/loss stats, PP1/PP2 hits, and success rates all updated live. Key Features: Buy/Sell signals with adaptive volatility bands Real-time TP/SL/DP levels based on ATR Built-in MA Filter with optional ATR/StdDev volatility Performance stats panel (Success, Profit/Loss, PP1/PP2) Alerts via popup, sound, push, or email Cust
SuperScalp Pro
Van Minh Nguyen
5 (8)
SuperScalp Pro – Système d’indicateur de scalping avancé multi-filtres SuperScalp Pro est un système d’indicateur de scalping avancé qui combine le Supertrend classique avec plusieurs filtres de confirmation intelligents. L’indicateur fonctionne efficacement sur toutes les unités de temps de M1 à H4 et est particulièrement adapté à XAUUSD, BTCUSD et aux principales paires Forex. Il peut être utilisé comme système autonome ou intégré de manière flexible dans des stratégies de trading existantes.
AriX
Temirlan Kdyrkhan
1 (4)
AriX Indicator for MT5 A powerful trend-following and signal-evaluation tool AriX is a custom MT5 indicator that combines Moving Averages and ATR-based risk/reward logic to generate clear buy/sell signals. It visualizes dynamic SL/TP levels, evaluates past trade outcomes, and displays win/loss statistics in a clean on-chart panel. Key features include: Buy/Sell signals based on MA crossovers ATR-based SL/TP1/TP2/TP3 levels with visual lines and labels Signal outcome tracking with real-time stat
Si vous achetez cet indicateur, vous recevrez mon Gestionnaire de Trading Professionnel + EA  GRATUITEMENT. Tout d'abord, il convient de souligner que ce système de trading est un indicateur non repeint, non redessiné et non retardé, ce qui le rend idéal pour le trading manuel et automatisé. Cours en ligne, manuel et téléchargement de préréglages. Le "Système de Trading Smart Trend MT5" est une solution de trading complète conçue pour les traders débutants et expérimentés. Il combine plus de 10
Divergence Bomber
Ihor Otkydach
4.89 (83)
Chaque acheteur de cet indicateur reçoit également gratuitement : L’outil exclusif « Bomber Utility », qui accompagne automatiquement chaque opération de trading, fixe les niveaux de Stop Loss et de Take Profit, et clôture les positions selon les règles de la stratégie Des fichiers de configuration (set files) pour adapter l’indicateur à différents actifs Des set files pour configurer le Bomber Utility selon différents modes : « Risque Minimum », « Risque Équilibré » et « Stratégie d’Attente » U
FX Trend MT5 NG
Daniel Stein
5 (4)
FX Trend NG : La Nouvelle Génération d’Intelligence de Tendance Multi-Marchés Vue d’ensemble FX Trend NG est un outil professionnel d’analyse de tendance multi-timeframe et de surveillance des marchés. Il vous permet de comprendre la structure complète du marché en quelques secondes. Au lieu de naviguer entre de nombreux graphiques, vous identifiez immédiatement quels instruments sont en tendance, où le momentum s’affaiblit et où plusieurs unités de temps sont alignées. Offre de Lancement – Ob
Entry In The Zone and SMC Multi Timeframe is a real-time market analysis tool developed based on Smart Money Concepts (SMC). It is designed to analyze market structure, price direction, reversal points, and key zones across multiple timeframes in a systematic way. The system displays Points of Interest (POI) and real-time No Repaint signals, with instant alerts when price reaches key zones or when signals occur within those zones. It functions as both an Indicator and a Signal System (2-in-1), c
Game Changer Indicator mt5
Vasiliy Strukov
4.8 (20)
Game Changer est un indicateur de tendance révolutionnaire conçu pour être utilisé sur n'importe quel instrument financier et transformer votre MetaTrader en un puissant outil d'analyse de tendance. Il fonctionne sur toutes les unités de temps et facilite l'identification des tendances, signale les retournements potentiels, sert de mécanisme de stop suiveur et fournit des alertes en temps réel pour une réactivité optimale du marché. Que vous soyez un professionnel chevronné ou un débutant en qu
RFI levels PRO MT5
Roman Podpora
3.67 (3)
L'indicateur montre avec précision les points de retournement et les zones de retour des prix où le       Acteurs majeurs   . Vous repérez les nouvelles tendances et prenez des décisions avec une précision maximale, en gardant le contrôle de chaque transaction. VERSION MT4     -    Révèle son potentiel maximal lorsqu'il est combiné à l'indicateur   TREND LINES PRO Ce que l'indicateur montre : Structures et niveaux d'inversion avec activation au début d'une nouvelle tendance. Affichage des nivea
Power Candles MT5
Daniel Stein
5 (6)
Power Candles – Signaux d’entrée basés sur la force pour tous les marchés Power Candles intègre l’analyse de force éprouvée de Stein Investments directement dans le graphique des prix. Au lieu de réagir uniquement au prix, chaque bougie est colorée en fonction de la force réelle du marché, ce qui permet d’identifier instantanément les phases de momentum, l’accélération de la force et les transitions de tendance propres. Une logique unique pour tous les marchés Power Candles fonctionne automatiqu
FX Power MT5 NG
Daniel Stein
5 (31)
FX Power : Analysez la force des devises pour des décisions de trading plus intelligentes Aperçu FX Power est l'outil essentiel pour comprendre la force réelle des principales devises et de l'or, quelles que soient les conditions du marché. En identifiant les devises fortes à acheter et les faibles à vendre, FX Power simplifie vos décisions de trading et révèle des opportunités à forte probabilité. Que vous suiviez les tendances ou anticipiez les retournements à l'aide de valeurs extrêmes de D
Azimuth Pro
Ottaviano De Cicco
5 (4)
LAUNCH PROMO Azimuth Pro price is initially set at 299$ for the first 100 buyers. Final price will be 499$ . THE DIFFERENCE BETWEEN RETAIL AND INSTITUTIONAL ENTRIES ISN'T THE INDICATOR — IT'S THE LOCATION. Most traders enter at arbitrary price levels, chasing momentum or reacting to lagging signals. Institutions wait for price to reach structured levels where supply and demand actually shift. Azimuth Pro maps these levels automatically: swing-anchored VWAP, multi-timeframe structure lines, an
TREND LINES PRO   Cet indicateur permet de comprendre les véritables changements de direction du marché. Il révèle les renversements de tendance et les points de retour des principaux acteurs. Tu vois   Lignes BOS   Détection des changements de tendance et des niveaux clés sur des unités de temps supérieures, sans paramètres complexes ni interférences inutiles. Les signaux restent affichés sur le graphique même après la fermeture de la bougie. Version MT4   -   Révèle son potentiel maximal lorsq
Smart Stop Indicator – Précision intelligente du stop-loss directement sur votre graphique Présentation Smart Stop Indicator est la solution idéale pour les traders qui souhaitent placer leur stop-loss de manière claire et méthodique, sans deviner ni suivre leur intuition. Cet outil combine la logique classique de price action (succession de plus hauts et de plus bas) avec une reconnaissance moderne des cassures pour identifier le prochain niveau de stop réellement logique. Que le marché soit
Atomic Analyst MT5
Issam Kassas
4.1 (29)
Tout d'abord, il convient de souligner que cet indicateur de trading n'est ni repainting, ni redrawing et ne présente aucun délai, ce qui le rend idéal à la fois pour le trading manuel et automatisé. Manuel de l'utilisateur : réglages, entrées et stratégie. L'Analyste Atomique est un indicateur d'action sur les prix PA qui utilise la force et le momentum du prix pour trouver un meilleur avantage sur le marché. Équipé de filtres avancés qui aident à éliminer les bruits et les faux signaux, et à
Trend Screener Pro MT5
STE S.S.COMPANY
4.84 (101)
Indicateur de tendance, solution unique révolutionnaire pour le trading et le filtrage des tendances avec toutes les fonctionnalités de tendance importantes intégrées dans un seul outil ! Il s'agit d'un indicateur multi-période et multi-devises 100 % non repeint qui peut être utilisé sur tous les symboles/instruments : forex, matières premières, crypto-monnaies, indices et actions. Trend Screener est un indicateur de suivi de tendance efficace qui fournit des signaux de tendance fléchés avec des
Quantum TrendPulse
Bogdan Ion Puscasu
5 (20)
Présentation de   Quantum TrendPulse   , l'outil de trading ultime qui combine la puissance de   SuperTrend   ,   RSI   et   Stochastic   dans un seul indicateur complet pour maximiser votre potentiel de trading. Conçu pour les traders qui recherchent précision et efficacité, cet indicateur vous aide à identifier les tendances du marché, les changements de dynamique et les points d'entrée et de sortie optimaux en toute confiance. Caractéristiques principales : Intégration SuperTrend :   suivez f
FX Levels MT5
Daniel Stein
5 (13)
FX Levels : Des zones de Support et Résistance d’une Précision Exceptionnelle pour Tous les Marchés Présentation Rapide Vous recherchez un moyen fiable pour déterminer des niveaux de support et résistance dans n’importe quel marché—paires de devises, indices, actions ou matières premières ? FX Levels associe la méthode traditionnelle « Lighthouse » à une approche dynamique de pointe, offrant une précision quasi universelle. Grâce à notre expérience réelle avec des brokers et à des mises à jour
Trend indicator AI mt5
Ramil Minniakhmetov
5 (15)
L'indicateur Trend Ai est un excellent outil qui améliorera l'analyse du marché d'un trader en combinant l'identification des tendances avec des points d'entrée exploitables et des alertes d'inversion. Cet indicateur permet aux utilisateurs de naviguer dans les complexités du marché forex avec confiance et précision Au-delà des signaux primaires, l'indicateur Trend Ai identifie les points d'entrée secondaires qui surviennent lors des retraits ou des retracements, permettant aux traders de capit
Grabber System MT5
Ihor Otkydach
4.82 (22)
Je vous présente un excellent indicateur technique : Grabber, qui fonctionne comme une stratégie de trading "tout-en-un", prête à l'emploi. En un seul code sont intégrés des outils puissants d'analyse technique du marché, des signaux de trading (flèches), des fonctions d'alerte et des notifications push. Chaque acheteur de cet indicateur reçoit également gratuitement : L'utilitaire Grabber : pour la gestion automatique des ordres ouverts Un guide vidéo étape par étape : pour apprendre à installe
RelicusRoad Pro : Système d'Exploitation Quantitatif du Marché 70% DE RÉDUCTION ACCÈS À VIE (DURÉE LIMITÉE) - REJOIGNEZ 2 000+ TRADERS Pourquoi la plupart des traders échouent-ils même avec des indicateurs "parfaits" ? Parce qu'ils tradent des concepts isolés dans le vide. Un signal sans contexte est un pari. Pour gagner, il faut de la CONFLUENCE . RelicusRoad Pro est un Écosystème Quantitatif complet . Il cartographie la "Fair Value Road", distinguant le bruit des cassures structurelles. Arrête
Top indicator for MT5   providing accurate signals to enter a trade without repainting! It can be applied to any financial assets:   forex, cryptocurrencies, metals, stocks, indices .  Watch  the video  (6:22) with an example of processing only one signal that paid off the indicator! MT4 version is here It will provide pretty accurate trading signals and tell you when it's best to open a trade and close it. Most traders improve their trading results during the first trading week with the help of
IX Power MT5
Daniel Stein
4.92 (13)
IX Power : Découvrez des insights de marché pour les indices, matières premières, cryptomonnaies et forex Vue d’ensemble IX Power est un outil polyvalent conçu pour analyser la force des indices, matières premières, cryptomonnaies et symboles forex. Tandis que FX Power offre une précision maximale pour les paires de devises en utilisant toutes les données disponibles, IX Power se concentre exclusivement sur les données du symbole sous-jacent. Cela fait de IX Power un excellent choix pour les m
FX Dynamic MT5
Daniel Stein
5 (5)
FX Dynamic : Suivez la volatilité et les tendances grâce à une analyse ATR personnalisable Vue d’ensemble FX Dynamic est un outil performant s’appuyant sur les calculs de l’Average True Range (ATR) pour fournir aux traders des informations incomparables sur la volatilité quotidienne et intrajournalière. En définissant des seuils de volatilité clairs — par exemple 80 %, 100 % et 130 % — vous pouvez rapidement repérer des opportunités de profit ou recevoir des avertissements lorsque le marché dé
ARIPoint
Temirlan Kdyrkhan
ARIPoint is a powerful trading companion designed to generate high-probability entry signals with dynamic TP/SL/DP levels based on volatility. Built-in performance tracking shows win/loss stats, PP1/PP2 hits, and success rates all updated live. Key Features: Buy/Sell signals with adaptive volatility bands Real-time TP/SL/DP levels based on ATR Built-in MA Filter with optional ATR/StdDev volatility Performance stats panel (Success, Profit/Loss, PP1/PP2) Alerts via popup, sound, push, or email Cu
Candle Smart Range
Gianny Alexander Lugo Sanchez
Candle Smart Range (CSR) pour MetaTrader 5 Candle Smart Range est un indicateur technique conçu pour l'identification automatique des plages de prix sur plusieurs unités de temps. Cet outil analyse la structure du marché en se basant sur les formations de bougies et l'interaction du prix avec les plus hauts et plus bas précédents. Caractéristiques principales : Détection de Plages : Identifie les zones de consolidation avant les mouvements impulsifs. Identification des Fausses Cassures : Marque
Trend Forecaster
Alexey Minkov
5 (7)
The Trend Forecaster indicator utilizes a unique proprietary algorithm to determine entry points for a breakout trading strategy. The indicator identifies price clusters, analyzes price movement near levels, and provides a signal when the price breaks through a level. The Trend Forecaster indicator is suitable for all financial assets, including currencies (Forex), metals, stocks, indices, and cryptocurrencies. You can also adjust the indicator to work on any time frames, although it is recommen
Mirage Trading System — False Breakout Reversal Indicator for MT5 False breakouts occur when price moves beyond a key level and then reverses back inside. The Mirage Trading System scans for this formation — the Fakey pattern — and identifies the point where the breakout fails and price returns to the prior range. Every detected pattern is evaluated by a 17-factor quality scoring system and classified through a 4-layer Signal Engine before it appears on the chart. USER MANUAL ,  Elite Trading S
L'indicateur « Dynamic Scalper System MT5 » est conçu pour la méthode de scalping, permettant de trader au sein des vagues de tendance. Testé sur les principales paires de devises et l'or, il est compatible avec d'autres instruments de trading. Fournit des signaux pour l'ouverture de positions à court terme le long de la tendance, avec un support supplémentaire pour les fluctuations de prix. Principe de l'indicateur : De grandes flèches déterminent la direction de la tendance. Un algorithme de
Présentation       Quantum Breakout PRO   , l'indicateur révolutionnaire MQL5 qui transforme la façon dont vous négociez les zones d'évasion ! Développé par une équipe de traders expérimentés avec une expérience commerciale de plus de 13 ans,       Évasion quantique PRO       est conçu pour propulser votre parcours commercial vers de nouveaux sommets grâce à sa stratégie de zone de discussion innovante et dynamique. Quantum Breakout Indicator vous donnera des flèches de signalisation sur les z
Plus de l'auteur
Elder MACD Combo
Financial Trading Seminars Inc.
MACD Histogram tracks the difference between the MACD line and the Signal line (which is the exponential moving average of the first line). For better visibility, when plotting the lines and the histogram in the same window, we scale up the histogram by a factor of 2. Furthermore, we use two separate plots for the histogram, which allows us to color-code the bars for upticks and downticks. The MACD Combo overlays MACD lines on MACD Histogram. Putting both plots in the same window enables you to
Elder Impulse System
Financial Trading Seminars Inc.
L'Impulse System a été décrit pour la première fois dans le livre "Entrez dans ma salle de marché". Il utilise la direction de l'histogramme MACD et une moyenne mobile exponentielle (EMA) du prix pour définir une impulsion. La règle est de ne jamais trader à contre-courant. Son code couleur vous donne plusieurs signaux : Lorsque l'EMA et l'histogramme MACD augmentent, le système Impulse colore la barre en vert (aucun court-circuit n'est autorisé). Lorsque l'EMA et l'histogramme MACD baissent,
Elder Impulse Release
Financial Trading Seminars Inc.
The purpose of Impulse Release is to prevent trading in the wrong direction. While the Impulse System operates in a single timeframe, Impulse Release is based on two timeframes. It tracks both the longer and the shorter timeframes to find when the Impulse points in the same direction on both. Its color bar flashes several signals: If one timeframe is in a buy mode and the other in a sell mode, the signal is "No Trade Allowed", a  black bar. If both are neutral, then any trades are allowed, showi
Elder Chandelier Long Exit
Financial Trading Seminars Inc.
The Chandelier Exit, introduced by Charles LeBeau, is described in "Come into My Trading Room" book. It calculates each stop on a long position in an uptrend from the highest point reached during that rally, and gets its name from the chandelier, which hangs from the highest point in the room. The Chandelier Exit uses a multiple of the Average True Range (ATR), subtracting it from the highest high since the trade was entered. It creates a new trade whenever the previous trade is stopped out. Cha
Elder Chandelier Long Entries
Financial Trading Seminars Inc.
One of the key rules in trading is never move your stops in such a way that your risk increases. Our stop sequence shows the automatic tightening of stops. They appear as a series of decreasing risk points until the trade is eventually stopped out. The problem is that if you enter a trade at any other point than the initial dot of the sequence, you may be placing the stop too close. Stop-entry plots show you the initial value for the stop for each bar. You can use them when you put on a trade, a
Elder Chandelier Short Exit
Financial Trading Seminars Inc.
The Chandelier Exit, introduced by Charles LeBeau, is described in "Come into My Trading Room" book. It calculates each stop on a short position in a downtrend from the lowest point reached during that decline. The Chandelier Exit uses a multiple of the Average True Range (ATR), adding it to the lowest low since the trade was entered. It creates a new trade whenever the previous trade is stopped out. Chandelier Stops differ from traditional stops by having the ability to move against you if the
Elder Chandelier Short Entries
Financial Trading Seminars Inc.
One of the key rules in trading is never move your stops in such a way that your risk increases. Our stop sequence shows the automatic tightening of stops. They appear as a series of decreasing risk points until the trade is eventually stopped out. The problem is that if you enter a trade at any other point than the initial dot of the sequence, you may be placing the stop too close. Stop-entry plots show you the initial value for the stop for each bar. You can use them when you put on a trade, a
Elder MACD XOver
Financial Trading Seminars Inc.
The MACD XOver indicator was developed by John Bruns to predict the price point at which MACD Histogram will reverse the direction of its slope. The indicator is plotted one day ahead into the future, allowing, if your strategy depends on MACD Histogram, to predict its reversal point for tomorrow (or the next bar in any timeframe). If the closing price tomorrow is above the value of this indicator, then MACD Histogram will tick up. If the closing price tomorrow is below the value of this indicat
Elder Market Thermometer
Financial Trading Seminars Inc.
The Market Thermometer is described in "Come into my Trading Room" book.  It measures the degree of volatility, as reflected in greater or smaller intraday ranges. When the Market Temperature spikes above its average or stays below its average for a number of days, it gives trading signals, as described in the book. Parameters: Thermometer_EMA_Length (22) – The length of the moving average of the Market Temperature. The default 22, the average number of trading days in a month. Spike_Alert_Facto
Elder SafeZone Long
Financial Trading Seminars Inc.
SafeZone is a method for setting stops on the basis of recent volatility, outside the level of market noise. It is described in "Come into my Trading Room" book. In an uptrend, SafeZone defines noise as that portion of the current bar that extends below the low of the previous bar, going against the prevailing trend. It averages the noise level over a period of time and multiplies it by a trader-selected factor. For long trades, SafeZone subtracts the average noise level, multiplied by a factor
Elder SafeZone Long Entries
Financial Trading Seminars Inc.
One of the key rules in trading is never move your stops in such a way that your risk increases. Our stop sequence shows the automatic tightening of stops. They appear as a series of decreasing risk points until the trade is eventually stopped out. The problem is that if you enter a trade at any other point than the initial dot of the sequence, you may be placing the stop too close. Stop-entry plots show you the initial value for the stop for each bar. You can use them when you put on a trade,
Elder SafeZone Short
Financial Trading Seminars Inc.
SafeZone is a method for setting stops on the basis of recent volatility, outside the level of market noise. It is described in "Come into my Trading Room" book. In a downtrend, SafeZone defines noise as the portion of the current bar that extends above the high of the previous bar, against the downtrend. It averages the noise level over a period of time and multiplies it by a trader-selected factor. For short trades, it adds the average noise level, multiplied by a factor, to the latest high t
Elder SafeZone Short Entries
Financial Trading Seminars Inc.
One of the key rules in trading is never move your stops in such a way that your risk increases. Our stop sequence shows the automatic tightening of stops. They appear as a series of decreasing risk points until the trade is eventually stopped out. The problem is that if you enter a trade at any other point than the initial dot of the sequence, you may be placing the stop too close. Stop-entry plots show you the initial value for the stop for each bar. You can use them when you put on a trade,
Elder Smoothed ROC
Financial Trading Seminars Inc.
The Smoothed ROC indicator, developed by Fred Schutzman, is described in "Trading for a Living" book. It is created by calculating the rate of change for an exponential moving average of closing prices. When it changes direction, it helps identify and confirm trend changes. Parameters Smoothing_EMA_Length (13) – The length of the EMA used for smoothing; ROC_Period (21) – The length of the rate of change calculation.
Elder Force Index With ATR Channels
Financial Trading Seminars Inc.
3 (1)
L'ajout de canaux Average True Range (ATR) au Force Index a été suggéré par Kerry Lovvorn. L’ajout de ces canaux fait de Force Index un excellent outil pour identifier les hauts et les bas intermédiaires. Force Index avec les canaux ATR ne capte pas tous les virages, mais ceux qu'il identifie méritent une attention très sérieuse. Remarque : le mot « true» dans Average True Range fait référence à la gestion des écarts de prix. Puisqu'il n'y a pas d'écart dans l'indice de force, l'ATR est ici le
Filtrer:
Aucun avis
Répondre à l'avis