Elder SafeZone Long
- Indicatori
-
Financial Trading Seminars Inc.
 Dr. Alexander Elder
Dr. Alexander Elder is a professional trader based in New York City. He is the author of 11 books, including Trading for a Living (1996) and - Versione: 2.0
- Aggiornato: 17 novembre 2021
- Attivazioni: 5
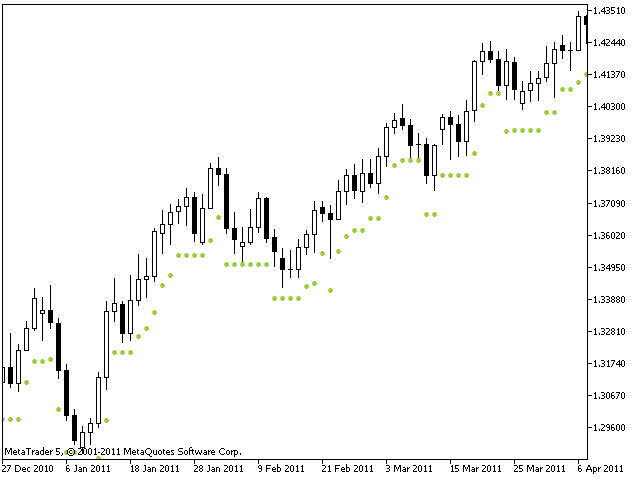
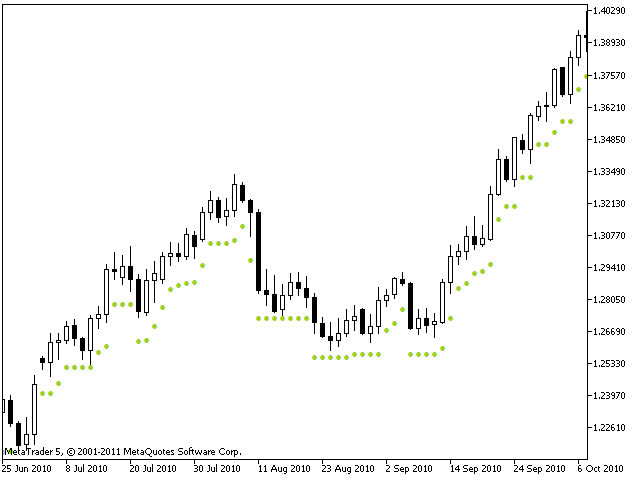
SafeZone is a method for setting stops on the basis of recent volatility, outside the level of market noise. It is described in "Come into my Trading Room" book.
In an uptrend, SafeZone defines noise as that portion of the current bar that extends below the low of the previous bar, going against the prevailing trend. It averages the noise level over a period of time and multiplies it by a trader-selected factor.
For long trades, SafeZone subtracts the average noise level, multiplied by a factor, from the current low. Stops are allowed to move only in the direction of the trade, always tightening. When a trade is stopped out, this indicator reverses and starts a new sequence.
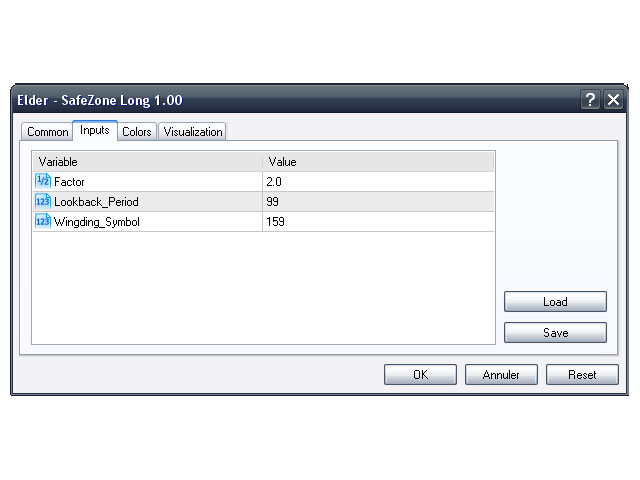
Parameters
- Factor (22) – This is the factor by which we multiply the average level of noise computed by SafeZone.
- Lookback_Period (99) – The number of bars that the SafeZone looks back when calculating an average market noise.
- Wingding_Symbol (159) – Symbol to be displayed.