Simple Market Structure MT4

SMS | Simple Market Structure

Simple Market Structure is an indicator designed to represent market structure in a simple, clean, and easy-to-understand way.

Many market structure indicators available today are overly complicated and filled with unnecessary visuals, making them difficult to understand — especially for traders who want to quickly identify market direction and structure.
That is why this indicator was created.

This indicator focuses only on the essential components:

  • Bullish/Bearish BOS (Break of Structure) 
  • Fibonacci retracement status
  • Retracement entry direction

The UI is intentionally designed to be minimal and simple, allowing traders to read the market structure more clearly without unnecessary distractions.


How It Works

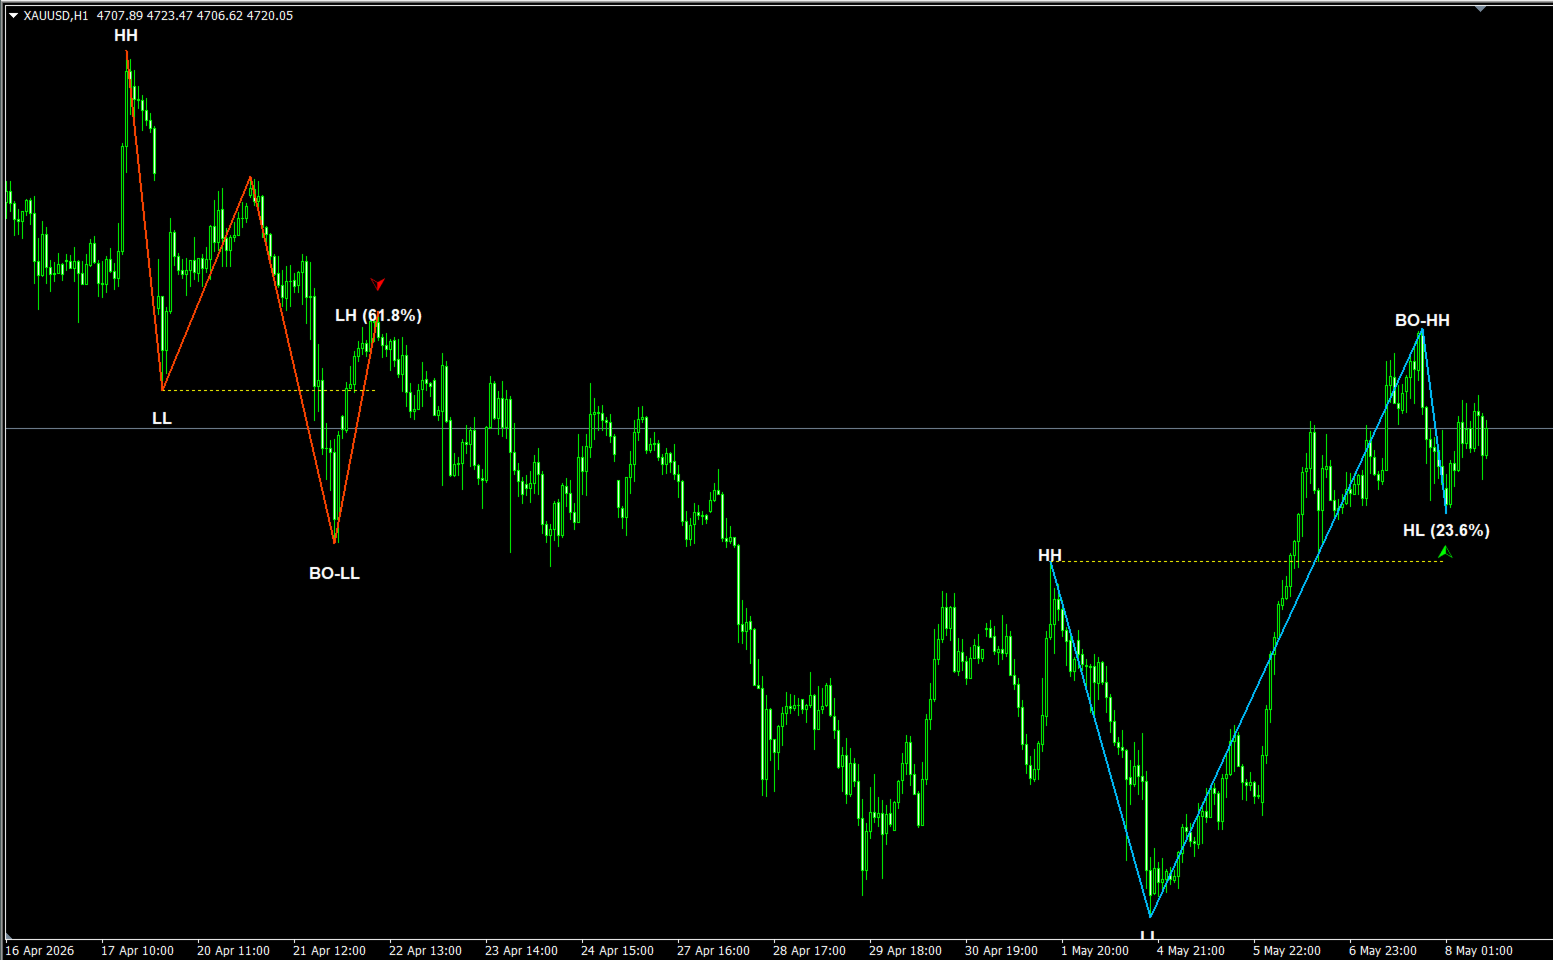
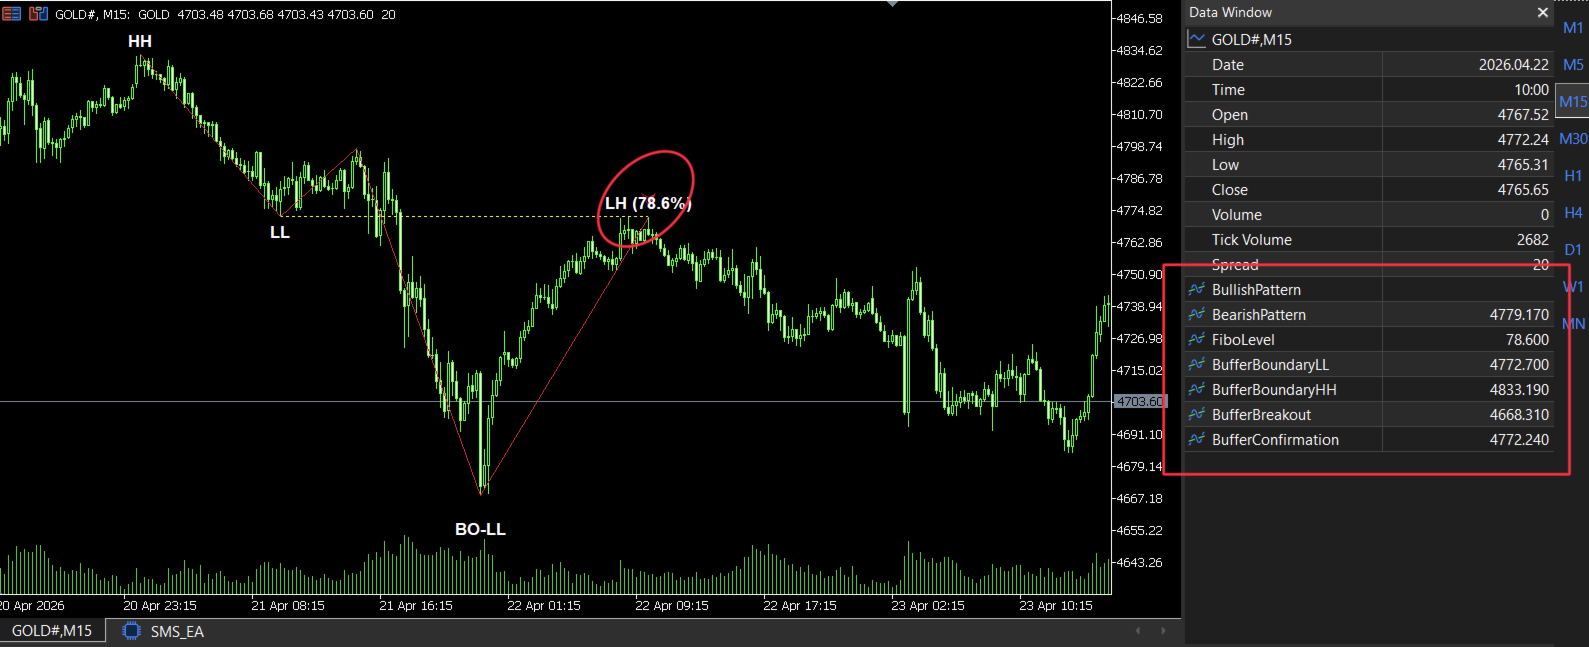
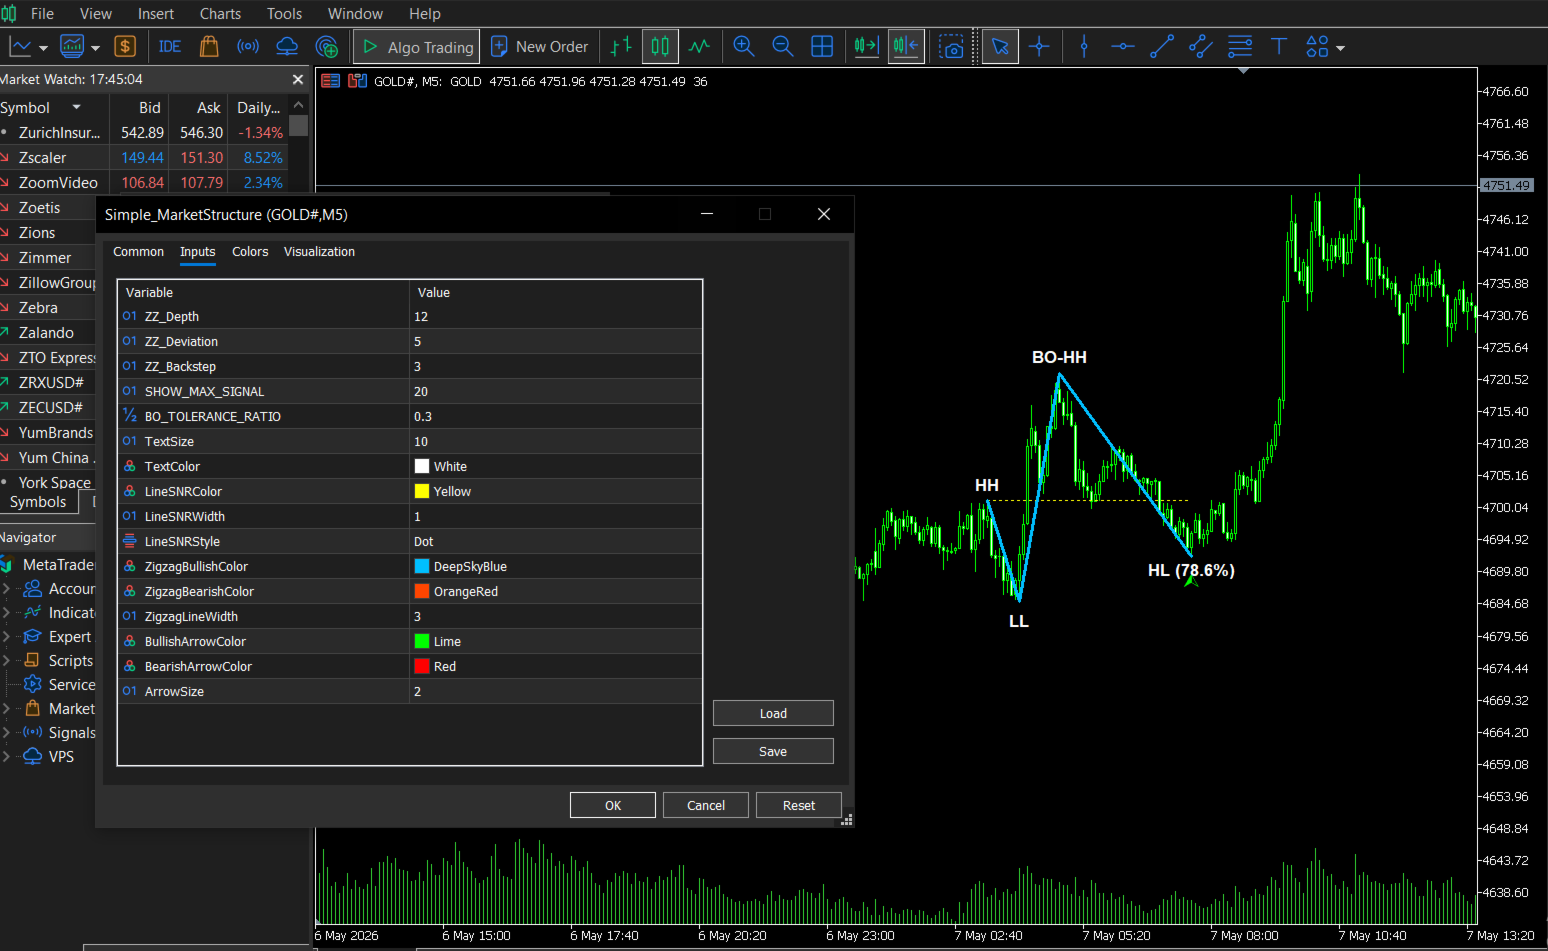
The indicator automatically identifies important market structure points such as:

  • Higher High (HH)
  • Higher Low (HL)
  • Lower High (LH)
  • Lower Low (LL)

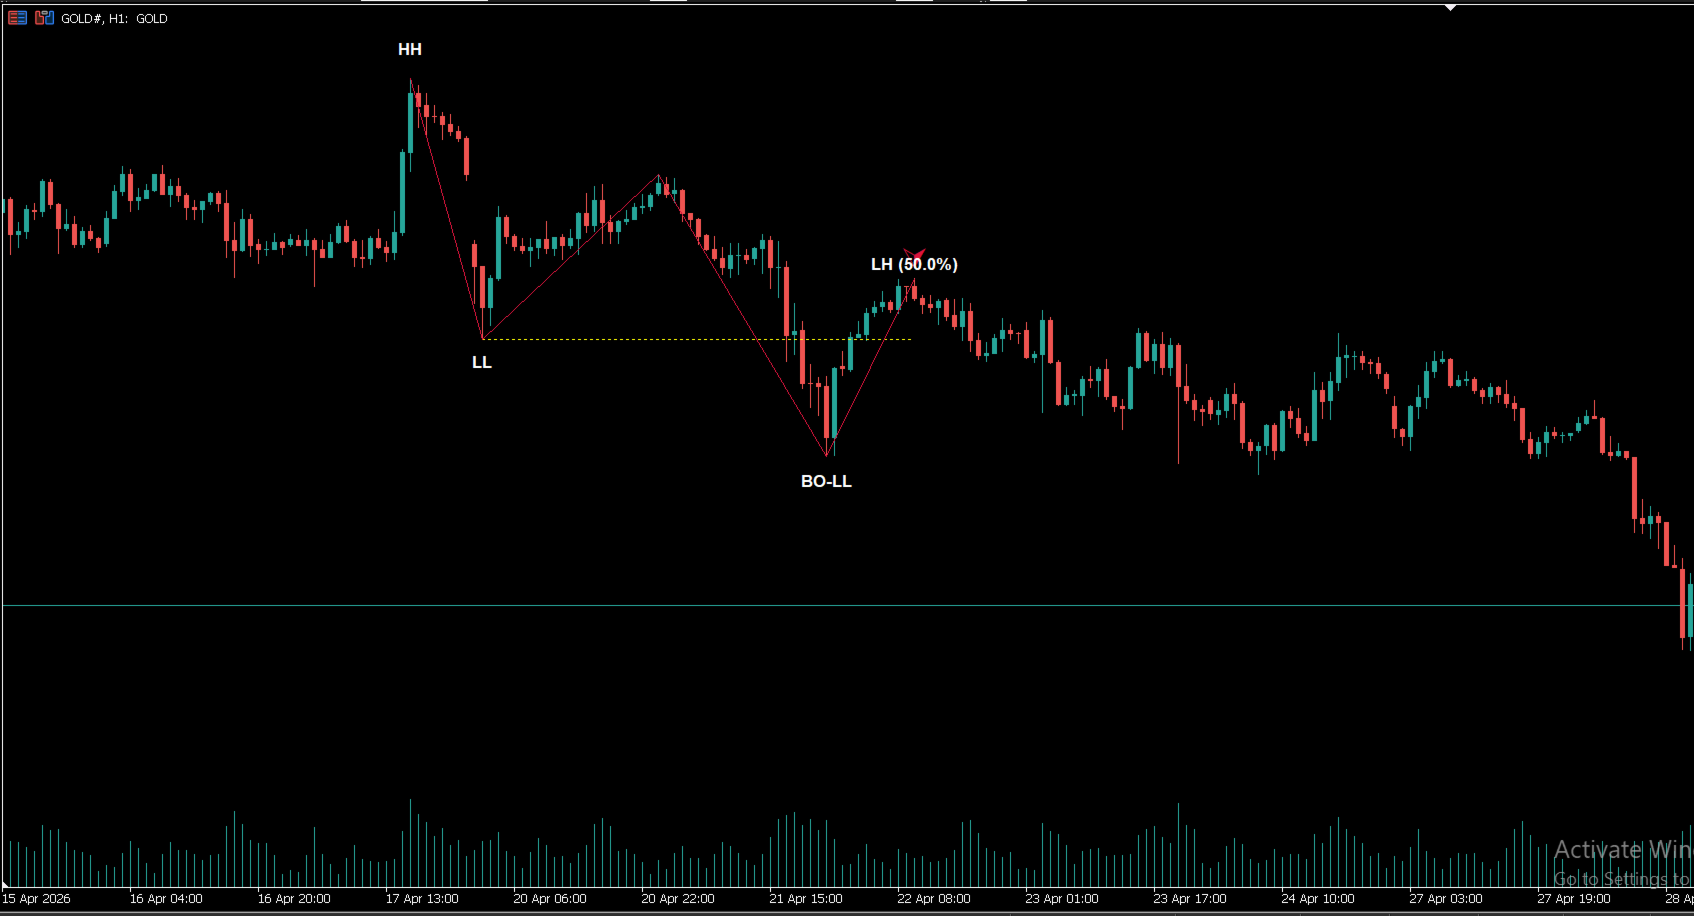
From these structure points, the indicator forms a BOS (Break of Structure) pattern to help traders understand the current market direction more clearly.

When a bullish BOS is formed, it indicates that buyers are starting to dominate the market. Likewise, when a bearish BOS appears, it shows that sellers are gaining control.

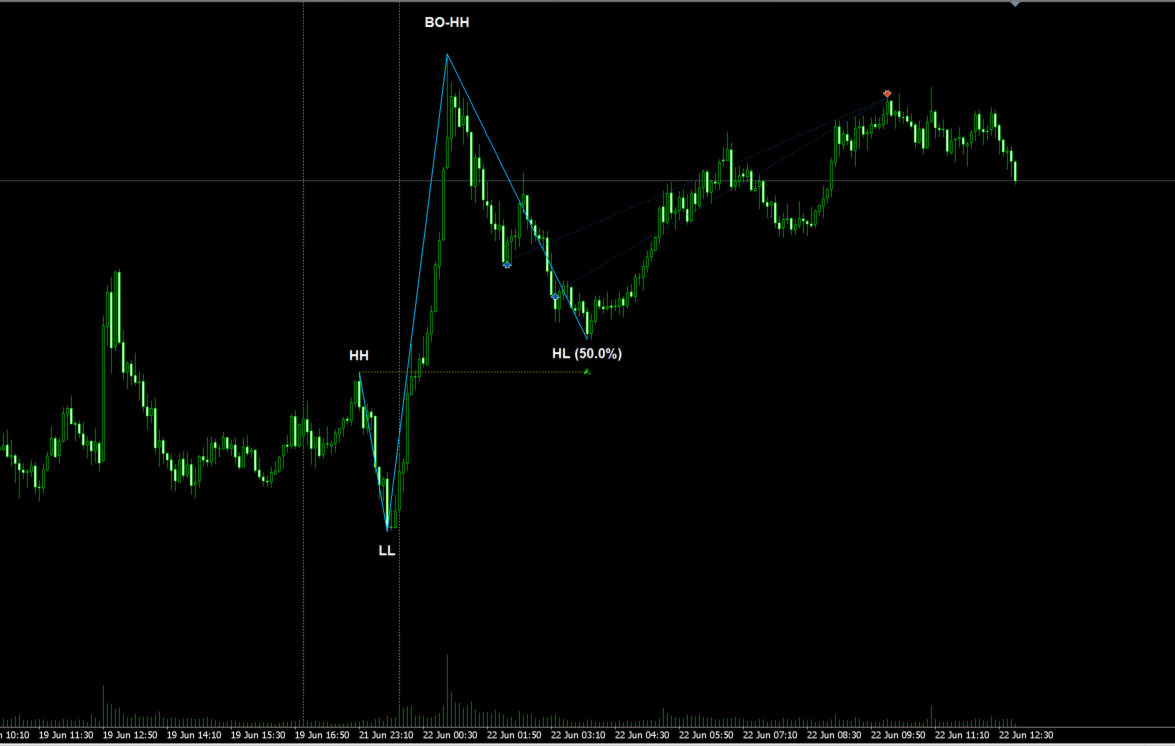
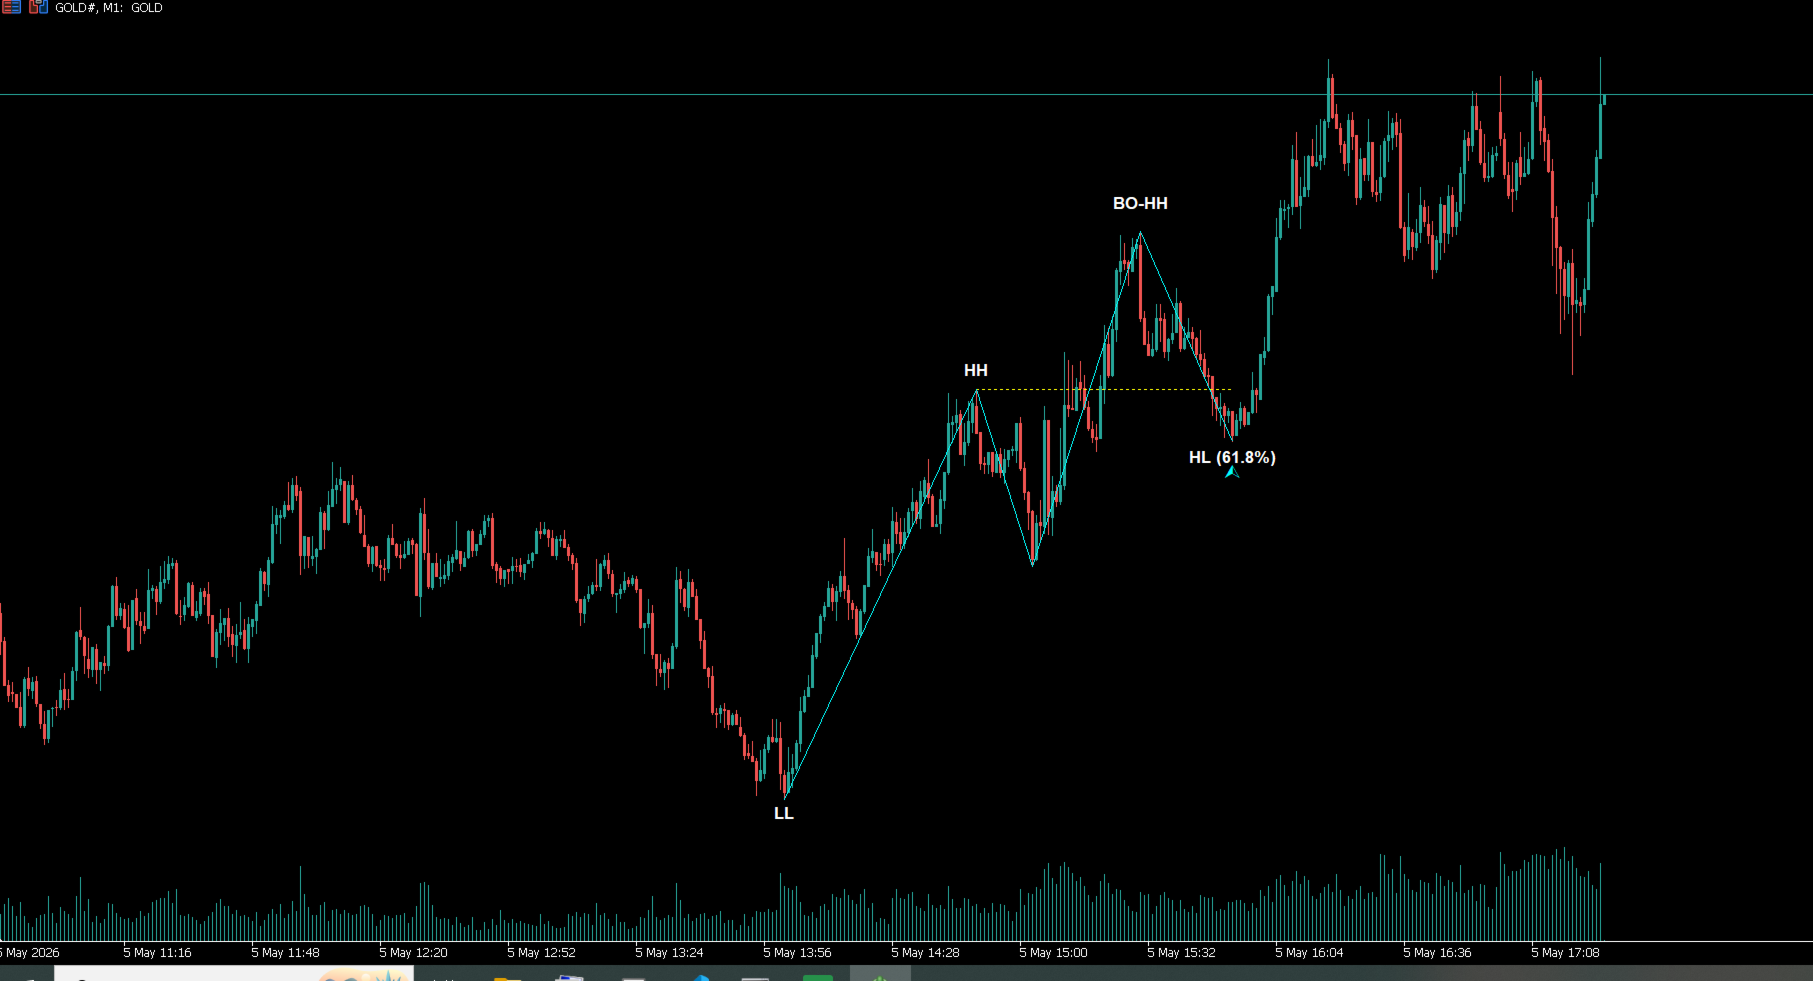
After a valid BOS is detected, the indicator automatically displays the potential retracement area along with Fibonacci levels to help identify possible entry zones.

The appearance of upward or downward arrows indicates potential rejection or retracement reactions from important structure areas.

These signals can be used as additional confirmation for continuation or reversal opportunities.

With its simple visualization, traders can analyze market structure more easily without manually drawing swing points, BOS areas, or Fibonacci retracements.


Features

  • Simple and easy-to-understand UI
  • Includes retracement entry arrows with Fibonacci level information
  • Provides buffers for further development or EA integration
  • Supports alert and push notification features

Perfect for traders who prefer a clean, lightweight, and straightforward market structure analysis tool.

Prodotti consigliati
Tract
Andriy Sydoruk
Tract - Channel indicator, by which you can place orders like a classic channel indicator. Trading can be carried out inside the channel when the price reaches its borders and turns in the opposite direction from them. In such cases, reversal strategies are used. The channel indicator is designed to work with support and resistance levels and help traders find opportunities to enter the market. Another way to trade a breakout - assumes a situation when the price, upon reaching one or another cha
FIBO Price Calculator  Brief Description 1. Automated Fibonacci Retracement Drawing This indicator automatically draws Fibonacci Retracement lines on the MT4 chart, assisting traders in quickly identifying potential support and resistance levels. 2. Customizable Fibonacci Sequence Users can customize the Fibonacci sequence values, and the indicator automatically converts them into corresponding price levels based on the current market price. 3. Adjustable Indicator Window Position The indicator
Octave Fractal Channel — Dynamic Gann-Based Support/Resistance Levels with Auto-Scaling. This indicator plots a dynamic channel based on the fractal structure of price movement. Channel levels adapt to the current symbol and timeframe, making it suitable for use across various financial instruments — from currency pairs to cryptocurrencies and indices. The indicator can be used in combination with other technical tools, such as the RSI oscillator, to provide additional signal filtering. How to
L'indicatore SMC Venom Model BPR è uno strumento professionale per i trader che operano nell'ambito del concetto di Smart Money (SMC). Identifica automaticamente due modelli chiave sul grafico dei prezzi: FVG   (Fair Value Gap) è una combinazione di tre candele, in cui c'è un gap tra la prima e la terza candela. Forma una zona tra livelli in cui non c'è supporto di volume, il che spesso porta a una correzione dei prezzi. BPR   (Balanced Price Range) è una combinazione di due modelli FVG che for
Auto Fibo Pro m
DMITRII GRIDASOV
Indicatore "Auto FIBO Pro" Crypto_Forex: è un ottimo strumento ausiliario nel trading! - L'indicatore calcola e posiziona automaticamente sul grafico i livelli di Fibo e le linee di tendenza locali (colore rosso). - I livelli di Fibonacci indicano le aree chiave in cui il prezzo può invertirsi. - I livelli più importanti sono 23,6%, 38,2%, 50% e 61,8%. - Puoi usarlo per lo scalping di inversione o per il trading di zone grid. - Ci sono molte opportunità per migliorare il tuo sistema attuale usa
"The Squeeze indicator attempts to identify periods of consolidation in a market. In general the market is either in a period of quiet consolidation or vertical price discovery. By identifying these calm periods, we have a better opportunity of getting into trades with the potential for larger moves. Once a market enters into a "squeeze," we watch the overall market momentum to help forecast the market direction and await a release of market energy." The StdATR Squeeze Channel combines standard
EARLY REMINDER: The Starting price is 65 price will rise soon up to 365$ and then 750$ after first 10 copies of sales. Grab this offer now! Introduction Hello, traders! Welcome to the demonstration of the Forex Beast Indicator , a comprehensive tool designed to assist aspiring traders in navigating the complexities of the forex market. This indicator incorporates seven essential components to provide a well-rounded trading experience: Moving Averages Colored Zones Support and Resistance Levels
Voenix
Lorentzos Roussos
4.58 (12)
Modelli armonici ,scanner e trader Modelli inclusi: Modello ABCD Modello Gartley Modello pipistrello Modello cifrato 3Modello di guida Motivo cigno nero Motivo cigno bianco Motivo Quasimodo o Motivo Over Under Modello alternativo del pipistrello Motivo a farfalla Modello di granchio profondo Modello di granchio Modello di squalo Modello FiveO Modello testa e spalle Modello triangolo ascendente Uno due tre modello E 8 modelli personalizzati Voenix è uno scanner di pattern armonici multi timefram
Auto AndrewFork
Noor Ghani Rahman
1 (1)
Auto Pitchfork Indicator The indicator calculate the Pitch fork for the previous Day (Selectable) with multiple Support and Resistance lines from the Median price which acts as Magnet for the Price that if price touch the above warning (1) or below warning (1) lines and not cross up or down then there is maximum possibilities that it will return to the Median Line, and thus maintain the Price Action in Cyclic Pattern to the Market Move. You are able to select how many warning lines you want to k
Features: Waddah Trend, Explosion Increase/Decrease Trend Percentage with Threshold DeadZone Trend Direction Aligned Checks Highlight and Alerts Multi-Timeframe & Multi-Currency Check out the blog post for more info: https://www.mql5.com/en/blogs/post/758020 With customizable threshold, you can identify best trading opportunities in volume-based trading. Use Trend Height (x times Explosion): Trend height in relation to the explosion signal Trend Percent: Compares the trend height to the maximu
FiboPlusWaveRunner
Sergey Malysh
3.29 (7)
Expert. Automatic and manual trading. Ready-made trading system based on Elliott waves and Fibonacci retracement levels . It is simple and affordable. Display of the marking of Elliott waves (main or alternative option) on the chart Construction of horizontal levels, support and resistance lines, a channel Superposition of Fibonacci levels on waves 1, 3, 5, A Alert system (on-screen, E-Mail, Push notifications) visual panel for opening orders in manual trading visual panel for setting up automat
This is a new strategy for SUPPLY DEMAND areas It is based on a calculation using the tick volume to detect the big price action in market for both bear /bull actions this smart volume action candles are used to determine the supply and demand areas prices in between main supply and demand lines indicate sideway market  up arrows will be shown when prices moves above the main supply and the secondary supply lines Down arrows will be shown when prices moves below the main demand and the secondary
Trend Ray
Andriy Sydoruk
The indicator shows the potential trend direction by cyclical-wave dependence. Thus, all the rays of the intersection will be optimal rays, in the direction of which the price is expected to move, taking into account the indicator period. Rays can be used as a direction for potential market movement. But we must not forget that the approach must be comprehensive, the indicator signals require additional information to enter the market.
Shark Deal Book
Philip Pankaj Suthagar
4 (3)
Term  "shark"  in the business world denotes a high volume investor who just made a good investment in a highly Potential business deal.So, sharks are the ones who make the market move. In our case, if an American shark bought a Japanese company, he/she has to convert American dollars into Japanese yen to make the deal. So, the demand for the Japanese yen will increase sharply. Thus USD/JPY will go short rapidly if the deal was from the shark. Another example, In the case of forex, if fed increa
Master head and shoulders patterns for better trading decisions A head and shoulders pattern is a chart formation that resembles a baseline with three peaks, the outside two are close in height and the middle is highest. It predicts a bullish-to-bearish trend reversal and is believed to be one of the most reliable trend reversal patterns. It is one of several top patterns that signal, with varying degrees of accuracy, that a trend is nearing its end. [ Installation Guide | Update Guide | Trouble
This indicator is a great utilities tools for Fibonacci Trader that draw their chart manually. This indicator do not draw any Fibonacci Retracement or Fibonacci Expansion. It is a utilities tool for modifying the Fibonacci level for Fibonacci object manually drawn on the chart. Just draw using the Fibonacci Retracement or other Fibonacci tool in MT4 as per normal. The select the Fibonacci you have just drawn. Make sure you have only 1 object selected. Then open up this Fibonacci Level Management
Utility for show on charts the visual informations about: - a vertical line at start of each bar of selected timeframe - a vertical line at start of each day - a vertical line at start of each week - vertical lines at start / end of trading sessions selected - bid / ask prices, spread, money value for each point (of 1 standard lot) and last tick time recived" You can enable / disable each information and set the color for each line
FREE
BONUS INDICATOR HERE :  https://linktr.ee/ARFXTools BBMA Fibo Musang Alert Trend Scanner Smart Indicator Powered by 3 Proven Trading Systems – All in One! Take your trading to the next level with this intelligent indicator that combines three of the most powerful and time-tested strategies in the market: BBMA Oma Ally – Your main reference for trend direction & market mapping Fibo Musang CBR – Automatically alerts you on key breakout opportunities Multi Trend Scanner – Fully custom
Chart Patterns Detect 15 patterns (Ascending Triangle, Descending Triangle, Rising Wedge, Falling Wedge, Bullish Flag, Bearish Flag, Bullish Rectangle, Bearish Rectangle Symmetrical triangle, Head and Shoulders, Inverted Head and Shoulders, Triple top, Triple Bottom, Double Top, Double Bottom) Use historical data to calculate the probability of each pattern to succeed (possibility to filter notification according to the chance of success) gives graphic indication about the invalidation level and
YK-Fibo Pivot Indicator: Trade Smarter with Fibonacci Pivot Points The YK-Fibo Pivot Indicator is a powerful technical analysis tool that combines the precision of Fibonacci retracements with the insights of Pivot Points. Whether you're a novice or seasoned trader, this indicator empowers you to spot profitable opportunities in the market with ease. Why Choose YK-Fibo Pivot? Pinpoint Support & Resistance: By calculating Fibonacci levels based on the previous day's high, low, and close prices, y
Free automatic Fibonacci is an indicator that automatically plots a Fibonacci retracement based on the number of bars you select on the BarsToScan setting in the indicator. The Fibonacci is automatically updated in real time as new highest and lowest values appears amongst the selected bars. You can select which level values to be displayed in the indicator settings. You can also select the color of the levels thus enabling the trader to be able to attach the indicator several times with differe
FREE
DMS Fibo
Diogo Mitsunaga Dos Santos
Fibonacci retracements are trend lines drawn between two significant points, usually between absolute lows and absolute highs, plotted on a chart. Intersecting horizontal lines are placed at the Fibonacci levels. Fibonacci retracements are useful tools that help traders identify support and resistance levels. With the information gathered, they can place orders, identify stop-loss levels, and set price targets. Although useful, traders often use other indicators to make more accurate assessments
Fibonacci Wave Bands Indicator The Fibonacci Wave Bands indicator utilizes Fibonacci ratios to create dynamic bands around a central moving average. These bands are derived from key Fibonacci ratios (typically 38.2%, 50%, 61.8%) and adapt to market volatility, offering insights into potential support and resistance zones. Key Features: Fibonacci Levels: The indicator plots multiple bands above and below a central moving average based on Fibonacci ratios. Dynamic Support and Resistance: Bands ser
Daily Candle Predictor è un indicatore che prevede il prezzo di chiusura di una candela. L'indicatore è destinato principalmente all'uso sui grafici D1. Questo indicatore è adatto sia per il trading forex tradizionale che per il trading di opzioni binarie. L'indicatore può essere utilizzato come sistema di trading autonomo o può fungere da aggiunta al sistema di trading esistente. Questo indicatore analizza la candela corrente, calcolando alcuni fattori di forza all'interno del corpo della cande
Introduction It is common practice for professional trades to hide their stop loss / take profit from their brokers. Either from keeping their strategy to the themselves or from the fear that their broker works against them. Using this indicator, the stop loss / take profit points will be drawn on the product chart using the bid price. So, you can see exactly when the price is hit and close it manually.  Usage Once attached to the chart, the indicator scans the open orders to attach lines for t
Introducing the "Magic Trades" for MetaTrader 4 – your ultimate tool for precision trading in dynamic markets. This innovative indicator revolutionizes the way you perceive market trends by harnessing the power of advanced analysis to detect subtle changes in character, paving the way for optimal trading opportunities. The Magic Trades Indicator is designed to empower traders with insightful entry points and well-defined risk management levels. Through its sophisticated algorithm, this indicato
OB Scanner
Suriya Thammalungka
OB Scanner Indicator — Overview OB Scanner is an enhanced Support & Resistance + Supply & Demand indicator designed to help traders identify where institutions and smart money are placing orders. It scans the chart for: 1. Order Blocks (Improved Demand & Supply Zones) Automatically detects Bullish Order Blocks (Demand) Automatically detects Bearish Order Blocks (Supply) Marks high-probability reversal zones Filters out weak OBs with volume and break-of-structure (BOS) confirmation 2. Buyer
VR Cub
Vladimir Pastushak
VR Cub è un indicatore per ottenere punti di ingresso di alta qualità. L'indicatore è stato sviluppato per facilitare i calcoli matematici e semplificare la ricerca dei punti di ingresso in una posizione. La strategia di trading per la quale è stato scritto l'indicatore ha dimostrato la sua efficacia per molti anni. La semplicità della strategia di trading è il suo grande vantaggio, che consente anche ai trader alle prime armi di commerciare con successo con essa. VR Cub calcola i punti di apert
"Dynamic Scalping Oscillator" - è un indicatore Crypto_Forex personalizzato avanzato - uno strumento di trading efficiente per MT4! - Nuova generazione di oscillatori - guarda le immagini per vedere come usarlo. - L'oscillatore Dynamic Scalping ha zone di ipervenduto/ipercomprato adattive. - L'oscillatore è uno strumento ausiliario per trovare punti di ingresso esatti dalle aree dinamiche di ipervenduto/ipercomprato. - Valori di ipervenduto: sotto la linea verde, valori di ipercomprato: sopra l
Alpha Trend sign has been a very popular trading tool in our company for a long time. It can verify our trading system and clearly indicate trading signals, and the signals will not drift. Main functions: Based on the market display of active areas, indicators can be used to intuitively determine whether the current market trend belongs to a trend market or a volatile market. And enter the market according to the indicator arrows, with green arrows indicating buy and red arrows indicating se
Gli utenti di questo prodotto hanno anche acquistato
Neuro Poseidon MT4
Daria Rezueva
4.94 (35)
Neuro Poseidon is a new indicator by Daria Rezueva. It combines precise trading signals with adaptive TP/SL levels - creating best possible trades as a result! Message me and get  Neuro Poseidon Assistant  as a gift to automize your trading process! What makes it stand out? 1. Proven profitability on all assets and timeframes 2. Only confirmed BUY and SELL signals present on the chart 3. Adaptive TP & SL levels generated by the software for each trade 4. Easy to understand - suitable for all
Gann Made Easy
Oleg Rodin
4.84 (165)
Gann Made Easy è un sistema di trading Forex professionale e facile da usare che si basa sui migliori principi del trading utilizzando la teoria di mr. WD Gann. L'indicatore fornisce segnali ACQUISTA e VENDI accurati, inclusi i livelli di Stop Loss e Take Profit. Puoi fare trading anche in movimento utilizzando le notifiche PUSH. CONTATTAMI DOPO L'ACQUISTO PER RICEVERE GRATUITAMENTE LE ISTRUZIONI DI TRADING E OTTIMI INDICATORI EXTRA! Probabilmente hai già sentito parlare molte volte dei metodi d
Trend Catcher ind
Ramil Minniakhmetov
5 (2)
INDICATORE TREND CATCHER L'indicatore Trend Catcher analizza i movimenti dei prezzi di mercato, utilizzando una combinazione di indicatori di analisi del trend proprietari dell'autore e personalizzati. Identifica la vera direzione del mercato filtrando il rumore a breve termine e concentrandosi sulla forza del momentum sottostante, sull'espansione della volatilità e sul comportamento della struttura dei prezzi. Utilizza inoltre una combinazione di indicatori personalizzati di smoothing e filtr
M1 Sniper
Oleg Rodin
5 (24)
M1 SNIPER è un sistema di indicatori di trading facile da usare. Si tratta di un indicatore a freccia progettato per l'intervallo temporale M1. L'indicatore può essere utilizzato come sistema autonomo per lo scalping sull'intervallo temporale M1 e come parte del tuo sistema di trading esistente. Sebbene questo sistema di trading sia stato progettato specificamente per il trading sull'intervallo temporale M1, può comunque essere utilizzato anche con altri intervalli temporali. Inizialmente ho pro
Advanced Supply Demand
Bernhard Schweigert
4.91 (300)
Speciale Trading- SCONTO DEL 30% La soluzione migliore per qualsiasi trader principiante o esperto! Questo indicatore è uno strumento di trading unico, di alta qualità e conveniente, perché abbiamo incorporato una serie di funzionalità proprietarie e una nuova formula. Con questo aggiornamento, potrai visualizzare doppie zone di timeframe. Non solo potrai visualizzare un TF più alto, ma anche entrambi, il TF del grafico e il TF più alto: MOSTRA ZONE ANNIDATE. Tutti i trader che operano con Of
Questo indicatore è un indicatore per l'analisi automatica delle onde perfetto per il trading pratico! Caso... Nota:   non sono abituato a usare nomi occidentali per la classificazione delle onde a causa dell'influenza della convenzione di denominazione di Tang Lun (Tang Zhong Shuo Zen), ho chiamato l'onda base come   penna   e la banda dell'onda secondaria come   segmento   At allo stesso tempo, il segmento ha la direzione del trend. La denominazione   è principalmente segmento di trend   (que
Scalper Inside PRO
Alexey Minkov
4.74 (68)
Scalper Inside PRO Scalper Inside PRO is an intraday trend and scalping indicator for MetaTrader 4 that uses an exclusive algorithm to quickly detect market direction and key target levels. It automatically calculates entry, exit and multiple profit targets, and shows detailed performance statistics so you can see how different instruments and strategies performed. This helps you choose the most suitable trading instruments for the current market conditions. Additionally, you can easily integrat
Breakout Arrows Mt4
Michael Oko Oboh
5 (1)
Trend Breakout Arrows Indicator The Trend Breakout Arrows Indicator is a momentum-based signal tool designed to identify potential bullish and bearish breakout opportunities. It displays clear arrow signals directly on the price chart, helping traders quickly recognize possible trend changes and continuation setups. Up Arrow (Buy Signal) A magenta up arrow appears below a candle when bullish momentum begins to strengthen. This signal indicates that buying pressure may be overtaking selling press
Current event:  https://c.mql5.com/1/326/A2SR2025_NoMusic.gif R. Cos'è l'A2SR ?   * È un indicatore tecnico leader (nessuna riverniciatura, nessun ritardo). -- Guida : -- su https://www.mql5.com/en/blogs/post/734748/page4#comment_16532516 -- e https://www.mql5.com/en/users/yohana/blog A2SR ha una tecnica speciale per determinare i livelli di supporto (domanda) e resistenza (offerta). A differenza del modo ordinario che abbiamo visto in rete, A2SR ha un concetto originale nel determinare i li
MetaBands M4
Vahidreza Heidar Gholami
3.5 (6)
MetaBands uses powerful and unique algorithms to draw channels and detect trends so that it can provide traders with potential points for entering and exiting trades. It’s a channel indicator plus a powerful trend indicator. It includes different types of channels which can be merged to create new channels simply by using the input parameters. MetaBands uses all types of alerts to notify users about market events. Features Supports most of the channel algorithms Powerful trend detection algorith
Genesis Matrix Pro is a professional multi-timeframe trend detection indicator designed to help traders identify high-quality market alignment with clarity and structure. It combines 12 different technical indicators into one visual alignment matrix, allowing traders to quickly see when market conditions are bullish, bearish, or neutral. A signal is generated only when the selected strategies are aligned, helping reduce noise and improve decision-making. PLEASE CONTACT ME AFTER PURCHASE TO GET
Questo prodotto è stato aggiornato per il mercato 2026 e ottimizzato per le ultime build di MT5. AVVISO DI AGGIORNAMENTO PREZZO: Smart Trend Trading System è attualmente disponibile a $99 . Il prezzo aumenterà a $199 dopo i prossimi 30 acquisti . OFFERTA SPECIALE: Dopo aver acquistato Smart Trend Trading System, inviami un messaggio privato per ricevere Smart Universal EA GRATIS e trasformare i tuoi segnali Smart Trend in operazioni automatiche. Smart Trend Trading System è un sistema di tradin
Dynamic Forex28 Navigator
Bernhard Schweigert
4.43 (7)
Dynamic Forex28 Navigator - Lo strumento di trading Forex di nuova generazione. ATTUALMENTE SCONTATO DEL 49%. Dynamic Forex28 Navigator è l'evoluzione dei nostri indicatori popolari di lunga data, che combinano la potenza di tre in uno: Advanced Currency Strength28 Indicator (695 recensioni) + Advanced Currency IMPULSE con ALERT (520 recensioni) + CS28 Combo Signals (Bonus). Dettagli sull'indicatore https://www.mql5.com/en/blogs/post/758844 Cosa offre l'indicatore di forza di nuova generazione?
BTMM State Engine Pro is a MetaTrader 4 indicator for traders who use the Beat The Market Maker approach: Asian session context, kill zone timing, level progression, peak formation detection, and a multi-pair scanner from a single chart. It combines cycle state logic with a built-in scanner dashboard so you do not need the same tool on many charts at once. What it does Draws the Asian session range; session times can follow broker server offset or be set in inputs. Tracks level progression (L
IQ FX Gann Levels a precision trading indicator based on W.D. Gann’s square root methods . It plots real-time, non-repainting support and resistance levels to help traders confidently spot intraday and scalping opportunities with high accuracy. William Delbert Gann (W.D. Gann) was an exceptional market analyst, whose trading technique was based on a complex blend of mathematics, geometry, astrology, and ancient mathematics which proved to be extremely accurate. Setup & Guide:  Download  MT5 Ver
PRO Renko System
Oleg Rodin
5 (30)
PRO Renko System è un sistema di trading altamente accurato appositamente progettato per il trading di grafici RENKO. Questo è un sistema universale che può essere applicato a vari strumenti di trading. Il sistema neutralizza efficacemente il cosiddetto rumore di mercato che consente di accedere a segnali di inversione accurati. L'indicatore è molto facile da usare e ha un solo parametro responsabile della generazione del segnale. Puoi facilmente adattare lo strumento a qualsiasi strumento di
Neo Wave PRO
Nikolay Raykov
5 (1)
Price & Time Market Structure Indicator A professional market structure tool that analyzes waves through both price and time — not price alone. Main Description NeoWave PRO is a professional market structure indicator for MetaTrader 4 designed for traders who want to move beyond traditional one-dimensional wave tools such as ZigZag, swing indicators, and basic high/low systems. Most wave indicators analyze only one thing: Price. But a real market wave is not only a price movement. A true wave de
GOLD Impulse with Alert
Bernhard Schweigert
4.67 (12)
Questo indicatore è una super combinazione dei nostri 2 prodotti Advanced Currency IMPULSE with ALERT  +   Currency Strength Exotics . Funziona per tutti i time frame e mostra graficamente l'impulso di forza o debolezza per le 8 valute principali più un simbolo! Questo indicatore è specializzato nel mostrare l'accelerazione della forza delle valute per qualsiasi simbolo come oro, coppie esotiche, materie prime, indici o futures. Primo nel suo genere, qualsiasi simbolo può essere aggiunto all
Market Structure Order Block Dashboard MT4 è un indicatore MetaTrader 4 progettato per i trader che vogliono leggere la struttura di mercato e le principali zone di reazione del prezzo direttamente sul grafico. Combina BOS, ChoCH, Order Blocks, Fair Value Gaps (FVG), Liquidità, Kill Zones, Volume Profile e una dashboard compatta per un'analisi rapida. Questo indicatore è destinato ai trader che utilizzano la struttura di mercato, i concetti ICT e Smart Money come quadro decisionale. Può aiutare
È disponibile anche la versione MT5 https://www.mql5.com/it/market/product/170916 Versione Swing M30/H1/H4 disponibile Vuoi catturare i grandi movimenti? Gold Signal Swing Pro (M30/H1/H4). Obiettivo: $20-$80+ per trade. https://www.mql5.com/en/market/product/177643 KURAMA GOLD SIGNAL PRO (MT4) — Sistema di Trading XAUUSD Completo con Filtro a 7 Strati, TP/SL Automatico e Punteggio di Qualità NESSUN REPAINT. NESSUN RI
PZ 123 Pattern
PZ TRADING SLU
1 (1)
Unlock powerful breakout opportunities The 123 Pattern is one of the most popular, powerful and flexible chart patterns. The pattern is made up of three price points: a bottom, a peak or valley, and a Fibonacci retracement between 38.2% and 71.8%. A pattern is considered valid when the price breaks beyond the last peak or valley, moment at which the indicator plots an arrow, rises an alert, and the trade can be placed. [ Installation Guide | Update Guide | Troubleshooting | FAQ | All Products  ]
Enigmera
Ivan Stefanov
5 (8)
ENIGMERA: Il cuore del mercato Importante: La demo di MQL5.com funziona nel Strategy Tester e potrebbe non riflettere completamente le funzionalità di Enigmera. Consulta la descrizione, gli screenshot e il video per maggiori dettagli. Non esitare a inviarmi un messaggio se hai domande! Il codice dell'indicatore è stato completamente riscritto. La versione 3.0 aggiunge nuove funzionalità e corregge i bug accumulati dall'inizio dell'indicatore. Introduzione Questo indicatore e sistema di trading
Introduction Harmonic Patterns are best used to predict potential turning point. Traditionally, Harmonic Pattern was identified manually connecting peaks and troughs points in the chart. Manual harmonic pattern detection is painfully tedious and not suitable for everyone. You are often exposed under subjective pattern identification with manual pattern detection. To avoid these limitations, Harmonic Pattern Plus was designed to automate your harmonic pattern detection process. The functionality
Il rilevatore di terremoti del mercato  del sismografo. Description in English : https://www.mql5.com/en/market/product/113869?source=Site+Market+Product+Page#description How to use the Seismograph : https://www.mql5.com/en/market/product/113869#!tab=comments&page=2&comment=52806941 Create an EA : https://www.mql5.com/en/market/product/113869#!tab=comments&page=3&comment=52816509 Qualunque sia il modo in cui fai trading, vuoi assolutamente evitare di entrare nel mercato a bassa liquidità.
Scalper Vault
Oleg Rodin
5 (37)
Scalper Vault è un sistema di scalping professionale che ti fornisce tutto il necessario per scalping di successo. Questo indicatore è un sistema di trading completo che può essere utilizzato dai trader di forex e opzioni binarie. L'intervallo di tempo consigliato è M5. Il sistema fornisce segnali di freccia accurati nella direzione della tendenza. Ti fornisce anche i segnali più alti e più bassi e i livelli di mercato di Gann. Gli indicatori forniscono tutti i tipi di avvisi, comprese le notifi
Delta Fusion Pro
Francesco Secchi
5 (2)
Delta Fusion Pro – Analisi Avanzata del Flusso Ordini per il Trading Intraday Delta Fusion Pro è un indicatore professionale per MetaTrader 4 che rivela il flusso degli ordini aggressivi, mostrando in tempo reale l’intensità e la direzione della pressione istituzionale. A differenza dei classici indicatori volumetrici, analizza la differenza (delta) tra i volumi Ask e Bid per anticipare inversioni, confermare trend e individuare zone di interesse professionale. Caratteristiche Principali Siste
Trend Lines PRO
Roman Podpora
5 (1)
LINEE DI TENDENZA PRO       Aiuta a capire dove il mercato sta realmente cambiando direzione. L'indicatore mostra reali inversioni di tendenza e punti in cui i principali attori rientrano. Vedi  Linee BOS   Cambiamenti di tendenza e livelli chiave su timeframe più ampi, senza impostazioni complesse o rumore inutile. I segnali non vengono ridisegnati e rimangono sul grafico dopo la chiusura della barra. VERSIONE MT 5     -      Svela il suo massimo potenziale se abbinato all'indicatore   RFI LEVE
The Propfolio Master Suite is the ultimate all-in-one analytical workstation for professional traders. Combining the power of the Beat The Market Maker (BTMM) methodology, Smart Money Concepts (SND/Liquidity), and Advanced Volume Profile, this suite replaces multiple different indicators with one optimized engine. Monitor up to 14 pairs simultaneously from a single chart, instantly identify market cycles, and seamlessly map institutional footprints with the click of a button. The Command Center
RFI levels PRO
Roman Podpora
5 (1)
L'indicatore mostra accuratamente i punti di inversione e le zone di ritorno dei prezzi in cui il       Principali attori   . Vedi dove si formano le nuove tendenze e prendi decisioni con la massima precisione, mantenendo il controllo su ogni operazione. VERSION MT5     -     Rivela il suo massimo potenziale se combinato con l'indicatore   TREND LINES PRO Cosa mostra l'indicatore: Strutture di inversione e livelli di inversione con attivazione all'inizio di un nuovo trend. Visualizzazione dei l
ATTUALMENTE SCONTATO DEL 40%! La soluzione migliore per ogni principiante o trader esperto! Questo indicatore è uno strumento di trading unico, di alta qualità e conveniente perché abbiamo incorporato una serie di caratteristiche proprietarie e una formula segreta. Con un solo grafico fornisce avvisi per tutte le 28 coppie di valute. Immaginate come migliorerà il vostro trading perché sarete in grado di individuare l'esatto punto di innesco di una nuova tendenza o opportunità di scalping! Co
Altri dall’autore
MA Ribbon Flow MT5
Komang Putra Riswanjaya
MA Ribbon Flow MA Ribbon Flow is a trend visualization indicator that combines 20 Moving Averages into a single ribbon-like structure. The purpose of this indicator is to help traders validate whether a trend has truly changed direction or if the market is only experiencing temporary pullbacks or noise. By observing the flow, alignment, and spacing between the MA ribbons, traders can identify: Trend strength Trend continuation Potential reversals Momentum expansion and weakening The indicator
FREE
Iceberg Divergen Indicator
Komang Putra Riswanjaya
5 (3)
Iceberg Divergence Indicator will help traders to find divergent patterns that occur on the charts very easily and simply This indicator will visualize divergences pattern that occur on the chart by combining it with an awesome oscillator indicator Key Features Easy to use : The Iceberg divergent indicator is made as simple as possible so that it is easy to use Pattern Visualization : Divergent patterns will be visualized on the live chart Precision : The indicator detects divergent patterns wi
FREE
Iceberg Divergen MT5
Komang Putra Riswanjaya
3.5 (2)
Iceberg Divergen Indicator Uncover the hidden opportunities beneath the surface. Overview Divergences in the Awesome Oscillator (AO) often signal powerful market reversals, yet spotting them manually can be challenging and time-consuming. Missing out on these opportunities can cost traders valuable entry points. That’s why we created the   Iceberg Divergence Indicator   — a powerful tool that precisely detects both regular and hidden divergences in AO. With Iceberg Divergence, you won’t just id
FREE
Stochastic Divergen MT5
Komang Putra Riswanjaya
2 (1)
Overview The Stochastic Divergence Indicator is a tool designed to help identify potential market turning points by analyzing divergences between price and the Stochastic Oscillator. It highlights divergence signals visually on the chart, assisting traders in observing possible trend changes. Key Features No Repaint: Once a signal is formed, it remains on the chart. Adjustable Parameters: Settings can be modified to fit different trading preferences and timeframes. Visual Display: Arrows are plo
MA Ribbon Flow MT4
Komang Putra Riswanjaya
MA Ribbon Flow MA Ribbon Flow is a trend visualization indicator that combines 20 Moving Averages into a single ribbon-like structure. The purpose of this indicator is to help traders validate whether a trend has truly changed direction or if the market is only experiencing temporary pullbacks or noise. By observing the flow, alignment, and spacing between the MA ribbons, traders can identify: Trend strength Trend continuation Potential reversals Momentum expansion and weakening The indicator
FREE
Darvas Flow Indicator
Komang Putra Riswanjaya
5 (3)
Darvas Flow Indicator is a revolutionary trading indicator that combines the classic Darvas Box method with modern market flow analysis. Developed for serious traders, Darvas Flow offers a powerful and intuitive tool for identifying trading opportunities. Key Features: Darvas Box Method Implementation: Darvas Flow automatically identifies Darvas boxes, allowing you to see crucial support and resistance levels. This helps in pinpointing optimal entry and exit points in your trades. Dynamic Flow
FREE
MACD Divergen MT5
Komang Putra Riswanjaya
Overview The MACD Divergence Indicator is a powerful tool designed to detect potential trend reversals by analyzing divergences between price action and the MACD (Moving Average Convergence Divergence) indicator. It automatically identifies and highlights bullish and bearish divergence signals directly on the chart, making it easier for traders to spot high-probability trading opportunities. Key Features Customizable Settings: Includes adjustable parameters to suit various trading styles and ti
Candle Pattern Pro MT5
Komang Putra Riswanjaya
Description : In the world of trading, candlestick patterns are a popular technical analysis tool used by many traders.   There are numerous candlestick patterns, ranging from reversal patterns to continuation patterns. However, remembering all these patterns can be challenging, especially for novice traders. This often leads to traders having to manually memorize and identify candlestick patterns, which can be time-consuming and prone to errors. Candle Pattern Pro is a powerful indicator desig
Period Breakout Indicator
Komang Putra Riswanjaya
5 (1)
Overview The Period Breakout Indicator is a versatile tool designed for traders seeking to identify breakout opportunities based on customizable time periods. This indicator automatically determines the highest and lowest prices within a user-defined period, allowing you to tailor it precisely to your trading strategy. Key Features Customizable Time Periods: Define the start and end times based on your preferred trading hours or any specific period. The indicator will then calculate the highest
FREE
Awesome Pivot Indicator
Komang Putra Riswanjaya
The Pivot Indicator is a vital tool for technical analysis used by traders in the financial markets. Designed to assist in identifying potential reversal points or trend changes, this indicator provides valuable insights into key levels in the market. Key features of the Pivot Indicator include: Automatic Calculations: The Pivot Indicator automatically calculates Pivot Point, Support, and Resistance levels based on the previous period's high, low, and close prices. This eliminates the complexity
FREE
Overview The Period Breakout Indicator is a versatile tool designed for traders seeking to identify breakout opportunities based on customizable time periods. This indicator automatically determines the highest and lowest prices within a user-defined period, allowing you to tailor it precisely to your trading strategy. Key Features Customizable Time Periods:   Define the start and end times based on your preferred trading hours or any specific period. The indicator will then calculate the highes
FREE
The Pivot Indicator is a vital tool for technical analysis used by traders in the financial markets. Designed to assist in identifying potential reversal points or trend changes, this indicator provides valuable insights into key levels in the market. Key features of the Pivot Indicator include: Automatic Calculations: The Pivot Indicator automatically calculates Pivot Point, Support, and Resistance levels based on the previous period's high, low, and close prices. This eliminates the complexity
FREE
Awesome MACD Indicator
Komang Putra Riswanjaya
5 (1)
AWESOME MACD INDICATOR Awesome MACD Indicator is a powerful trading tool that combines the strengths of Moving Average (MA) and Moving Average Convergence Divergence (MACD) to provide accurate and reliable trading signals. Designed for forex and stock traders, this indicator simplifies the identification of trading opportunities by detecting significant crosses in price movements. Key Features: MA and MACD Combination: Awesome MACD leverages the power of Moving Averages (MA) to identify short-te
FREE
Darvas Flow
Komang Putra Riswanjaya
5 (1)
Darvas Flow Indicator is a revolutionary trading indicator that combines the classic Darvas Box method with modern market flow analysis. Developed for serious traders, Darvas Flow offers a powerful and intuitive tool for identifying trading opportunities. Key Features Darvas Box Method Implementation : Darvas Flow automatically identifies Darvas boxes, allowing you to see crucial support and resistance levels. This helps in pinpointing optimal entry and exit points in your trades. Dynamic Flow
FREE
Awesome Moving Average
Komang Putra Riswanjaya
Overview Discover a powerful yet simple indicator to identify market trends effectively!  Awesome Moving Average (AWMA)  is designed to detect bullish or bearish trends by analyzing price breakouts beyond the moving average line. Basically, the way this indicator works is similar to the Moving Average indicator available on the MetaTrader platform. As we know, the Moving Average indicator tends to be difficult to use when the market is in a sideways condition because it often gives false breakou
FREE
Stochastic Divergen MT4
Komang Putra Riswanjaya
Overview The Stochastic Divergence Indicator is a tool designed to help identify potential market turning points by analyzing divergences between price and the Stochastic Oscillator. It highlights divergence signals visually on the chart, assisting traders in observing possible trend changes. Key Features No Repaint: Once a signal is formed, it remains on the chart. Adjustable Parameters: Settings can be modified to fit different trading preferences and timeframes. Visual Display: Arrows are pl
Sideway Box Indicator
Komang Putra Riswanjaya
Sideway Box Indicator The Sideway Box Indicator is an advanced trading tool designed to help traders identify and capitalize on sideways market conditions. This powerful indicator detects periods when the market is in a sideways (ranging) phase, providing traders with clear visual cues. Key Features: Sideways Market Detection : The Sideway Box Indicator accurately identifies sideways market conditions, allowing traders to recognize when the price is consolidating within a specific range. Buy/Sel
Candle Pattern Pro
Komang Putra Riswanjaya
Description : In the world of trading, candlestick patterns are a popular technical analysis tool used by many traders.   There are numerous candlestick patterns, ranging from reversal patterns to continuation patterns. However, remembering all these patterns can be challenging, especially for novice traders. This often leads to traders having to manually memorize and identify candlestick patterns, which can be time-consuming and prone to errors. Candle Pattern Pro is a powerful indicator design
QQE Divergen MT4
Komang Putra Riswanjaya
QQE Divergen – Advanced Trading Indicator Overview The  QQE (Quantitative Qualitative Estimation)  indicator is a powerful trading tool designed to enhance trend detection and market momentum analysis. QQE is an advanced version of the RSI (Relative Strength Index) that utilizes  smoothed moving averages  and  dynamic trailing levels  to generate highly accurate signals. QQE Divergen  improves upon the traditional QQE by integrating divergence detection, making it even more effective for identi
MACD Divergen MT4
Komang Putra Riswanjaya
Overview The MACD Divergence Indicator is a powerful tool designed to detect potential trend reversals by analyzing divergences between price action and the MACD (Moving Average Convergence Divergence) indicator. It automatically identifies and highlights bullish and bearish divergence signals directly on the chart, making it easier for traders to spot high-probability trading opportunities. Key Features Customizable Settings: Includes adjustable parameters to suit various trading styles and tim
SidewayBox MT5
Komang Putra Riswanjaya
Sideway Box Indicator The Sideway Box Indicator is an advanced trading tool designed to help traders identify and capitalize on sideways market conditions. This powerful indicator detects periods when the market is in a sideways (ranging) phase, providing traders with clear visual cues. Key Features Sideways Market Detection : The Sideway Box Indicator accurately identifies sideways market conditions, allowing traders to recognize when the price is consolidating within a specific range. Buy/Sel
QQE Divergen MT5
Komang Putra Riswanjaya
QQE Divergen – Advanced Trading Indicator Overview The  QQE (Quantitative Qualitative Estimation)  indicator is a powerful trading tool designed to enhance trend detection and market momentum analysis. QQE is an advanced version of the RSI (Relative Strength Index) that utilizes  smoothed moving averages  and  dynamic trailing levels  to generate highly accurate signals. QQE Divergen  improves upon the traditional QQE by integrating divergence detection, making it even more effective for identif
SMS | Simple Market Structure Simple Market Structure is an indicator designed to represent market structure in a simple, clean, and easy-to-understand way. Many market structure indicators available today are overly complicated and filled with unnecessary visuals, making them difficult to understand — especially for traders who want to quickly identify market direction and structure. That is why this indicator was created. This indicator focuses only on the essential components: Bullish/Bearis
BB Trend Structure MT5
Komang Putra Riswanjaya
BB Trend Structure BB Trend Structure is a trend-following indicator built using a modified Bollinger Band concept to provide cleaner, more stable, and more consistent trend detection. Unlike traditional Bollinger Bands that rely heavily on the middle band movement, this indicator focuses primarily on the Upper Band and Lower Band structure.   This approach allows the trend line to remain smoother and more consistent, making trend direction easier to read and less noisy during market fluctuati
Renko Flow MT5
Komang Putra Riswanjaya
Renko Flow Are you a trader who loves using Renko charts? Unfortunately, MetaTrader does not provide an easy built-in way to display Renko charts directly. That’s why Renko Flow was created — to give traders a simple and practical way to use Renko-style visualization without needing complicated external tools or offline charts. Renko Flow can visualize Renko charts directly inside a separate window, allowing you to analyze Renko movement while still keeping your original price chart clean and
Filtro:
Nessuna recensione
Rispondi alla recensione