DuhokTrend

How to Add a Product Description (MetaTrader Market)

To add the product description effectively in MetaTrader's Market, follow these steps:

1. Log into the MetaTrader Market:

  • Go to your MQL5 account.
  • Navigate to the "Seller's Dashboard" or "Products" section.
  • Select your product, DuhokTrend.

2. Writing the Description:

To enhance the product's rating, write a detailed and structured description:

Template for Product Description:


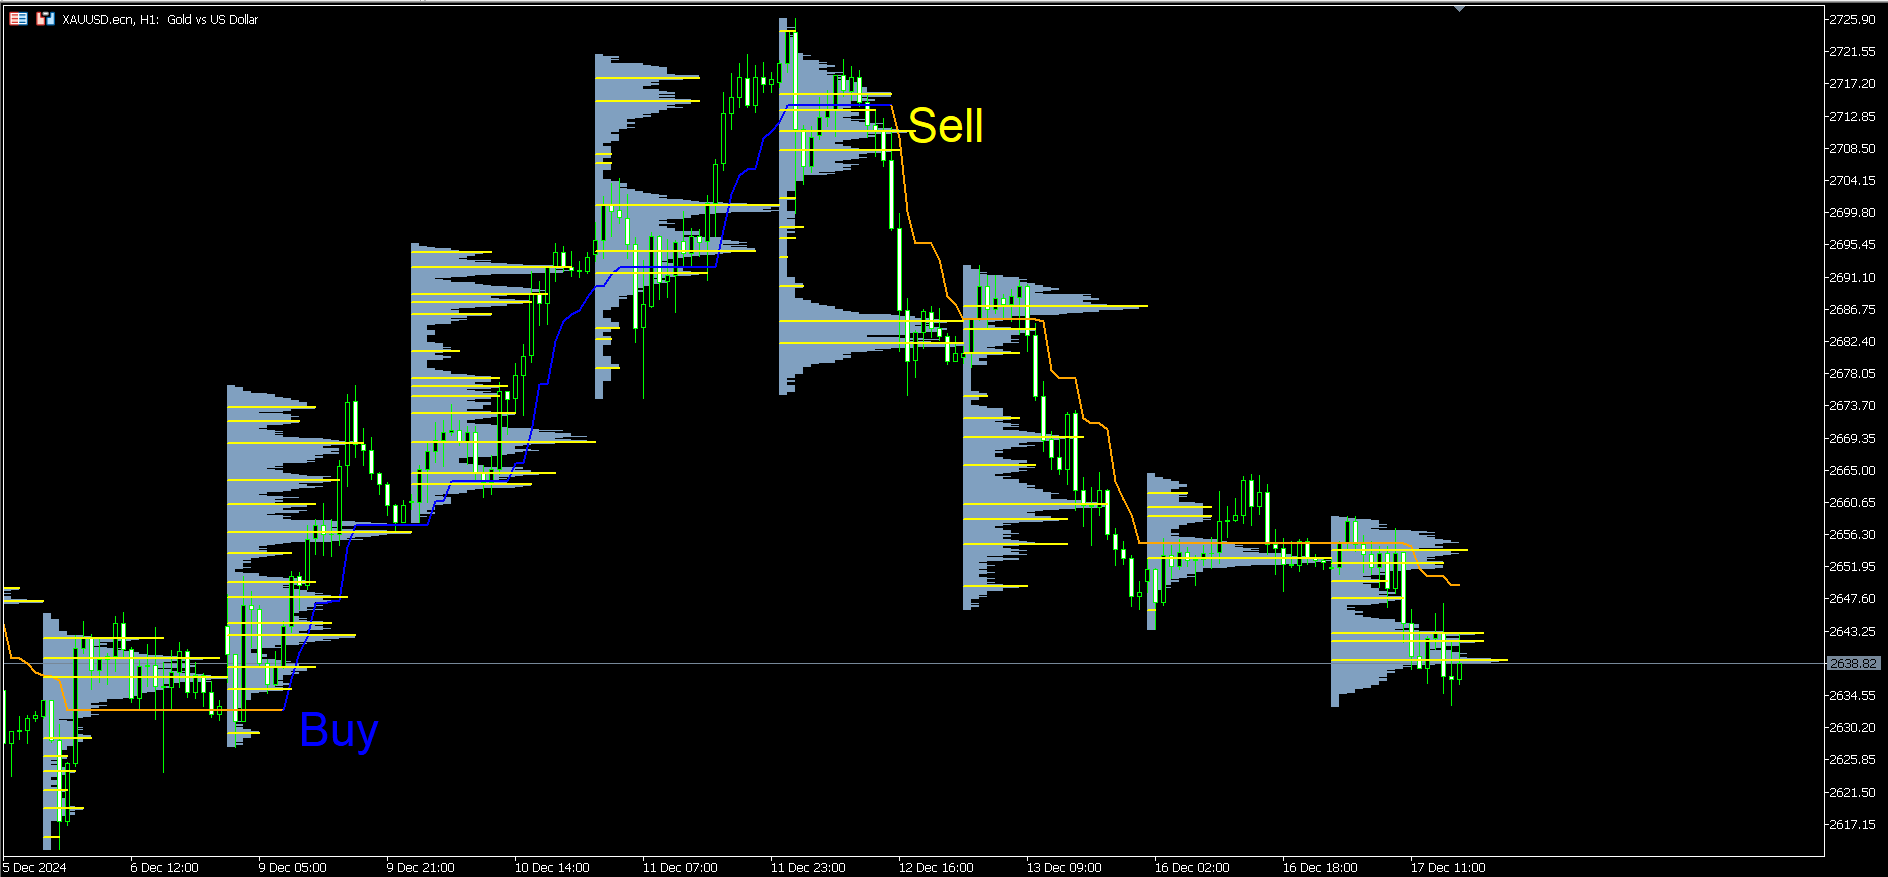
DuhokTrend - Advanced Indicator for Trend Analysis

Overview:
DuhokTrend is a powerful and reliable indicator designed to help traders identify market trends and make informed trading decisions. Built with simplicity and precision, it suits traders of all experience levels.


Key Features:

  • Accurate Trend Detection: Detects upward and downward trends using advanced algorithms.
  • Customizable Settings: Adjust parameters such as period, time shifts, and visualization options.
  • Clear Visual Representation: Trend lines and histogram make it easy to interpret market conditions.
  • Multi-Timeframe Support: Analyze trends across different timeframes (M1 to MN1).
  • Lightweight and Fast: Optimized to work smoothly without overloading your terminal.

Advantages:

  1. User-Friendly: Designed for easy setup and use.
  2. Improved Accuracy: Combines ATR and CCI calculations for enhanced signals.
  3. Flexible Settings: Configure colors, bar styles, and levels to suit your trading style.
  4. Reliable Signals: Reduces false signals through trend smoothing and filtering.

How to Use:

  1. Attach the DuhokTrend indicator to your chart.
  2. Configure the input parameters as per your trading strategy.
  3. Use the trend lines and histogram to identify buy/sell opportunities.

Example:

  • Upward Trend: Orange and blue histogram bars indicate a rising market.
  • Downward Trend: The indicator shows a downward curve with dark-colored bars.

Who Should Use This Indicator?

  • Beginner traders looking for simple trend analysis.
  • Advanced traders requiring accurate multi-timeframe analysis.
  • Scalpers and long-term traders.

DuhokTrend helps you stay ahead of the market by delivering clear and actionable trend signals. Take your trading to the next level!

3. Add the Description to Your Product Page:

  1. Copy the text.
  2. Paste it into the built-in editor under the Product Description section.
  3. Use formatting tools like bold, headers, and tables for clarity.

4. Finalize and Save:

  • Preview the description.
  • Save the changes and submit for review.

This detailed description highlights the advantages and features of your product, ensuring it attracts potential buyers. Let me know if you need further refinements! 🚀


Prodotti consigliati
Orderflow Super Candles - Simple Footprint Chart Indicator Platform: MetaTrader 5 (MT5)  (The last screenshot shows the use of the DOM tool in conjunction with the product.) 1. Product Introduction Orderflow Super Candles is a professional charting tool based on underlying Tick data analysis, designed to provide traders with a deep "X-ray" view of the market. By parsing the buy and sell volume distribution within each candlestick, this indicator visualizes the hidden market microstructure. It
Introduction to Fractal Pattern Scanner Fractal Indicator refers to the technical indicator that makes use of the fractal geometry found in the financial market. Fractal Pattern Scanner is the advanced Fractal Indicator that brings the latest trading technology after the extensive research and development work in the fractal geometry in the financial market. The most important feature in Fractal Pattern Scanner is the ability to measure the turning point probability as well as the trend probabil
The indicator is designed to close positions on the market in time. For example: to take profits ahead of schedule if the price has not reached TakeProfit, and the market is turning around. The indicator analyzes the momentum, not the trend. He does not give any information about the trend. The indicator is well suited for finding divergence. The Ershov 38 Parrots indicator dynamically adjusts to the market and detects price movement impulses of medium and high amplitude. It almost does not rea
Man Trend
Ivan Simonika
Man Trend uses at its core the process of identifying the rate of change in price growth and allows you to find entry and exit points from the market. The indicator was created on the basis of the original indicators for searching for extreme points, the indicator is well suited for determining a reversal or a large sharp jerk to one of the sides, thanks to it you will know when this happens, it will notify you with the appearance of a blue dot to buy red to sell. This is a fundamental techni
Manyal trading system, CovEchoTrend Robot, focuses on reliability and flexibility. By employing statistical analysis methods to study the relationships between the base indicator and market patterns, the system enables a deeper understanding of market processes. Intelligent pattern analysis: The application of statistical data processing helps identify key trend reversal points more accurately, signaling significant market shifts. Informed decision-making is based on the intersection of indicato
Questo indicatore è un indicatore per l'analisi automatica delle onde perfetto per il trading pratico! Caso... Nota:   non sono abituato a usare nomi occidentali per la classificazione delle onde a causa dell'influenza della convenzione di denominazione di Tang Lun (Tang Zhong Shuo Zen), ho chiamato l'onda base come   penna   e la banda dell'onda secondaria come   segmento   At allo stesso tempo, il segmento ha la direzione del trend. La denominazione   è principalmente segmento di trend   (que
XFlow
Maxim Kuznetsov
XFlow shows an expanding price channel that helps determine the trend and the moments of its reversal. It is also used when accompanying transactions to set take profit/stop loss and averages. It has practically no parameters and is very easy to use - just specify an important moment in the history for you and the indicator will calculate the price channel. DISPLAYED LINES ROTATE - a thick solid line. The center of the general price rotation. The price makes wide cyclical movements around the
# SSL ST Strategy MT5 Indicator - Italian Version L'indicatore SSL ST Strategy MT5 è uno strumento di analisi tecnica progettato per aiutare i trader a identificare chiaramente i segnali di acquisto e vendita sul grafico di trading. Offre indicatori visivi come linee e frecce, insieme a notifiche audio, popup e push per avvertire prontamente i trader quando sorge un'opportunità di trading. ## Vantaggi principali - Fornisce chiari segnali visivi direttamente sul grafico utilizzando linee colo
QUANTUM OBSERVATION ENGINE Advanced Market Structure & Dominance Visualization Tool Quantum Observation Engine is a professional-grade, non-repainting market analysis indicator designed for traders who prefer clarity, structure, and decision control instead of direct buy/sell signals. This tool does NOT give forced trade entries. Instead, it reveals the internal state of the market in real time. WHAT THIS TOOL DOES Quantum Observation Engine con
Never miss a price breakout again with the Price Alert Line Indicator . This tool is designed for traders who need speed and simplicity. Instead of navigating complex menus to set price alerts, the Price Alert Line Indicator  places a button directly on your chart. With a single click, you can deploy a horizontal line that monitors price action and alerts you immediately when the price crosses it. Key Features: - One-Click Deployment: A convenient button allows you to instantly draw or delete t
ROC acceleration-deceleration is the manual system for medium-term scalping. Indicator based on custom ROC system which defines bullish/bearish market and especially  acceleration-deceleration of tendention in the market's main direction. Buy arrow is plotted during bearish market when current trend decelerates and sell  arrow is plotted during bullish market when current trend decelerates. Main Indicator's Features Signals are not repaint,non-late or disappear(exept cases when system recalculat
Impulse fractals indicator - is counter-trend oriented complex market fractal pattern.  Market creates bull/bear impulse, trend starts, fractals on impulsed wave are an agressive pullback signals. Buy arrow is plotted when market is bearish and it's impulse showed up-side fractal, and sell arrow is plotted when market is bullish and it's impulse showed dn-side fractal. Main indicator's adjustable inputs : impulsePeriod - main period of impulse histogram  filterPeriod  - smoothes impulse accordi
Trend Forecaster
Alexey Minkov
5 (7)
The Trend Forecaster indicator utilizes a unique proprietary algorithm to determine entry points for a breakout trading strategy. The indicator identifies price clusters, analyzes price movement near levels, and provides a signal when the price breaks through a level. The Trend Forecaster indicator is suitable for all financial assets, including currencies (Forex), metals, stocks, indices, and cryptocurrencies. You can also adjust the indicator to work on any time frames, although it is recommen
Neuro Future
Sergey Rozhnov
Indicatore di rete neurale       con apprendimento integrato. Si tratta di un vero e proprio sistema di intelligenza artificiale autonomo,   basato su un perceptron personalizzabile multilivello e impostazioni di training avanzate per prevedere le future variazioni di prezzo. È possibile addestrare l'indicatore autonomamente su qualsiasi simbolo finanziario, senza bisogno di conoscenze specifiche di machine learning: tutto ciò di cui si ha bisogno è raccolto in questo strumento e implementato in
If you are unsure how to use this indicator, please feel free to reach out to me. I will explain it to you and provide reading materials to help you make the most of it. TD Sequential Scanner: An Overview The TD Sequential scanner is a powerful technical analysis tool designed to identify potential price exhaustion points and trend reversals in financial markets. Developed by Tom DeMark, this method is widely used by traders to gauge market cycles and potential turning points with precision. Ho
ZIVA TrendX
Hassan Abdullah Hassan Al Balushi
ZIVA TrendX is a professional trend-oriented indicator engineered to provide a clear and structured assessment of market direction through a cloud-based analytical framework. The indicator analyzes price behavior relative to dynamically derived trend boundaries, forming a continuous cloud structure that visually represents the prevailing market bias. This structure enables traders to maintain alignment with dominant directional conditions while filtering short-term market noise. All internal ca
ACB Breakout Arrows Scanner MT5
KEENBASE SOFTWARE SOLUTIONS
Questo è uno scanner multi-simbolo e multi-timeframe per il nostro indicatore ACB Breakout Arrows . Con le impostazioni predefinite, analizza i segnali di acquisto/vendita su 28 coppie di valute e 9 timeframe contemporaneamente .  Caratteristiche Può analizzare 252* combinazioni di simboli e timeframe da un singolo grafico. Apre il grafico del segnale con un modello predefinito con un solo clic.  Facile da spostare ovunque sul grafico tramite drag and drop. Avvisi in tempo reale tramite popup,
ADR/AWR/AMR Lines Indicator - Professional Range Boundary Display Advanced Multi-Timeframe Range Analysis Tool for Professional Traders Overview The ADR/AWR/AMR Lines Indicator is a sophisticated visual analysis tool that displays dynamic range boundaries across multiple timeframes on your chart. This professional-grade indicator calculates and projects Average Daily Range (ADR), Average Weekly Range (AWR), and Average Monthly Range (AMR) boundaries, providing traders with precise entry/exit l
Rocket Trend
Andriy Sydoruk
The Rocket Trend indicator is trending. The indicator draws two-color points connected by lines along the chart. This is a trend indicator, it is an algorithmic indicator. It is easy to work and understand when a blue circle appears, you need to buy, when a red one appears, sell. The indicator is used for scalping and pipsing, and has proven itself well. Rocket Trend is available for analyzing the direction of the trend for a specific period of time. Ideal for novice traders learning the laws o
Linear Trend Predictor : indicatore di tendenza che combina punti di ingresso e linee di supporto direzionale. Funziona secondo il principio di rottura del canale dei prezzi alto/basso. L'algoritmo dell'indicatore filtra il rumore di mercato, tiene conto della volatilità e delle dinamiche di mercato. Capacità dell'indicatore Utilizzando metodi di smoothing, mostra l'andamento del mercato e i punti di ingresso per l'apertura di ordini di ACQUISTO o VENDITA. Adatto per determinare i movimenti d
Skiey
Vitalii Zakharuk
Skiey - Indicator of easy solutions! Using this indicator is very simple, since the simplest is to look at the chart and act according to the color arrows. Such a calculation option takes into account intraday price fluctuations and focuses on measuring the "candlestick" share in the trend. The algorithm takes into account the measurement of prices, this method also emphasizes the measurement of each of the price drops (H / C, H / O, LC, LO) - which gives more detailed information but also mor
The indicator determines a special pattern of Joe Dinapoli. It gives very high probability buy and sell signals. Indicator does not repaint. Indicator Usage Buy Signal ''B'' Entry : Market buy order at signal bar close Stop : Low of signal bar Take Profit : First swing high Sell Signal ''S'' Entry : Market sell order at signal bar close Stop : High of signal bar Take Profit : First swing low Indicator Parameters Fast EMA : External Parameter (should be kept as default) Slow EMA: External Param
L’indicatore Volume Equilibrium mostra i livelli in cui il volume rialzista è uguale al volume ribassista. Può calcolare questi livelli per ogni giorno, settimana, mese e anno. Quando il prezzo si trova sopra la linea, significa che il volume è dalla parte dei compratori e il mercato è rialzista. Quando il prezzo si trova sotto la linea, significa che il volume è dalla parte dei venditori e il mercato è ribassista. L’indicatore utilizza l’algoritmo dell’indicatore “Meravith” per calcolare i live
the fundamental technical indicator Informative Trend, which allows you to assess the current market situation in order to enter the market of the selected currency pair in a trend and with minimal risk. It basically uses the process of identifying the rate of change in price growth and allows you to find entry and exit points from the market. The indicator was created on the basis of the original indicators for searching for extreme points and is well suited for determining a reversal or a la
Ugenesys AI MT5
Odaine Ramon Mcmillan
uGenesys AI - 90% Accurate Daytrading Indicator Introducing the ultimate forex trading indicator system, uGenesys AI, powered by cutting-edge AI technology and advanced analytical techniques, including Time-Series Analysis and Genetic Algorithms. Our AI-powered trading system leverages the power of time-series analysis to identify trends and patterns in historical price data, allowing traders to make informed predictions about future market movements. By analyzing vast amounts of data, our syst
"MACD Ribbon Dynamic PRO: Trasforma la volatilità in trend" Breve descrizione: "Non affidarti a una singola linea. Scopri la profondità del mercato. Un trend follower di nuova generazione ottimizzato per Bitcoin, Oro e Forex, privo di errori di spread." Dettagli del prodotto: Perché MACD Ribbon Dynamic? Gli indicatori standard producono falsi segnali su asset ad alta volatilità come Bitcoin o Oro. MACD Ribbon Dynamic utilizza un algoritmo multistrato per filtrare il rumore di mercato.
A MUST HAVE - NON REPAINT INDICATOR - that will help you to make the decision whether to Buy or Sell , including where to set the Take Profit and Stop Loss . The Buy/Sell signal will not redraw nor repaint until the next new signal occurs. The Take Profit and Stop Loss will change following the market conditions. Our indicator will give alert to your mobile/handphone when new buy/sell signal arrive. For best result, combine this indicator with your knowledge on price action and support & resista
Trend Pulse Pro V2
Wojciech Jerzy Magda
MTF MA Dashboard Pro v1.04 - Analizzatore Professionale di Medie Mobili Multi-Timeframe ​Indicatore tecnico avanzato per MT5 che fornisce un'analisi completa delle medie mobili su più timeframe, con rilevamento intelligente di Golden/Death Cross e dashboard visiva completamente personalizzabile. ​Smetti di passare da un timeframe all'altro! Analizza fino a 4 timeframe contemporaneamente e individua istantaneamente gli allineamenti del trend. ​ CARATTERISTICHE PRINCIPALI ​ ANALISI MULTI-T
L'indicatore aiuta ad entrare in un trade seguendo il trend, allo stesso tempo, dopo alcune correzioni. Trova forti movimenti di tendenza di una coppia di valute su un determinato numero di barre e trova anche livelli di correzione per questa tendenza. Se la tendenza è abbastanza forte e la correzione diventa uguale a quella specificata nei parametri, l'indicatore lo segnala. È possibile impostare diversi valori di correzione, i valori di 38, 50 e 62 (livelli di Fibonacci) sono più adatti. Inol
Connix MT5
Garry James Goodchild
Connix Smart Trading – MT5 Multi-Currency Smart Money & ICT Scanner Connix Smart Trading is a multi-currency, multi-timeframe dashboard for MT5 designed for traders using Smart Money Concepts (SMC) and ICT-style methodologies . It allows you to scan up to 28 symbols simultaneously (anything in Market Watch) and view market structure, order blocks, fair value gaps, VWAP bias, and range data across multiple timeframes from one central dashboard. The number of symbols and all timeframes are fully c
Gli utenti di questo prodotto hanno anche acquistato
AriX
Temirlan Kdyrkhan
1 (4)
AriX Indicator for MT5 A powerful trend-following and signal-evaluation tool AriX is a custom MT5 indicator that combines Moving Averages and ATR-based risk/reward logic to generate clear buy/sell signals. It visualizes dynamic SL/TP levels, evaluates past trade outcomes, and displays win/loss statistics in a clean on-chart panel. Key features include: Buy/Sell signals based on MA crossovers ATR-based SL/TP1/TP2/TP3 levels with visual lines and labels Signal outcome tracking with real-time stat
Ottieni l’indicatore AUX GRATUITO e il supporto EA Download diretto — Clicca qui [ D.I.C.E ] The DICE Indicator  Divergence in Chaos Environment è uno strumento MT5 specializzato per trader che applicano la Teoria delle Onde di Elliott nel contesto delle tecniche di Trading Chaos. Identifica divergenze nascoste e regolari nell’azione dei prezzi, sincronizzate con l’ambiente di mercato caotico descritto da Bill Williams. Caratteristiche principali Divergenza allineata alle Onde di Elliott: rilev
Rtc ML Ai Predictor
Muhammad Faisal Sagala
Rtc ML Ai | Predictor CORE MACHINE LEARNING ENGINE Adaptive ML Market Predictor – Multi-Bar Trend & Candle Forecast What This Indicator Does This indicator is a  real-time market prediction engine  designed to analyze price behavior and estimate  future market tendencies . Unlike conventional indicators, this system  does not rely on static parameters or historical curve-fitting , but adapts its internal state dynamically during live market operation. Instead of using static rules, the indic
VTrende Pro
Andrii Diachenko
5 (1)
VTrende Pro - MTF indicator for trend trading with a display panel for MT5 *** Videos can be translated into any language using subtitles (video language - Russian) Although the signals of the VTrende Pro indicator can be used as signals of a full-fledged trading system, it is recommended to use them in conjunction with the Bill Williams TS. VTrende Pro is an extended version of the VTrende indicator. Difference between Pro version and VTrende: - Time zones - Signal V - signal 1-2 waves -    S
TrendMaestro5
Stefano Frisetti
Attenzione alle truffe, questo indicatore e' distribuito esclusivamente su MQL5.com nota: questo indicatore e' per METATRADER5, se vuoi la versione per  METATRADER4 questo e' il link:   https://www.mql5.com/it/market/product/108106 TRENDMAESTRO ver 2.5 TRENDMAESTRO   riconosce un nuovo TREND sul nascere, non sbaglia mai. La sicurezza di identificare un nuovo TREND non ha prezzo. DESCRIZIONE TRENDMAESTRO identifica un nuovo TREND sul nascere, questo indicatore prende in esame la volatilita' i
FXLAND Smart Reversal Indicator (MT5) FXLAND Smart Reversal Indicator is a professional technical analysis tool designed to help traders identify potential price reversal zones and key market turning points with clarity and precision. The best reversal indicator and price return by choosing only one ceiling or floor in each time frame A masterpiece of combining mathematics and Gann, fractal matrix, Fibonacci, movement angle and time. Completely intelligent Key Features Detects potenti
Pantera Indicator
Temirlan Kdyrkhan
5 (1)
A tool for on-chart strategy backtesting and performance analysis. A utility for developing, debugging, and testing custom trading ideas and indicator functions. An indicator designed to quickly test trading concepts and visualize the effectiveness of different input parameters. An all-in-one sandbox for testing everything from simple crossovers to complex, multi-condition trading systems.
UZFX {SSS} Scalping Smart Signals MT5 è un indicatore di trading ad alte prestazioni non ridipinto progettato per scalper, day trader e swing trader che richiedono segnali accurati e in tempo reale in mercati in rapida evoluzione. Sviluppato da (UZFX-LABS), questo indicatore combina l'analisi dell'andamento dei prezzi, la conferma del trend e il filtraggio intelligente per generare segnali di acquisto e vendita ad alta probabilità su tutte le coppie di valute e tutti i timeframe. Caratteristich
Hello I Want to introduce The Forex Buy Sell Arrow Premium MT5 i recently release this premium indicator! its 1000% Non Repaint Indicator, It Work Perfectly Well,, i tested it day by day, Just mind blowing Result,  Including Powerful trend Algorithm! How It Work? well, it work market trend formula, when trend Bullish Or when trend Bearish,  Recommend Timeframe M30, H1 it work all timeframe, and all currency pair, 100% non repaint, How to take signal From Forex Buy Sell Arrow Premium Ind
WanaScalper
Isaac Wanasolo
1 (1)
A scalping indicator based on mathematical patterns, which on average gives signals with relatively small SL, and also occasionally helps to catch big moves in the markets (more information in the video) This indicator has three main types of notifications: The first type warns of a possible/upcoming signal on the next bar The second type indicates the presence of a ready signal to enter the market/open a position The third type is for SL and TP levels - you will be notified every time price re
##   ONLY GOLD ##   Тiльки Золото ## **Mercaria Professional Trading Zones - Complete Guide** ## **Mercaria Professional Trading Zones - Повний посібник** ### **How Mercaria Zones Work / Як працюють зони Mercaria** **English:** Mercaria Zones is an advanced trading indicator that identifies high-probability support and resistance areas using ZigZag extremes combined with mathematical zone calculations. The indicator works on multiple timeframes simultaneously, providing a comprehensive view
Scalping Winning Signals Pro SWS
Muhammad Usman Siddique
5 (1)
UZFX SWS {Scalping Winning Signals} Pro v1.0 è un potente indicatore non ridipingente sviluppato da Usman Zabir (UZFX LABS) appositamente per scalper, day trader e swing trader alla ricerca di segnali di ingresso precisi in mercati in rapido movimento. Ideale per i trader che richiedono segnali affidabili e in tempo reale senza ritardi o false ridipinture. I MIEI INTERVALLI DI TEMPO CONSIGLIATI*: 30 M E OLTRE. {1H} È IL MIO PREFERITO. E I RISULTATI SONO SORPRENDENTI...! Le caratteristiche prin
Enigma 112
issam rahhal sabour
Enigma 112 Indicator - User Manual Enigma 112 Indicator Complete User Manual - Ultimate Trading Solution Introduction The Enigma 112 is a comprehensive multi-timeframe trading indicator that combines advanced technical analysis concepts including Tesla 3-6-9 Gates, Huddleston Theory, PO3 Dealing Ranges, and sophisticated risk management systems. Tesla 3-6-9 Gates Based on Nikola Tesla's vortex mathematics for precise support and resistance levels Huddleston Theory Volume-based market
The Expert Advisor and the video are attached in the Discussion tab . The robot applies only one order and strictly follows the signals to evaluate the indicator efficiency. Pan PrizMA CD Phase is an option based on the Pan PrizMA indicator. Details (in Russian). Averaging by a quadric-quartic polynomial increases the smoothness of lines, adds momentum and rhythm. Extrapolation by the sinusoid function near a constant allows adjusting the delay or lead of signals. The value of the phase - wave s
Классификатор силы тренда. Показания на истории не меняет. Изменяется классификация только незакрытого бара. По идее подобен полной системе ASCTrend, сигнальный модуль которой, точнее его аппроксимация в несколько "урезанном" виде, есть в свободном доступе, а также в терминале как сигнальный индикатор SilverTrend . Точной копией системы ASCTrend не является. Работает на всех инструментах и всех временных диапазонах. Индикатор использует несколько некоррелируемых между собой алгоритмов для класси
FFx Universal Strength Meter PRO is more than a basic strength meter. Instead of limiting the calculation to price, it can be based on any of the 19 integrated strength modes + 9 timeframes. With the FFx USM, you are able to define any period for any combination of timeframes. For example, you can set the dashboard for the last 10 candles for M15-H1-H4… Full flexibility! Very easy to interpret... It gives a great idea about which currency is weak and which is strong, so you can find the best pai
The FFx Universal MTF alerter shows on a single chart all the timeframes (M1 to Monthly) with their own status for the chosen indicator. 9 indicators mode (MACD-RSI-Stochastic-MA-ADX-Ichimoku-Candles-CCI-PSAR). Each can be applied multiple times on the same chart with different settings. Very easy to interpret. Confirm your BUY entries when most of the timeframes are showing green color. And confirm your SELL entries when most of the timeframes are showing red color. 2 Alert Options : input to s
The FFx Watcher PRO is a dashboard displaying on a single chart the current direction of up to 15 standard indicators and up to 21 timeframes. It has 2 different modes: Watcher mode: Multi Indicators User is able to select up to 15 indicators to be displayed User is able to select up to 21 timeframes to be displayed Watcher mode: Multi Pairs User is able to select any number of pairs/symbols User is able to select up to 21 timeframes to be displayed This mode uses one of the standard indicators
FFx Patterns Alerter gives trade suggestions with Entry, Target 1, Target 2 and StopLoss .... for any of the selected patterns (PinBar, Engulfing, InsideBar, OutsideBar) Below are the different options available: Multiple instances can be applied on the same chart to monitor different patterns Entry suggestion - pips to be added over the break for the entry 3 different options to calculate the SL - by pips, by ATR multiplier or at the pattern High/Low 3 different options to calculate the 2 TPs -
MetaTrader 4 version available here : https://www.mql5.com/en/market/product/24881 FFx Basket Scanner is a global tool scanning all pairs and all timeframes over up to five indicators among the 16 available. You will clearly see which currencies to avoid trading and which ones to focus on. Once a currency goes into an extreme zone (e.g. 20/80%), you can trade the whole basket with great confidence. Another way to use it is to look at two currencies (weak vs strong) to find the best single pairs
MetaTrader 4 version available here: https://www.mql5.com/en/market/product/25793 FFx Pivot SR Suite PRO is a complete suite for support and resistance levels. Support and Resistance are the most used levels in all kinds of trading. Can be used to find reversal trend, to set targets and stop, etc. The indicator is fully flexible directly from the chart 4 periods to choose for the calculation: 4Hours, Daily, Weekly and Monthly 4 formulas to choose for the calculation: Classic, Camarilla, Fibonac
ClassicSBA
Umri Azkia Zulkarnaen
this indicator very simple and easy if you understand and agree with setup and rule basic teknical sba you can cek in link : please cek my youtube channel for detail chanel : an for detail info  contact me  basicly setup buy (long) for this indicator is Magenta- blue and green candle or magenta - green  and green candlestik and for setup sell (short) is Black - yellow - and red candle or black - red  and red candlestik
Pendiente de Precio
Cesar Juan Flores Navarro
Indicador en base a la pendiente de la linea de precio, dibuja una línea de color cuando sube a base de los precios que previamente has sido procesados o linealizados, y cuando baja la pendiente la linea linealizada toma otro color. En este caso se a considerado 6 lineas de diferentes procesos desde pendientes largas hacia las cortas, observándose que cuando coincidan las pendientes se produce un máximo o mínimo, lo que a simple vista nos permitirá hacer una COMPRA O VENTA.
Индикатор Coefficient Of Determination (COD) представляет собой значение коэффициента детерминации или квадрат коэффициента корреляции между зависимой переменной — ценой и объясняющей переменной — тиковым объемом. Что это дает нам на практике? COD отлично распознает кульминацию трендовых движений, что позволяет подбирать оптимальные точки и ловить развороты рынка. Как использовать индикатор: Наиболее популярная торговая стратегия строится совместно с трендовым индикатором Moving Average (MA), пе
Fibonacci Multiple 12
Cesar Juan Flores Navarro
Fibonacci Múltiple 12, utiliza la serie fibonacci plasmado en el indicador fibonacci, aumentadolo 12 veces según su secuencia. El indicador fibonacci normalmente muestra una vez, el presente indicador se mostrara 12 veces empezando el numero que le indique siguiendo la secuencia. Se puede utilizar para ver la tendencia en periodos cortos y largos, de minutos a meses, solo aumentado el numero MULTIPLICA.
Recommended TimeFrame >= H1. 100% Non Repainted at any moment.  Use it carefully, only with Trend Direction. Trading Usage: 2 Variants: as Range System or as BreakOut System (Both Only With Trend Direction)::: (Always use StopLoss for minimise Risk); [1] as Range System: (Recommended) in UP TREND:  - BUY in Blue Line , then if price goes down by 50 points (on H1) open Second BUY.   Close in any Profit you wish: TrailingStop(45 points) or Close when Price touches upper Gold Line. in DOWN TREND
Linea Horizontal Inteligente
Cesar Juan Flores Navarro
En base a cálculos matemáticos de determino una linea Horizontal que cruza a todas las señales de trading, mostrando los máximos y mínimos. La linea horizontal parte en dos las subidas y bajadas de las señales de trading, de tan manera que es fácil identificar los máximos y mínimos, y es inteligente por que es sensible a las subidas y bajadas, afín de no quedarse en un solo lado por siempre, trabaja excelentemente con otros indicadores suavizadores ya que les garantiza que en un intervalo de tie
Spike Detector
Tete Adate Adjete
this indicator is a Spike detector indicator, it is specially designed to trade Boom 1000, Boom 500, Crash 1000 and Crash 500 We recommend using it on Deriv Boom and Crash indices only Its setting is intuitive, familiar, easy to use it has notification functions; audible notifications and push notifications. this tool is simple to use, easy to handle This update is based on different strategies for spikes
Limitless MT5
Dmitriy Kashevich
Limitless MT5 is a universal indicator suitable for every beginner and experienced trader. works on all currency pairs, cryptocurrencies, raw stocks Limitless MT5 - already configured and does not require additional configuration And now the main thing Why Limitless MT5? 1 complete lack of redrawing 2 two years of testing by the best specialists in trading 3 the accuracy of correct signals exceeds 80% 4 performed well in trading during news releases Trading rules 1 buy signal - the ap
Escalera Inteligente
Cesar Juan Flores Navarro
Indicador en MQL5, recibe la información del precio SUAVIZADO, lo procesa anulando los picos inteligentemente, y el resultado lo envía al desarrollo de la escalera que iniciara y subirá o bajara según el peldaño o INTERVALO ingresado Ingreso PERIODO = 50 (variar segun uso) Ingreso MULTIPLICA AL PERIODO = 1 (variar segun uso) Segun la configuración la escalera puede pegarse o separarse de los precios,, Se aplica toda la linea de tiempo, y a todas las divisas, etc.  
Altri dall’autore
Crown EA MT5
Ismael Nayif Ismael Ismael
Crown Trading Crown, Expert Advisors for Meta Trader 5    Ultra Global Invest Hub       Crown AI is a complex and novel algorithm that uses Artificial Intelligence in combination with traditional technical analysis to predict market movements. This Expert Advisor makes       use of Recurrent Neural Networks, specifically Long-Short-Term-Memory cells, that are trained using data from technical analysis indicators. Through this method, the EA is able to           learn which indicators are most r
Filtro:
Nessuna recensione
Rispondi alla recensione