Adaptive Weighted Average PRO Trend MT5

Trend Following with Adaptive Weighted Average (AWA) Indicator

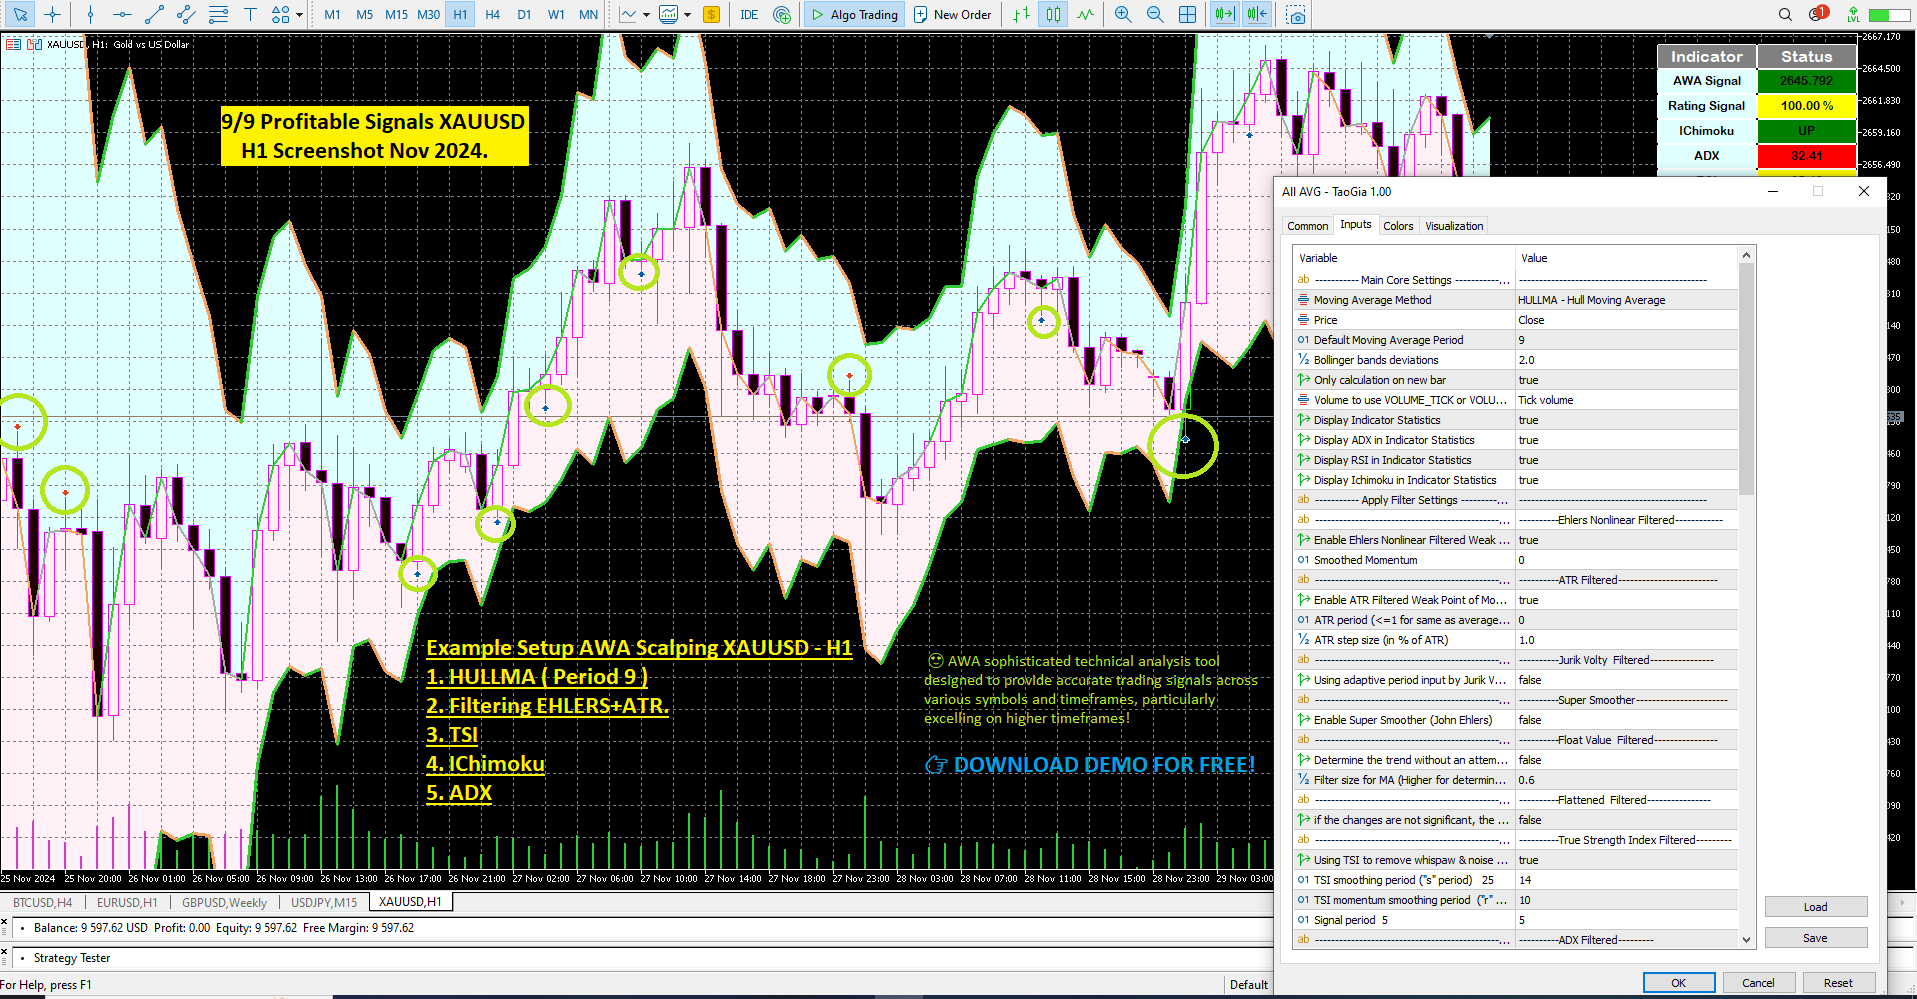
The Adaptive Weighted Average (AWA) indicator is  is a powerful technical analysis tool designed to provide highly accurate trading signals across various symbols and timeframes.  This indicator leverages a unique Adaptive Weighted Average (AWA) calculation, combining multiple moving averages with user-defined weights, and incorporates advanced filtering techniques to minimize noise and whipsaw signals.  The indicator is particularly effective on larger timeframes, offering increased precision for swing and position traders.

Core Features and Functionality

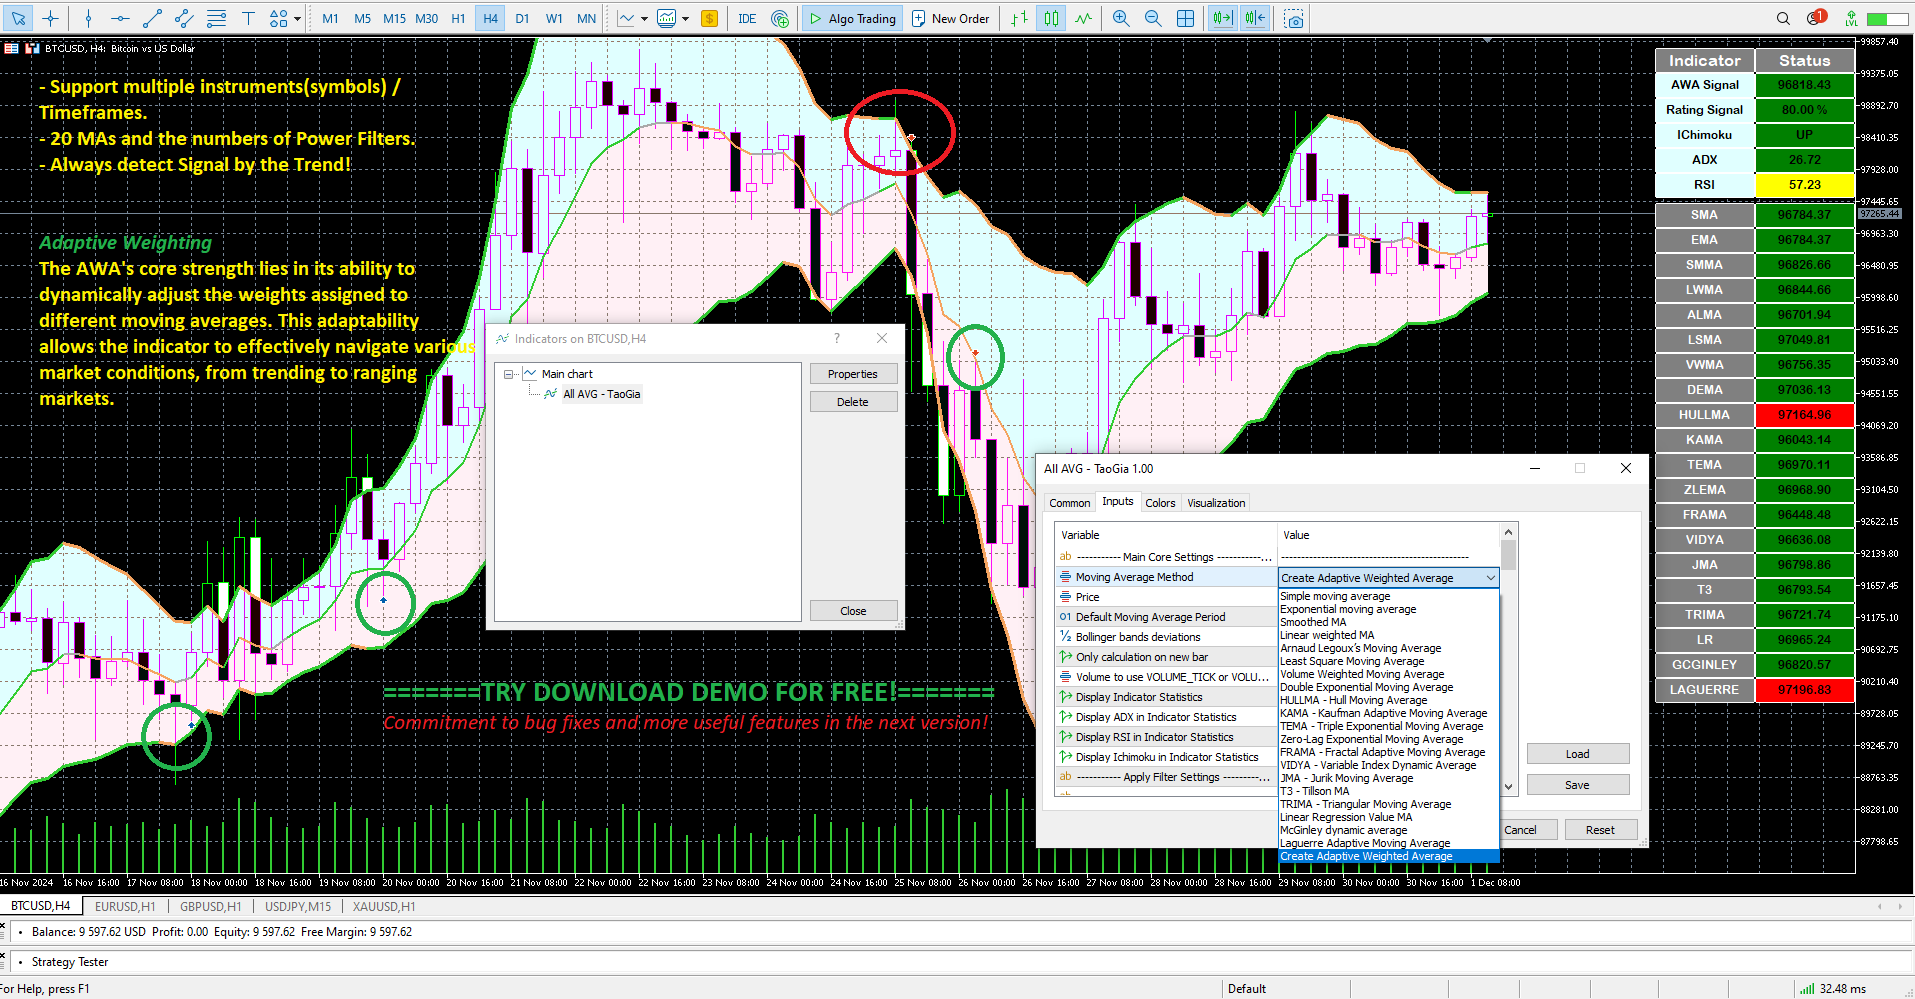
The AWA indicator leverages a sophisticated algorithm that dynamically adjusts its calculations based on market conditions.  This adaptability makes it a versatile tool for navigating various market scenarios.

1. Moving Average Methods:

The indicator offers a wide selection of moving average methods, allowing you to tailor the analysis to your specific trading style and market preferences. The available options include:

  • SMA (Simple Moving Average): A basic moving average calculated by summing the closing prices over a specified period and dividing by the number of periods.

  • EMA (Exponential Moving Average): Weights recent prices more heavily, making it more responsive to new market data.

  • SMMA (Smoothed Moving Average): A smoother version of the SMA, reducing noise and providing a more stable signal.

  • LWMA (Linear Weighted Moving Average): Assigns linearly decreasing weights to older prices.

  • ALMA (Arnaud Legoux Moving Average): A smoother and less lagging moving average that offers adjustable offset and sigma parameters.

  • LSMA (Least Squares Moving Average): Uses linear regression to calculate the best-fit line for the price data.

  • VWMA (Volume Weighted Moving Average): Weighs prices based on their corresponding volume, highlighting price movements with significant trading activity.

  • DEMA (Double Exponential Moving Average): Reduces lag by applying a double exponential smoothing to the price data.

  • HULLMA (Hull Moving Average): A fast and smooth moving average known for its responsiveness to price changes.

  • KAMA (Kaufman Adaptive Moving Average): Adjusts its smoothing based on market volatility, making it effective in both trending and ranging markets.

  • TEMA (Triple Exponential Moving Average): Reduces lag further by applying triple exponential smoothing.

  • ZLEMA (Zero Lag Exponential Moving Average): Aims to eliminate lag entirely, providing a more immediate signal.

  • FRAMA (Fractal Adaptive Moving Average): Uses fractal geometry to adapt to market volatility.

  • VIDYA (Variable Index Dynamic Average): Uses the Chande Momentum Oscillator (CMO) to adjust its smoothing.

  • JMA (Jurik Moving Average): A highly customizable moving average with adjustable smoothing and phase parameters.

  • T3 (Tillson Moving Average): A triple smoothed EMA that reduces lag and noise.

  • TRIMA (Triangular Moving Average): A double smoothed SMA.

  • LR (Linear Regression): Calculates the linear regression line for the price data.

  • McGinley Dynamic Average: A type of moving average that is designed to track markets more closely than existing moving averages.

  • Laguerre: A filtering method used to analyze the market to identify potential trend changes and overbought or oversold conditions.

  • Adaptive Weighted Average (ma_taogia): A unique and powerful feature that allows you to combine multiple moving averages with user-defined weights. This enables you to create a custom moving average that leverages the strengths of different methods.
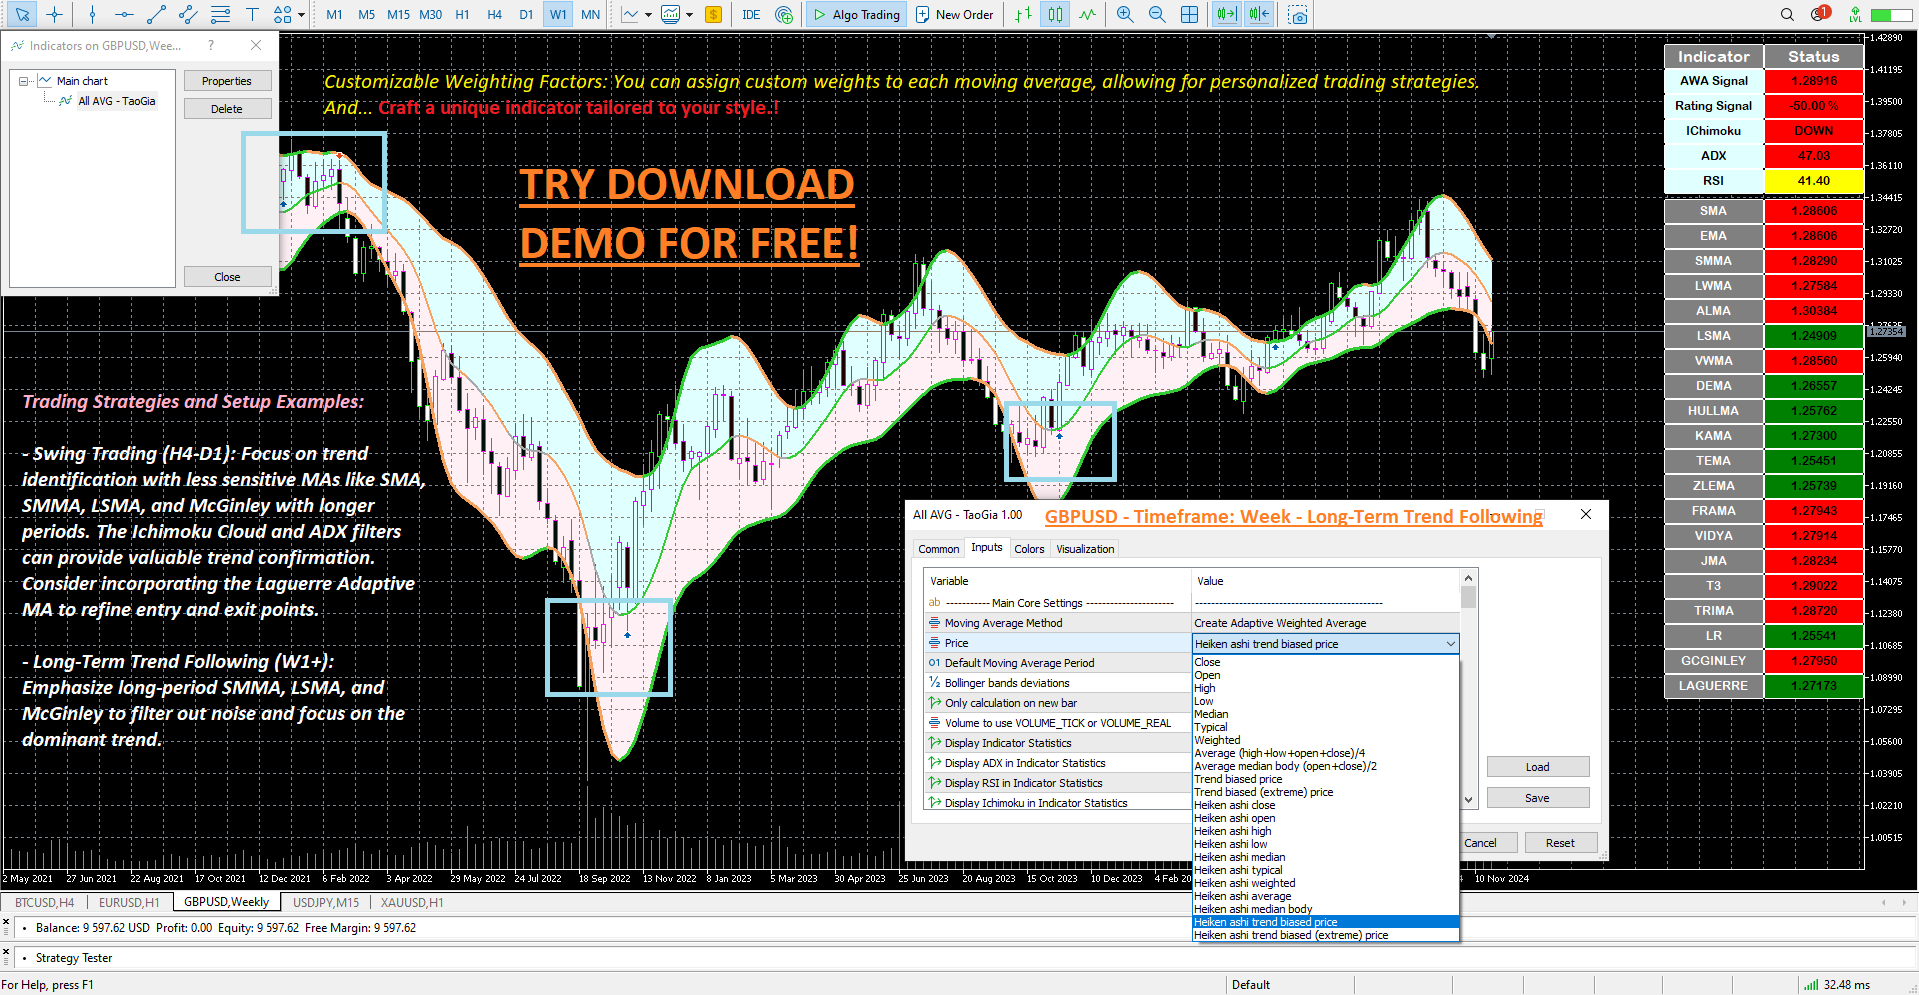
2. Price Inputs:

The AWA indicator supports various price inputs, providing flexibility in how the moving averages are calculated:

  • Close, Open, High, Low: Standard price inputs.

  • Median, Typical, Weighted, Average: Calculated price inputs that incorporate multiple price points.

  • Heiken Ashi variants: Smoothed price inputs that can reduce noise and provide a clearer picture of the trend.

  • Trend Biased variants: Prioritize closing prices higher than opening prices for buy signals and vice versa for sell signals.

3. Bollinger Bands:

The indicator incorporates Bollinger Bands, using deviations from the chosen moving average to identify potential overbought and oversold conditions.

Advanced Filtering Techniques

The AWA indicator integrates advanced filtering mechanisms to enhance the reliability of its signals and minimize false entries.

  • Ehlers Nonlinear Filter: This filter helps to smooth out the moving average and reduce the impact of short-term price fluctuations, enhancing the indicator's ability to identify the underlying trend.

  • ATR Filter: The Average True Range (ATR) filter helps to eliminate whipsaws and noise in the signal line by adjusting the moving average based on market volatility. This ensures that the signals generated by the AWA indicator are more reliable and less susceptible to false breakouts.

  • Jurik Volty Filter: This filter uses the Jurik Volatility indicator to dynamically adjust the period of the moving average, optimizing its responsiveness to changing market conditions. This adaptive period helps to capture more accurate signals, particularly in volatile markets.

  • Super Smoother Filter: This filter, developed by John Ehlers, further smooths the moving average, minimizing noise and providing a clearer picture of the dominant trend.

  • Float Value Filter: This filter helps to determine the trend without relying on the slope of the moving average. It focuses on the magnitude of price changes, providing a more robust trend identification.

  • Flattened Filter: This filter "flattens" the moving average when price changes are insignificant, helping to identify periods of consolidation and avoid false signals during sideways markets.

  • TSI (True Strength Index) Filter: This filter uses the TSI indicator to remove whipsaws and noise from the signal line, enhancing the indicator's ability to identify significant trend changes.

  • ADX (Average Directional Index) Filter: This filter removes weak points in the moving average by considering the ADX indicator, a measure of trend strength. Signals are generated only when the ADX is above a user-defined threshold and the directional indicators (+DI and -DI) confirm the trend direction.

  • Ichimoku Cloud Filter: This filter forces the signal to follow the trend by considering the Ichimoku Cloud indicator. Buy signals are generated when the price is above the cloud and other Ichimoku conditions are met, and sell signals are generated when the price is below the cloud and corresponding conditions are fulfilled.

Signal Generation and Alerts

The AWA indicator can generate signals in two ways:

  1. Default Signal: Based on the direction of the one chosen moving average and its relationship with the Bollinger Bands. Buy signals are triggered when the moving average is rising and the price is near the lower band; sell signals occur when the moving average is falling and the price is near the upper band. These signals are further filtered using the selected filtering techniques.

  2. Cross Signal: Based on the crossover of two moving averages. The indicator includes a second moving average, which can be customized with a different method, price input, and period. Buy signals are generated when the primary moving average crosses above the secondary moving average, and sell signals are generated when the primary moving average crosses below the secondary moving average.

The indicator includes customizable alert options for signal generation, including:

  • Customizable alert messages.

  • Sound alerts, email alerts, and push app notifications.


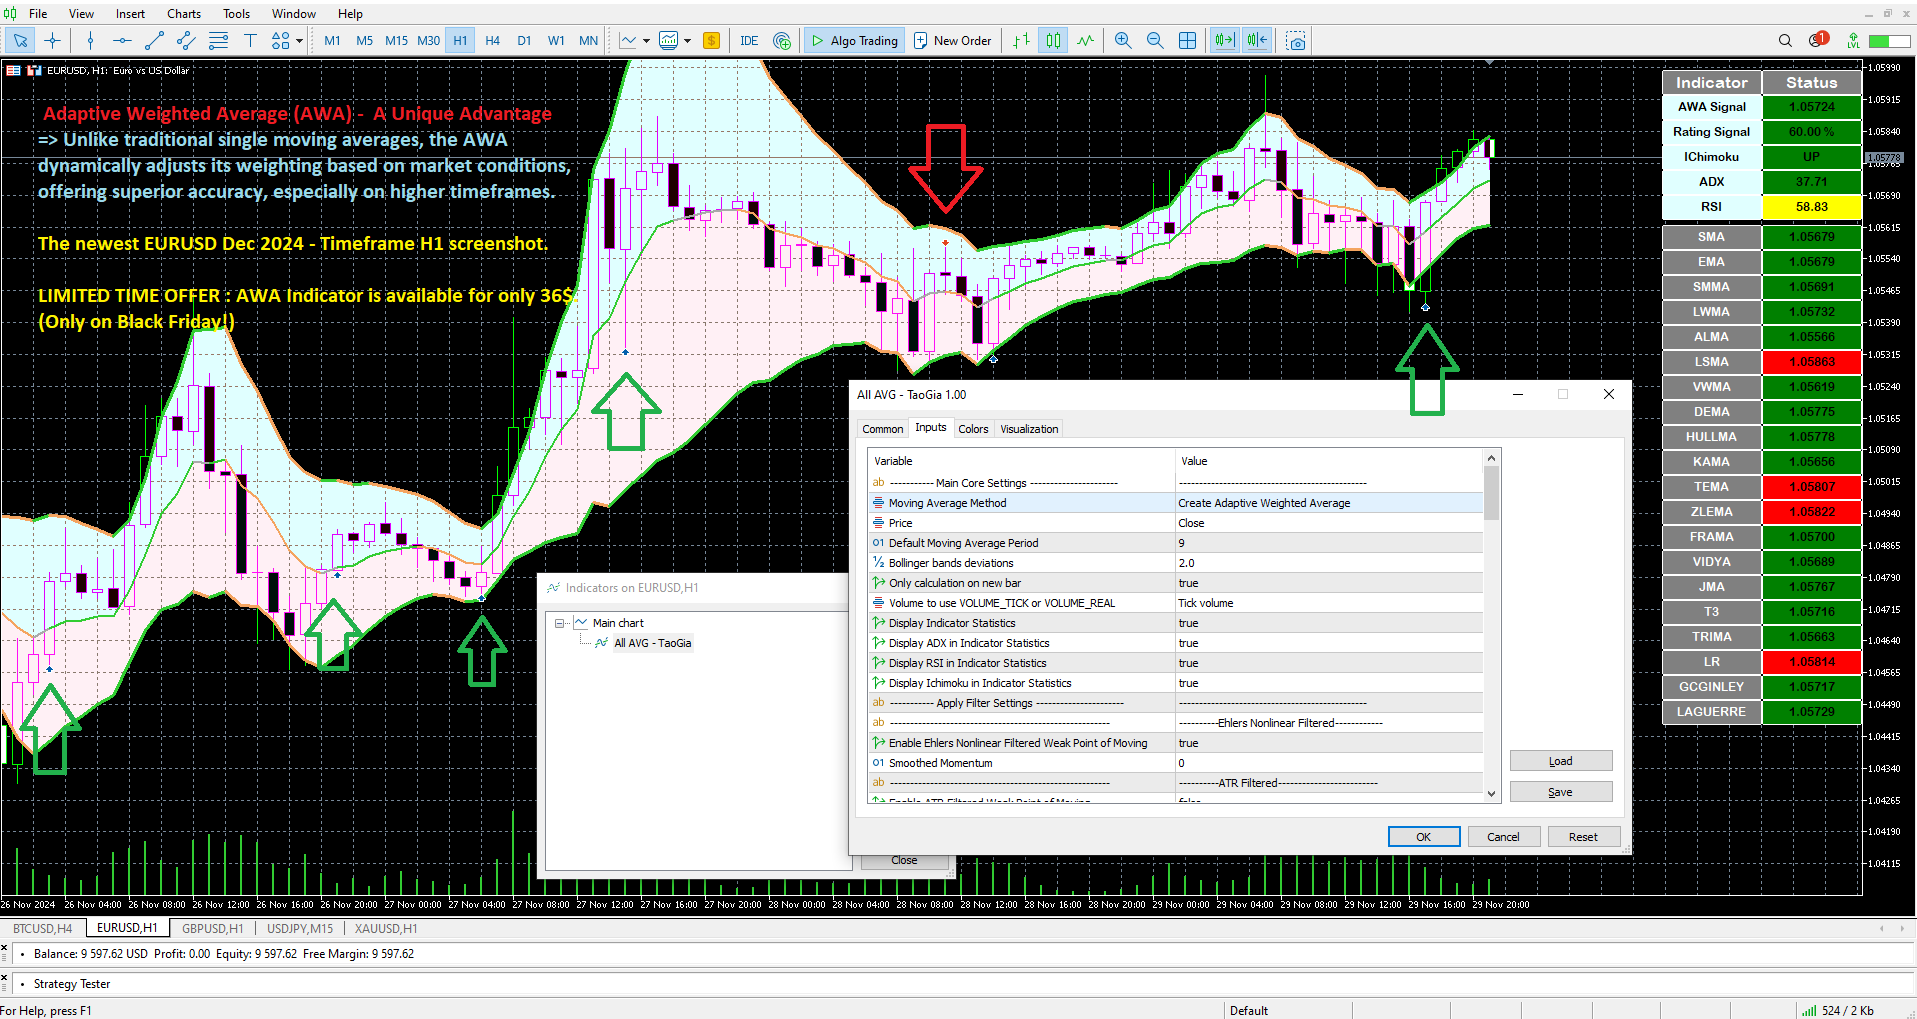
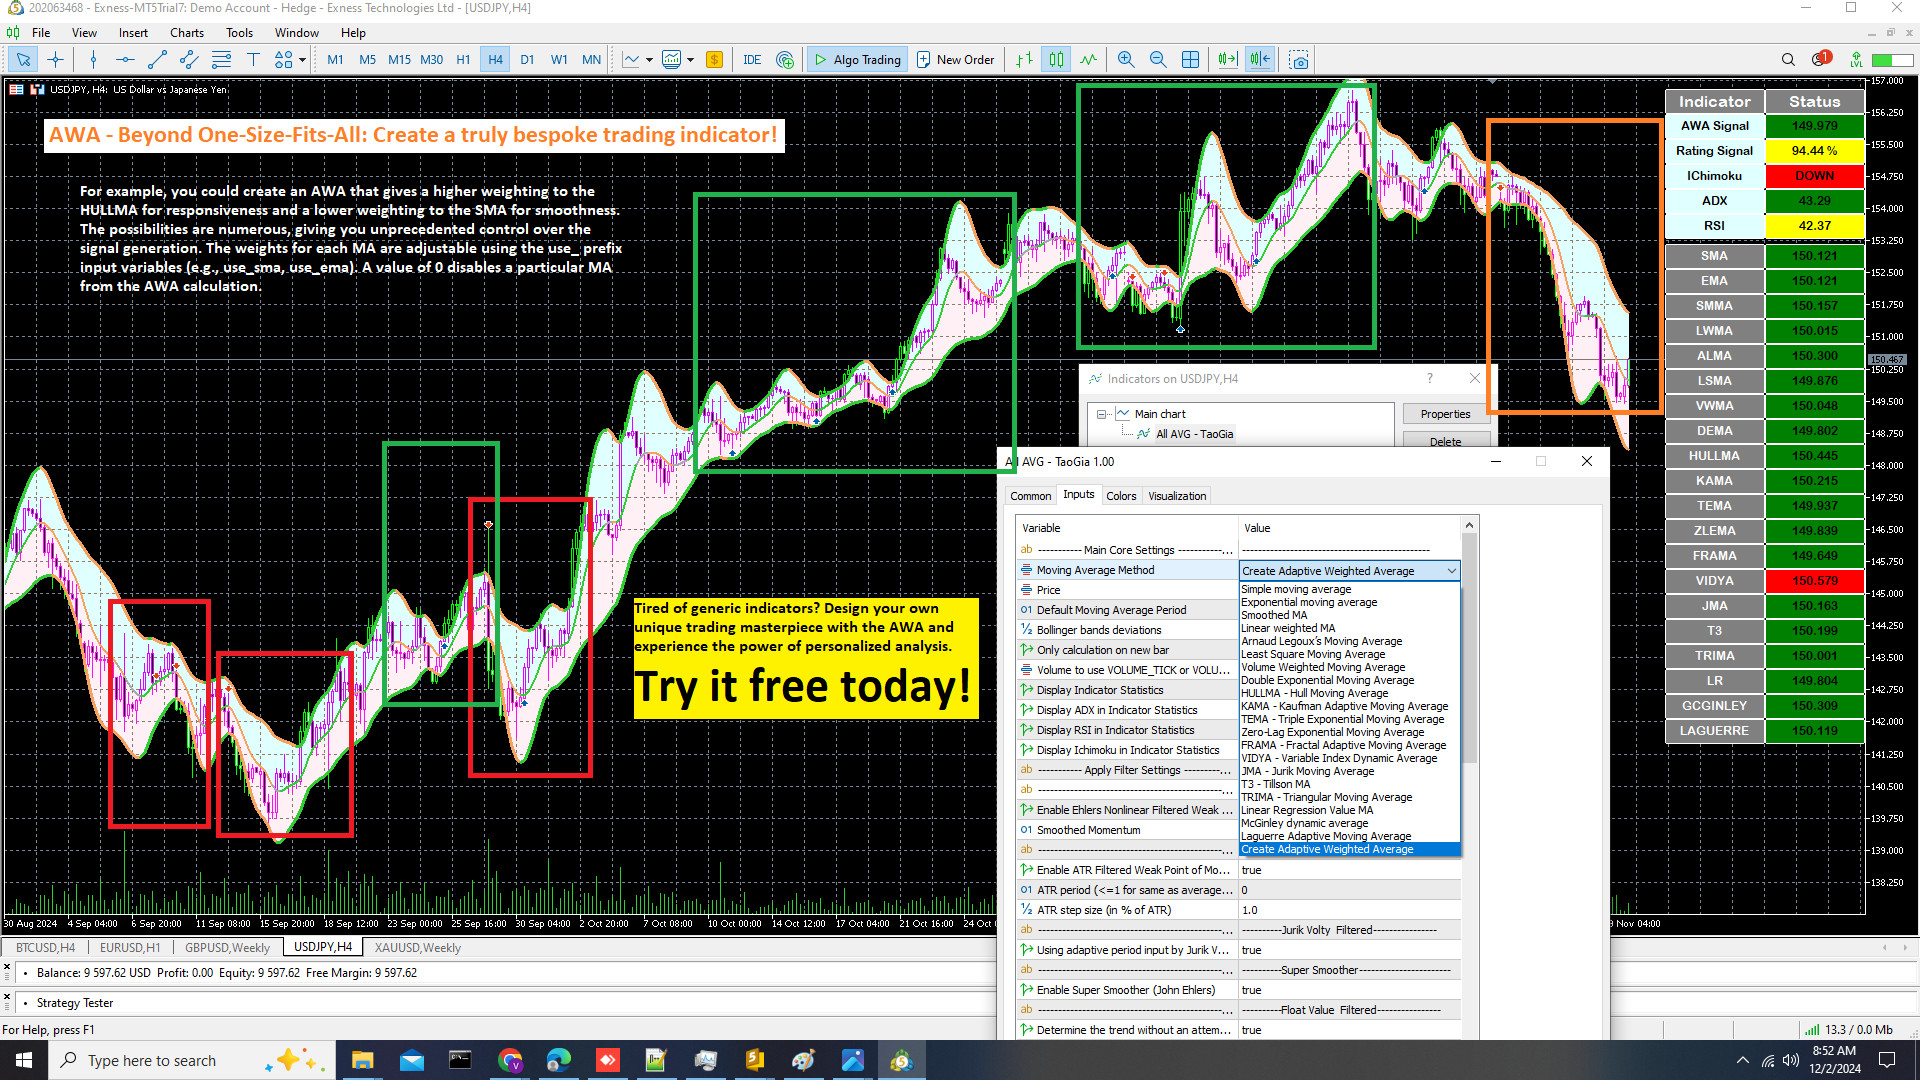
Adaptive Weighted Average (AWA) - A Unique Advantage

The "Create Adaptive Moving Average" option in the  inpMaMethod parameter is a key highlight of this indicator. It allows you to create a custom Adaptive Weighted Average (AWA) by combining different moving averages with user-defined weights. This feature allows you to experiment with various combinations to find an optimal balance between responsiveness and smoothness, potentially leading to more accurate signals and better trading performance. For example, you could create an AWA that gives a higher weighting to the HULLMA for responsiveness and a lower weighting to the SMA for smoothness. The possibilities are numerous, giving you unprecedented control over the signal generation. The weights for each MA are adjustable using the use_ prefix input variables (e.g., use_sma, use_ema). A value of 0 disables a particular MA from the AWA calculation.

Conclusion

The AWA indicator offers a unique and comprehensive approach to technical analysis. Its adaptive nature, combined with advanced filtering techniques and a user-friendly interface, makes it a valuable tool for traders of all levels. The ability to combine various moving averages and customize filters provides a significant advantage, allowing you to fine-tune the indicator to your specific trading strategy and market conditions. Explore the potential of the AWA indicator and experience its accuracy and versatility firsthand.

Limited-Time Offer: Discover the power of personalized indicators. Try the AWA free & Design your own winning formula!

Author: TaoGiaVietNam -  If you have some questions or if you need help, contact me via Private Message.


Prodotti consigliati
RBreaker
Zhong Long Wu
RBreaker Gold Indicators is a short-term intraday trading strategy for gold futures that combines trend following and intraday reversal approaches. It not only captures profits during trending markets but also enables timely profit-taking and counter-trend trading during market reversals. This strategy has been ranked among the top ten most profitable trading strategies by the American magazine   Futures Truth   for 15 consecutive years. It boasts a long lifecycle and remains widely used and st
STRICTLY FOR BOOM INDEX ONLY!!!!! Here I bring the Maximum Trend Arrows OT1.0 MT5 indicator. This indicator is made up of a combination of different trend indicators for entries and exits, for entries an orange arrow will paint on the chart below the current market and a red flag for closing of trades and it produces buy arrows only. When the orange arrow appears, it will appear along with it's sound to notify you. The 1H timeframe is recommended, don't use it anywhere else than on the 1H timefr
ZigZag SMC Premium MT5
Kallebe Lins De Oliveira Santos
If you are looking for precision in identifying strategic tops and bottoms, the ZigZag SMC/SMT Indicator for MT5 is the tool that will contribute to your technical analysis. Developed based on the advanced concepts of Smart Money Concepts (SMC) and Smart Money Trap (SMT), it offers an insight into market behavior, helping you make decisions. What will you find in this indicator? Automatic identification of strategic tops and bottoms Based on institutional strategies Ideal for analyzing liqu
Unlock the Market's Hidden Blueprint with Advanced Pattern Recognizer Tired of staring at charts, struggling to spot high-probability trading opportunities? What if you had a professional analyst scanning the markets 24/7, drawing perfect trendlines, and calculating precise profit targets for you? Introducing Advanced Pattern Recognizer for MetaTrader 5 – Your Automated Technical Analysis Powerhouse. This isn't just another indicator. It's a sophisticated algorithmic engine designed to do the he
Automated Trendlines MT5
Georgios Kalomoiropoulos
Le linee di tendenza sono lo strumento più essenziale di analisi tecnica nel forex trading. Sfortunatamente, la maggior parte dei trader non li disegna correttamente. L'indicatore automatizzato delle linee di tendenza è uno strumento professionale per i trader seri che ti aiuta a visualizzare il movimento di tendenza dei mercati. Esistono due tipi di linee di tendenza, linee di tendenza rialziste e linee di tendenza ribassiste. Nella tendenza rialzista, la linea di tendenza Forex viene tracci
Oscillator trading signals - это динамический индикатор, определяющий состояние к продолжению тенденции роста или падению цены торгового инструмента и отсечению зон с нежелательной торговлей. Индикатор состоит из 2 линий осцилляторов. Медленная и быстрая сигнальная линия.  Шкала отображения перевернутая. Зоны вблизи 0 свидетельствуют о тенденции роста цены валютной пары. Зоны -100 свидетельствуют о падении цены валютной пары. На основном графике в виде стрелок отображается потенциально выгодные
MercariaPattern1-2-3 відстежує рух ціни, знаходить трьоххвильові структури 1-2-3 та підсвічує момент, коли сценарій підтверджується пробоєм ключового рівня. MercariaPattern1-2-3 tracks price movement, detects three-leg 1-2-3 structures and highlights the moment when the scenario is confirmed by a key level breakout. Індикатор збирає локальні свінги в компактну фігуру 0–1–2–3 , чекає підтвердженого пробою та будує стрілку входу з готовими рівнями SL/TP. The indicator combines local swings into a
PZ Swing Trading MT5
PZ TRADING SLU
5 (5)
Protect against whipsaws: revolutionize your swing trading approach Swing Trading is the first indicator designed to detect swings in the direction of the trend and possible reversal swings. It uses the baseline swing trading approach, widely described in trading literature. The indicator studies several price and time vectors to track the aggregate trend direction and detects situations in which the market is oversold or overbought and ready to correct. [ Installation Guide | Update Guide | Tro
AutoTrend Pro
Aram Hussein Mohammed
TL Method — Automatic Trendline Detection & Strength Indicator Tired of drawing trendlines manually? TL Method does it for you — automatically detecting, drawing, and scoring trendlines in real time. What it does: Scans up to 1000 bars to find valid support and resistance trendlines Scores each trendline by counting confirmed anchor touches Generates buy/sell signal arrows when price approaches strong trendlines Alerts you via popup, push notification, or sound — with smart cooldown to avoid spa
CosmiCLab SMC FIBO CosmiCLab SMC FIBO is a professional trading indicator designed for traders who use Smart Money Concepts (SMC), market structure analysis and Fibonacci retracement levels. The indicator automatically detects market swings and builds Fibonacci levels based on the latest impulse movement. It also identifies market structure changes such as BOS (Break of Structure) and CHOCH (Change of Character), helping traders understand the current market direction. CosmiCLab SMC FIBO also pr
The Super Arrow Indicator provides non-repainting buy and sell signals with exceptional accuracy. Key Features No repainting – confirmed signals remain fixed Clear visual arrows: green for buy, red for sell Real-time alerts via pop-up, sound, and optional email Clean chart view with no unnecessary clutter Works on all markets: Forex, gold, oil, indices, crypto Adjustable Parameters TimeFrame Default:   "current time frame" Function:   Sets the time frame for indicator calculation Options:   Can
FFx Patterns Alerter gives trade suggestions with Entry, Target 1, Target 2 and StopLoss .... for any of the selected patterns (PinBar, Engulfing, InsideBar, OutsideBar) Below are the different options available: Multiple instances can be applied on the same chart to monitor different patterns Entry suggestion - pips to be added over the break for the entry 3 different options to calculate the SL - by pips, by ATR multiplier or at the pattern High/Low 3 different options to calculate the 2 TPs -
# DRAWDOWN INDICATOR V4.0 - The Essential Tool to Master Your Trading ## Transform Your Trading with a Complete Real-Time Performance Overview In the demanding world of Forex and CFD trading, **knowing your real-time performance** isn't a luxury—it's an **absolute necessity**. The **Drawdown Indicator V4.0** is much more than a simple indicator: it's your **professional dashboard** that gives you a clear, precise, and instant view of your trading account status. --- ## Why This Indicator
Heiken Ashi Smoothed Strategy is a very simple but powerful system to get forex market trend direction. This indicator is actually 2 indicators in 1 pack, Heiken Ashi and Heiken Ashi Smoothed Moving Average both included. Because HA (Heiken Ashi) and HAS (Heiken Ashi Smoothed) are calculated in the same one system event with necessary buffers and loop only, so it is the FAST, OPTIMIZED and EFFICIENT HA having the combined indicator of MetaTrader 5. You can choose to display HA and HAS in the sam
Key Candlepatterns
Raphael Lorenz Baumgartner
Key Candlepatterns Platform: MetaTrader 5 Type: Custom Indicator Display: Chart Window (Candlestick Overlay) Functions: Detects and color-codes specific candlestick patterns based on candle shape, relative position, and ATR filters. Candles receive distinct colors depending on type (e.g. inside bar, outside bar, engulfing, hammer, shooting star, etc.). Visual patterns can help traders identify where buyers or sellers are likely active . Turning points (e.g., hammer followed by confirmation) are
Monthly Levels Pro
N'da Lemissa Kouame
ITALIANO – Monthly Levels Pro v1.0 L’indicatore definitivo dei livelli mensili di mercato Controlla le zone chiave del mercato a colpo d’occhio. Monthly Levels Pro ti permette di analizzare le tendenze a lungo termine e individuare rapidamente supporti e resistenze mostrando automaticamente High, Low, Open e Close della candela mensile. Vantaggi: Analisi immediata Trading più intelligente Chiarezza visiva Flessibile Semplice ed efficace Compatibilità: MT5, tutti i timeframe
Candle Pattern Finder MT5
Pavel Zamoshnikov
4.2 (5)
This indicator searches for candlestick patterns. Its operation principle is based on Candlestick Charting Explained: Timeless Techniques for Trading Stocks and Futures by Gregory L. Morris. If a pattern is detected, the indicator displays a message at a bar closure. If you trade using the MetaTrader 4 terminal, then you can download the full analogue of the " Candle Pattern Finder for MT4 " indicator It recognizes the following patterns: Bullish/Bearish (possible settings in brackets) : Hammer
This trading indicator is non-repainting, non-redrawing, and non-lagging, making it an ideal choice for both manual and automated trading. It is a Price Action–based system that leverages price strength and momentum to give traders a real edge in the market. With advanced filtering techniques to eliminate noise and false signals, it enhances trading accuracy and potential. By combining multiple layers of sophisticated algorithms, the indicator scans the chart in real-time and translates comple
ATrend
Zaha Feiz
4.83 (18)
"ATREND: Come funziona e come utilizzarlo" ### Come funziona L'indicatore "ATREND" per la piattaforma MT5 è progettato per fornire ai trader robusti segnali di acquisto e vendita utilizzando una combinazione di metodologie di analisi tecnica. Questo indicatore sfrutta principalmente l'Average True Range (ATR) per la misurazione della volatilità, insieme ad algoritmi di individuazione dei trend per identificare potenziali movimenti di mercato. Lascia un messaggio dopo l'acquisto e ricevi un rega
Naked Forex Kangaroo Tail Indicator Kangaroo Tail Indicator is a pattern recognition indicator for Forex, Stocks, Indices, Futures, Commodities and Cryptos. The Kangaroo Tail is a multi-bar pattern. The Kangaroo Tail pattern is very effective and is very simple to trade. The strategy that comes with the Kangaroo Tail is based on price action. The indicator does what it was designed for: displaying Kangaroo Tail patterns.   Don't expect to follow the up and down arrows and make money . Tradin
PipFinite Trend PRO MT5
Karlo Wilson Vendiola
4.84 (558)
Breakthrough Solution For Trend Trading And Filtering With All Important Features Built Inside One Tool! Trend PRO's smart algorithm detects the trend, filters out market noise and gives entry signals with exit levels. The new features with enhanced rules for statistical calculation improved the overall performance of this indicator. Important Information Revealed Maximize the potential of Trend Pro, please visit www.mql5.com/en/blogs/post/713938 The Powerful Expert Advisor Version Automatin
Real Trend Zigzag PRO   shows the real trend of a market, u nlike the default Zigzag indicator. It calculates the trend in real time and shows green lines for upwards trends, red lines for downward trends and blue lines for no trends.  Regarding the old slogan "the trend is your friend" it helps you to decide if should open a buy or sell position. The PRO version is a multi timeframe zigzag (MTF). Means, it shows the trend of the current timeframe as well as the trend of a higher or lower time.
All about time and price by ICT. This indicator provides a comprehensive view of ICT killzones, Silver Bullet times, and ICT Macros, enhancing your trading experience.  In those time windows price either seeks liquidity or imbalances and you often find the most energetic price moves and turning points. Features: Automatic Adaptation: The ICT killzones intelligently adapt to the specific chart you are using. For Forex charts, it follows the ICT Forex times: In EST timezone: Session: Asia: 20h00-0
Terra Infinity is a flat indicator. This improved version of the CalcFlat indicator has three additional lines that significantly increase its effectiveness. Unlike its predecessor with two static levels, Terra Infinity adds three dynamic lines above the main histogram, which are interpreted as follows: base signal line, minimum signal line, maximum signal line. These lines are formed using the additional parameter Avg, which is the average value of the histogram. Averaging produces a line cl
Tembus Trawangan (The Target) MT5 The Ultimate Price Action Radar for Precision Trading Are you tired of staring at messy charts and missing high-probability setups? Meet Tembus Trawangan (TT) —the most intuitive Price Action indicator designed to simplify your trading and find the "sweet spots" in the market automatically. Tembus Trawangan isn't just an indicator; it’s your personal market scout . It scans the price action across 21 timeframes to find the hidden "Target" zones where big moves
Chỉ báo này sẽ thông báo cho bạn nếu cấu hình xu hướng thành công. Tín hiệu theo xu hướng không nên được tăng theo, nhưng tín hiệu mua ở mức giá thấp theo mô hình giao dịch thông thường của bạn, hoặc tín hiệu bán ở mức giá tốt, là một lựa chọn rất tốt. Hãy thiết lập nó trên khung thời gian lớn hơn và theo dõi các khung thời gian nhỏ hơn, bám sát các xu hướng chính. Tôi thường thiết lập ba khung thời gian gần nhau nhất và không bao giờ đi ngược tín hiệu của INdicator này. INdicator   này không có
HAshi-E è un modo migliorato di analizzare i segnali Heiken-Ashi. Briefing: L'Heiken-Ashi è particolarmente apprezzato per la sua capacità di filtrare la volatilità a breve termine, che lo rende uno strumento privilegiato per identificare e seguire le tendenze, aiuta a prendere decisioni sui punti di entrata e di uscita e aiuta a distinguere tra falsi segnali e vere inversioni di tendenza. A differenza dei tradizionali grafici a candele, le candele Heiken-Ashi sono calcolate utilizzando i val
Indicatore Crypto_Forex "Major_Trend_Histogram" per MT5, senza ridisegno. - Indicatore Major_Trend_Histogram progettato per individuare trend davvero significativi. - L'indicatore può essere di 2 colori: rosa per trend ribassista e verde per trend rialzista (i colori possono essere modificati). - Rileva i trend nelle fasi iniziali, molto più efficiente di qualsiasi media mobile standard. - Major_Trend_Histogram può essere combinato con qualsiasi altro metodo di trading: Price Action, VSA e alt
ShiftedPriceDensity   — Professional Price Density Indicator with Shifted Historical Levels Input parameters Depth 100 Starting depth   TopLevelsToShow 1 Levels in each set   NumberOfShifts 10 Number of sets   ShiftSpacing 20 Shift step between sets   PriceStep 0.0001 Minimum price difference between levels   PriceSource PRICE_CLOSE Source price type   LevelColor clrDodgerBlue Level line color   LevelWidth 2 Level line thickness   Prefix "" Object prefix for naming   ShiftedPriceDensity   is an
Smart Buy Sell Signal is a powerful and easy-to-use trend trading indicator designed for traders who want clear and reliable buy and sell signals. The indicator uses an ATR-based smart trailing algorithm to detect trend reversals and generate precise entry signals. When the market trend changes, the indicator automatically plots Buy and Sell arrows directly on the chart, helping traders quickly identify trading opportunities. To improve decision making, the indicator also includes a Multi-Timefr
Gli utenti di questo prodotto hanno anche acquistato
Azimuth Pro
Ottaviano De Cicco
5 (6)
Azimuth Pro V2: Synthetic Fractal Structure and Confirmed Entries for MT5 Overview Azimuth Pro is a multi-level swing structure indicator by Merkava Labs . Four nested swing layers, swing-anchored VWAP, ABC pattern detection, three-timeframe structural filtering, and closed-bar confirmed entries — one chart, one workflow from micro-swings to macro-cycles. This is not a blind signal product. It is a structure-first workflow for traders who care about location, context, and timing. V2 Launch Offe
Divergence Bomber
Ihor Otkydach
4.9 (86)
Ogni acquirente dell’indicatore riceverà inoltre gratuitamente: L’utilità esclusiva “Bomber Utility”, che gestisce automaticamente ogni operazione, imposta i livelli di Stop Loss e Take Profit e chiude le posizioni secondo le regole della strategia I file di configurazione (set file) per adattare l’indicatore a diversi asset I set file per configurare il Bomber Utility in tre modalità: “Rischio Minimo”, “Rischio Bilanciato” e “Strategia di Attesa” Una guida video passo-passo per installare, conf
Quantum TrendPulse
Bogdan Ion Puscasu
5 (23)
Ecco   Quantum TrendPulse   , lo strumento di trading definitivo che combina la potenza di   SuperTrend   ,   RSI   e   Stocastico   in un unico indicatore completo per massimizzare il tuo potenziale di trading. Progettato per i trader che cercano precisione ed efficienza, questo indicatore ti aiuta a identificare con sicurezza le tendenze di mercato, i cambiamenti di momentum e i punti di entrata e uscita ottimali. Caratteristiche principali: Integrazione SuperTrend:   segui facilmente l'andame
Presentazione       Quantum Breakout PRO   , l'innovativo indicatore MQL5 che sta trasformando il modo in cui scambi le zone di breakout! Sviluppato da un team di trader esperti con un'esperienza di trading di oltre 13 anni,       Quantum Breakout PRO       è progettato per spingere il tuo viaggio di trading a nuovi livelli con la sua strategia innovativa e dinamica della zona di breakout. Quantum Breakout Indicator ti fornirà frecce di segnalazione sulle zone di breakout con 5 zone target di
Grabber System MT5
Ihor Otkydach
4.83 (23)
Ti presento un eccellente indicatore tecnico: Grabber, che funziona come una strategia di trading "tutto incluso", pronta all’uso. In un solo codice sono integrati strumenti potenti per l’analisi tecnica del mercato, segnali di trading (frecce), funzioni di allerta e notifiche push. Ogni acquirente di questo indicatore riceve anche gratuitamente: L’utility Grabber: per la gestione automatica degli ordini aperti Video tutorial passo dopo passo: per imparare a installare, configurare e utilizzare
OmniSync Projection
Antonio-alin Teculescu
5 (1)
Chronos Fractal Engine is an innovative price projection indicator for MetaTrader 5, designed to transform your technical analysis by intelligently identifying and projecting historical price patterns. Built upon an advanced correlation algorithm and the fractal principles of the market, this powerful tool visualizes potential future price movements, giving you a unique edge in your trading decisions. What is Chronos Fractal Engine? At its core, the Chronos Fractal Engine employs a sophisticat
ARICoins
Temirlan Kdyrkhan
ARICoin is a powerful trading companion designed to generate high-probability entry signals with dynamic TP/SL/DP levels based on volatility. Built-in performance tracking shows win/loss stats, PP1/PP2 hits, and success rates all updated live. Key Features: Buy/Sell signals with adaptive volatility bands Real-time TP/SL/DP levels based on ATR Built-in MA Filter with optional ATR/StdDev volatility Performance stats panel (Success, Profit/Loss, PP1/PP2) Alerts via popup, sound, push, or email Cust
Btmm state engine pro
Garry James Goodchild
5 (4)
BTMM State Engine Pro is a MetaTrader 5 indicator for traders who use the Beat The Market Maker approach: Asian session context, kill zone timing, level progression, peak formation detection, and a multi-pair scanner from a single chart. It combines cycle state logic with a built-in scanner dashboard so you do not need the same tool on many charts at once. What it does Draws the Asian session range; session times can follow broker server offset or be set in inputs. Tracks level progression (L
Innanzitutto, vale la pena sottolineare che questo Strumento di Trading è un Indicatore Non-Ridipingente, Non-Ridisegnante e Non-Laggante, il che lo rende ideale per il trading professionale. Corso online, manuale utente e demo. L'Indicatore Smart Price Action Concepts è uno strumento molto potente sia per i nuovi che per i trader esperti. Racchiude più di 20 utili indicatori in uno solo, combinando idee di trading avanzate come l'Analisi del Trader del Circolo Interno e le Strategie di Tradin
CGE Trading Suite
Carl Gustav Johan Ekstrom
5 (1)
Institutional-Grade Analytics for MT5 CGE Trading Suite delivers the analytical edge typically reserved for professional trading desks. The platform integrates a full suite of analytical tools into one seamless workflow: dynamic grid mapping, liquidity behavior analysis, ECM, trend lines, MIDAS, trade cycles, and directional channel projections. Together, these provide a unified view of market structure and momentum. Directional clarity is further enhanced by the capital flow index, which measu
RelicusRoad Pro: Sistema Operativo Quantitativo di Mercato 70% DI SCONTO ACCESSO A VITA (TEMPO LIMITATO) - UNISCITI A 2.000+ TRADER Perché la maggior parte dei trader fallisce anche con indicatori "perfetti"? Perché operano su Singoli Concetti isolati. Un segnale senza contesto è una scommessa. Per vincere serve CONFLUENZA . RelicusRoad Pro non è un semplice indicatore. È un Ecosistema Quantitativo completo . Mappa la "Fair Value Road", distinguendo tra rumore e rotture strutturali. Smetti di in
Berma Bands
Muhammad Elbermawi
5 (8)
L'indicatore Berma Bands (BBs) è uno strumento prezioso per i trader che cercano di identificare e capitalizzare i trend di mercato. Analizzando la relazione tra il prezzo e le BBs, i trader possono discernere se un mercato è in una fase di trend o di range. Visita il [ Berma Home Blog ] per saperne di più. Le Berma Bands sono composte da tre linee distinte: la Upper Berma Band, la Middle Berma Band e la Lower Berma Band. Queste linee sono tracciate attorno al prezzo, creando una rappresentazion
ARIPoint
Temirlan Kdyrkhan
ARIPoint is a powerful trading companion designed to generate high-probability entry signals with dynamic TP/SL/DP levels based on volatility. Built-in performance tracking shows win/loss stats, PP1/PP2 hits, and success rates all updated live. Key Features: Buy/Sell signals with adaptive volatility bands Real-time TP/SL/DP levels based on ATR Built-in MA Filter with optional ATR/StdDev volatility Performance stats panel (Success, Profit/Loss, PP1/PP2) Alerts via popup, sound, push, or email Cu
ICT PO3 (Power of 3) AMD Protocol Framework Indicator True Time & Structure Integration   |  Non-Repainting | Real-Time  | Multi-Asset  | MT4 Version Available Full Setup Guide & Strategy Playbook: https://www.mql5.com/en/blogs/post/768683 MT4 Version: https://www.mql5.com/en/market/product/171742 Indicator Overview The ICT PO3 AMD Protocol Framework is a complete structural overlay for MetaTrader 5 that maps the True Daily Cycle directly onto your lower-timeframe execution chart. It projects
Bill Williams Advanced
Siarhei Vashchylka
5 (11)
Bill Williams Advanced is designed for automatic chart analysis using Bill Williams' "Profitunity" system. The indicator analyzes four timeframes at once. Manual (Be sure to read before purchasing) Advantages 1. Analyzes the chart using Bill Williams' "Profitunity" system. Signals are displayed in a table in the corner of the screen and on the price chart. 2. Finds all known AO and AC signals, as well as zone signals. Equipped with a trend filter based on the Alligator. 3. Finds "Divergence Bar
TPA True Price Action indicator reveals the true price action of the market makers through 100% non-repainting signals strictly at the close of a candle! TPA shows entries and re-entries, every time the bulls are definitely stronger than the bears and vice versa. Not to confuse with red/green candles. The shift of power gets confirmed at the earliest stage and is ONE exit strategy of several. There are available now two free parts of the TPA User Guide for our customers. The first "The Basics"
RFI levels PRO MT5
Roman Podpora
3.67 (3)
L'indicatore mostra accuratamente i punti di inversione e le zone di ritorno dei prezzi in cui il       Principali attori   . Vedi dove si formano le nuove tendenze e prendi decisioni con la massima precisione, mantenendo il controllo su ogni operazione. VERSION MT4     -    Rivela il suo massimo potenziale se combinato con l'indicatore   TREND LINES PRO Cosa mostra l'indicatore: Strutture di inversione e livelli di inversione con attivazione all'inizio di un nuovo trend. Visualizzazione dei li
Easy SMC Trading
Israr Hussain Shah
3 (2)
Structure Trend con Auto RR e Scanner BOS Versione: 1.0 Panoramica Structure Trend con Auto RR è un sistema di trading completo progettato per i trader che si affidano all'azione del prezzo e alla struttura del mercato. Combina un filtro di tendenza levigato con il rilevamento dei punti swing e i segnali di rottura della struttura (BOS) per generare configurazioni di trading ad alta probabilità. La caratteristica distintiva di questo strumento è la gestione automatica del rischio. Al rilevame
AriX
Temirlan Kdyrkhan
1 (4)
AriX Indicator for MT5 A powerful trend-following and signal-evaluation tool AriX is a custom MT5 indicator that combines Moving Averages and ATR-based risk/reward logic to generate clear buy/sell signals. It visualizes dynamic SL/TP levels, evaluates past trade outcomes, and displays win/loss statistics in a clean on-chart panel. Key features include: Buy/Sell signals based on MA crossovers ATR-based SL/TP1/TP2/TP3 levels with visual lines and labels Signal outcome tracking with real-time stat
Advanced Supply Demand MT5
Bernhard Schweigert
4.53 (15)
La migliore soluzione per qualsiasi principiante o trader esperto! Questo indicatore è uno strumento di trading unico, di alta qualità e conveniente perché abbiamo incorporato una serie di funzionalità proprietarie e una nuova formula. Con questo aggiornamento, sarai in grado di mostrare fusi orari doppi. Non solo potrai mostrare una TF più alta, ma anche entrambe, la TF del grafico, PIÙ la TF più alta: SHOWING NESTED ZONES. Tutti i trader di domanda di offerta lo adoreranno. :) Informazioni imp
Meravith MT5
Ivan Stefanov
5 (1)
Strumento per market maker. Meravith: Analizzerà tutti i timeframe e mostrerà il trend attualmente in corso. Evidenzierà le zone di liquidità (equilibrio dei volumi) dove i volumi rialzisti e ribassisti sono uguali. Mostrerà tutti i livelli di liquidità dei diversi timeframe direttamente sul grafico. Genererà e presenterà un’analisi di mercato testuale a scopo di riferimento. Calcolerà obiettivi, livelli di supporto e punti di stop-loss in base al trend attuale. Calcolerà il rapporto rischio/ren
Trend Lines PRO MT5
Roman Podpora
5 (1)
LINEE DI TENDENZA PRO  Aiuta a capire dove il mercato sta realmente cambiando direzione. L'indicatore mostra reali inversioni di tendenza e punti in cui i principali operatori rientrano. Vedi   Linee BOS   Cambiamenti di tendenza e livelli chiave su timeframe più ampi, senza impostazioni complesse o rumore inutile. I segnali non vengono ridisegnati e rimangono sul grafico dopo la chiusura della barra. VERSIONE MT4   -   Svela il suo massimo potenziale se abbinato all'indicatore   RFI LEVELS PRO
Trend Forecaster
Alexey Minkov
5 (7)
12% OFF EASTER SALE The Trend Forecaster indicator utilizes a unique proprietary algorithm to determine entry points for a breakout trading strategy. The indicator identifies price clusters, analyzes price movement near levels, and provides a signal when the price breaks through a level. The Trend Forecaster indicator is suitable for all financial assets, including currencies (Forex), metals, stocks, indices, and cryptocurrencies. You can also adjust the indicator to work on any time frames, alt
FX Analysis is an all-in-one MT5 indicator dashboard that combines eight analytical tools in a single panel, helping traders identify high-probability setups without switching between charts or indicators. Designed for standard forex pairs on MetaTrader 5. Best results on M15 - H4 timeframes when all components are used together as part of the included workflow. Components Volatility Analyzer Displays historical average movement by hour and by day of the week. A real-time Pip Balance shows the
Shock Pullback
Suleiman Alhawamdah
5 (1)
Semplicemente, puoi iniziare a fare trading quando il movimento dei numeri bianchi — noti come "pips" — inizia ad apparire accanto alla candela corrente. I "pips" bianchi indicano che un'operazione di acquisto o vendita è attualmente attiva e si sta muovendo nella direzione corretta, come indicato dal colore bianco. Quando il movimento dei pips bianchi si interrompe e diventa di colore verde statico, questo segnala la fine della spinta attuale. Il colore verde dei numeri rappresenta il profitto
Top indicator for MT5   providing accurate signals to enter a trade without repainting! It can be applied to any financial assets:   forex, cryptocurrencies, metals, stocks, indices .  Watch  the video  (6:22) with an example of processing only one signal that paid off the indicator! MT4 version is here It will provide pretty accurate trading signals and tell you when it's best to open a trade and close it. Most traders improve their trading results during the first trading week with the help of
Introduction to X3 Chart Pattern Scanner X3 Cherart Pattern Scanner is the non-repainting and non-lagging indicator detecting X3 chart patterns including Harmonic pattern, Elliott Wave pattern, X3 patterns, and Japanese Candlestick patterns. Historical patterns match with signal patterns. Hence, you can readily develop the solid trading strategy in your chart. More importantly, this superb pattern scanner can detect the optimal pattern of its kind. In addition, you can switch on and off individu
Questo indicatore è un indicatore per l'analisi automatica delle onde perfetto per il trading pratico! Caso... Nota:   non sono abituato a usare nomi occidentali per la classificazione delle onde a causa dell'influenza della convenzione di denominazione di Tang Lun (Tang Zhong Shuo Zen), ho chiamato l'onda base come   penna   e la banda dell'onda secondaria come   segmento   At allo stesso tempo, il segmento ha la direzione del trend. La denominazione   è principalmente segmento di trend   (que
PZ Trend Trading MT5
PZ TRADING SLU
3.8 (5)
Capture every opportunity: your go-to indicator for profitable trend trading Trend Trading is an indicator designed to profit as much as possible from trends taking place in the market, by timing pullbacks and breakouts. It finds trading opportunities by analyzing what the price is doing during established trends. [ Installation Guide | Update Guide | Troubleshooting | FAQ | All Products   |  Get Help ] Trade financial markets with confidence and efficiency Profit from established trends witho
Ultimate SMC Indicator
Hicham Mahmoud Almoustafa
1 (1)
Ultimate SMC Indicator v2.20 — Smart Money Concepts All-in-One Stop switching between 5 different indicators. Ultimate SMC gives you everything Smart Money traders need — in one clean indicator with interactive controls. GUIDE What makes this different? Most SMC indicators show you Order Blocks or FVGs separately. You still have to figure out which zones actually matter. Ultimate SMC does the hard work: it scans for Order Blocks, Fair Value Gaps, Liquidity Sweeps, Supply & Demand zones, Fibo
Altri dall’autore
The Optimized MACD Divergence indicator is a powerful tool designed to identify potential trading opportunities by detecting divergences between price action and the MACD indicator. It combines classic divergence analysis with candlestick pattern recognition and volume filtering to provide more accurate and reliable signals. How it Works The indicator operates on the following principles: MACD Calculation:   It calculates the MACD indicator using user-defined parameters for fast EMA, slow EMA,
Filtro:
Nessuna recensione
Rispondi alla recensione