Unisciti alla nostra fan page

Liner regression - indicatore per MetaTrader 5

- Visualizzazioni:
- 15949
- Valutazioni:
- Pubblicato:
- Aggiornato:
-
 Ti stai perdendo delle opportunità di trading:
- App di trading gratuite
- Oltre 8.000 segnali per il copy trading
- Notizie economiche per esplorare i mercati finanziari
Registrazione AccediAccetti la politica del sito e le condizioni d’uso
Se non hai un account, registrati -
 Hai bisogno di un robot o indicatore basato su questo codice? Ordinalo su Freelance
Vai a Freelance
Hai bisogno di un robot o indicatore basato su questo codice? Ordinalo su Freelance
Vai a Freelance
Theory:
Linear regression attempts to model the relationship between two variables by fitting a linear
equation to observed data. One variable is considered to be an explanatory variable, and the
other is considered to be a dependent variable. For example, a modeler might want to relate
the weights of individuals to their heights using a linear regression model. The equation is the following:
![]()
Where x is a number of bars and y are prices.
The ratios of the mentioned equation are calculated as follows:
There are quite a few good implementations (some are explained in a very good way here : 3 Methods of Indicators Acceleration by the Example of the Linear Regression but there are some issues that needed to be addressed (mainly that some methods are not suitable for usage on in-code data ...).
This version:
This is "yet another" method that is producing exact results (without an approximation) as the "to the last letter" method, that can be used on arbitrary data and is fast (it is faster than even the method that is using built in functions to speed up the calculation). Execution time does not depend on the calculation period (it is negligible slower for very large periods than the calculation for short periods) which makes it suitable for usage in all sorts of filtering / calculating / smoothing ...
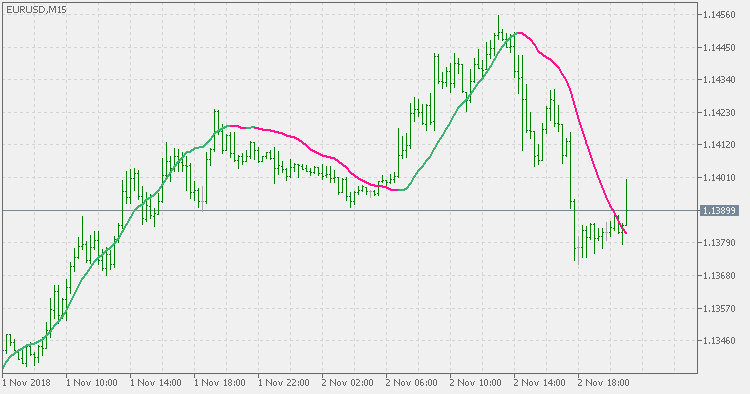
Usage:
You can use the color change as a signal
Weis Waves
Volume Wave indicator originally idealized by Richard D. Wyckoff.
Corrected generalized DEMA
Corrected generalized DEMA