 MetaTrader 5
 Sistemi Esperti
 Indicatori
 Script
 Librerie
 Archiviazione
Guarda come scaricare robot di trading gratuitamente
Ci trovi su Facebook!
Unisciti alla nostra fan page
Unisciti alla nostra fan page
Ti è piaciuto lo script? Provalo nel Terminale MetaTrader 5

CMC - indicatore per MetaTrader 5

- Visualizzazioni:
- 6044
- Valutazioni:
- Pubblicato:
- Aggiornato:
-
 Ti stai perdendo delle opportunità di trading:
- App di trading gratuite
- Oltre 8.000 segnali per il copy trading
- Notizie economiche per esplorare i mercati finanziari
Registrazione AccediAccetti la politica del sito e le condizioni d’uso
Se non hai un account, registrati -
 Hai bisogno di un robot o indicatore basato su questo codice? Ordinalo su Freelance
Vai a Freelance
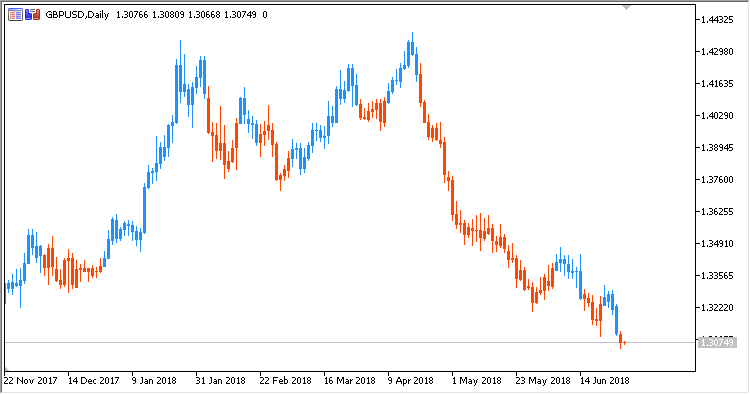
Indicator CMC (Clear Method Candles) displays colored candlesticks, based on the existing market trend. It is calculated by the "pure" method (without using any other indicators, only price) and has no configurable parameters. It is based on indicator Clear Method Histogram.
Calculations:
-
If Swing > 0, then candlesticks are blue
-
If Swing < 0, then candlesticks are red
where:
HH = Maximum(High, PrevHH)
LH = Minimum(High, PrevLH)
HL = Maximum(Low, PrevHL)
LL = Minimum(Low, PrevLL)
-
If Swing > 0 and High < HL:
Swing = -1
LL = Low
LH = High
-
If Swing < 0 and Low > LH:
Swing = 1
HH = High
HL = Low
-
Otherwise, if High < HL:
Swing = -1
LL = Low
LH = High
-
Otherwise, if Low > HL:
Swing = 1
HH = High
HL = Low
Tradotto dal russo da MetaQuotes Ltd.
Codice originale https://www.mql5.com/ru/code/21274
CMH
Indicator CMH (Clear Method Histogram) displays a color histogram of the current market trend.
VC
Indicator VC (Volatility Channel by Larry Williams).
CRF
Indicator CRF (Cumulative Rotation Factor) displays the states of the market: Uptrends/downtrends/consolidation.
JB_Volatility
JB Volatility - market volatility oscillator marking its state in color.