 MetaTrader 5
 Sistemi Esperti
 Indicatori
 Script
 Librerie
 Archiviazione
Guarda come scaricare robot di trading gratuitamente
Ci trovi su Twitter!
Unisciti alla nostra fan page
Unisciti alla nostra fan page
Ti è piaciuto lo script? Provalo nel Terminale MetaTrader 5

RVRResistance - indicatore per MetaTrader 5

- Visualizzazioni:
- 8457
- Valutazioni:
- Pubblicato:
- Aggiornato:
-
 Ti stai perdendo delle opportunità di trading:
- App di trading gratuite
- Oltre 8.000 segnali per il copy trading
- Notizie economiche per esplorare i mercati finanziari
Registrazione AccediAccetti la politica del sito e le condizioni d’uso
Se non hai un account, registrati -
 Hai bisogno di un robot o indicatore basato su questo codice? Ordinalo su Freelance
Vai a Freelance
Indicator RVR Price Resistance oscillator based on indicator Range_Volume_Ratio shows in a separate window, as a histogram, the candlestick size / tick volume ratios by two parameters:
- Difference between Open and Close;
- Difference between High and Low.
It also displays a signal line plotted by the method of smoothing the histogram values.
The color of the histogram columns can be displayed by two methods:
- By the value of the previous column. If the previous column is above the signal line, then the color is green. Otherwise, it is orange;
- One-color histogram - all columns are of one color.
The indicator allows identifying the highest and the lowest price movement resistance by comparing the bar range (from Open to Close or from High to Low) to tick volume. Direct ratio (range/volume) allows identifying the lowest resitance, while the reverse ratio (volume/range) allows identifying the highest resistance against price changes.
It has seven input parameters:
- Calculation type - type of calculations:
- Open/Close - difference between Open and Close;
- High/Low - difference between High and Low.
- Period - smoothing period of the signal line;
- Min points - filter by the minimum candlestick size;
- Min volume - filter by the minimum bar volume;
- MA Method - signal line calculation method;
- Colors setting - color settings:
- By previous bar position - histogram column color by the value of the previous column;
- One color - one color.
- Inverse - reverse calculations (Yes/No), Yes - identifying the highest resistance, No - the lowest one.
Filtering by the minimum candlestick size and volume just excludes from the calculations the candlestick size and volume that are lower than the specified values in these settings. In such case, the values specified here are taken into account, not the real size and volume.
Calculations:
If Inverse = No:
SR = Diff / Vol
If Inverse = Yes:
SR = Vol / Diff
Vol = Max(Volume, Min volume)
Diff = Max(RVR, Min points)
RVR - Range Volume Ratio
Signal = Moving average(SR, Period, Method)
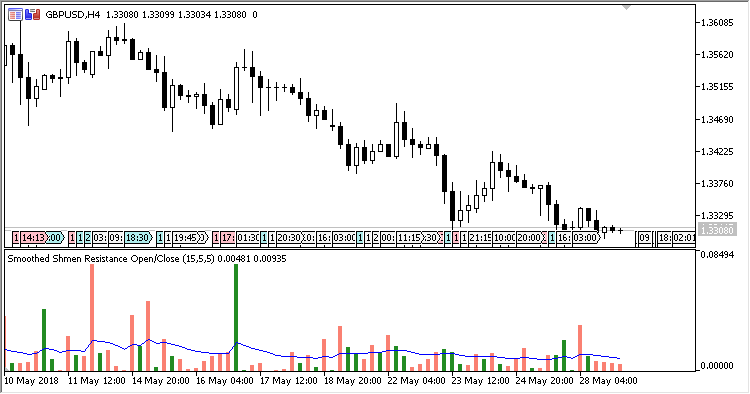
Fig.1. Calculating the lowest resistance by Open/Close
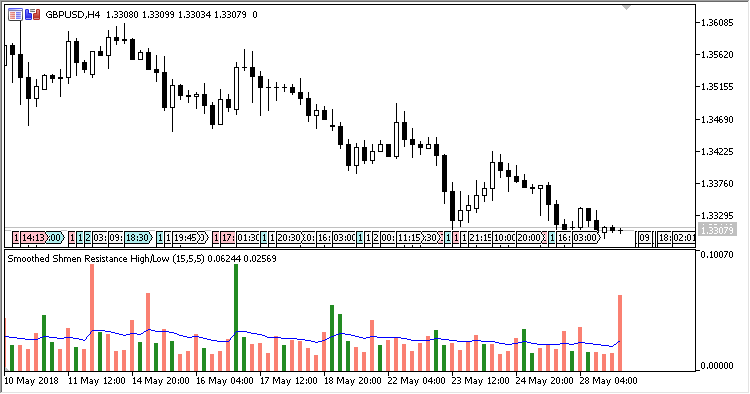
Fig.2. Calculating the lowest resistance by High/Low
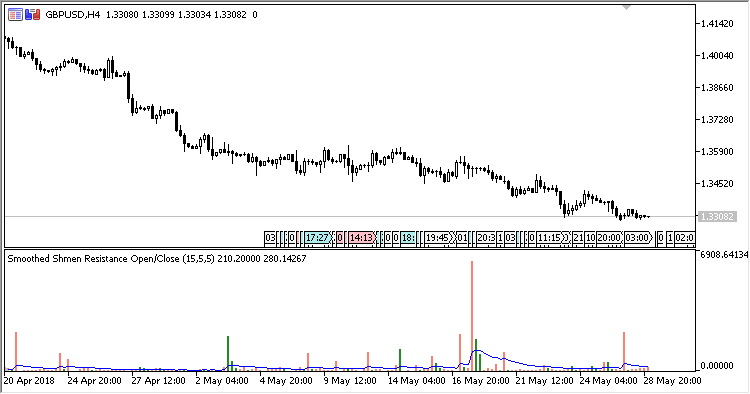
Fig.3. Calculating the highest resistance by Open/Close (the higher the column is, the stronger the price change resistance is)
Tradotto dal russo da MetaQuotes Ltd.
Codice originale https://www.mql5.com/ru/code/20923
Range_Volume_Ratio_S
Indicator of candlestick size / tick volume ratios and signal line.
Range_Volume_Ratio
Indicator of candlestick size / tick volume ratios.
Wiseman_HTF
Indicator Wiseman with the timeframe selection option in its input parameters.
WEVOMO
Weight Volume Move-Adjusted Moving Average.