Unisciti alla nostra fan page

Easy Trend Visualizer - indicatore per MetaTrader 4

- Visualizzazioni:
- 29902
- Valutazioni:
- Pubblicato:
- Aggiornato:
-
 Ti stai perdendo delle opportunità di trading:
- App di trading gratuite
- Oltre 8.000 segnali per il copy trading
- Notizie economiche per esplorare i mercati finanziari
Registrazione AccediAccetti la politica del sito e le condizioni d’uso
Se non hai un account, registrati -
 Hai bisogno di un robot o indicatore basato su questo codice? Ordinalo su Freelance
Vai a Freelance
Hai bisogno di un robot o indicatore basato su questo codice? Ordinalo su Freelance
Vai a Freelance
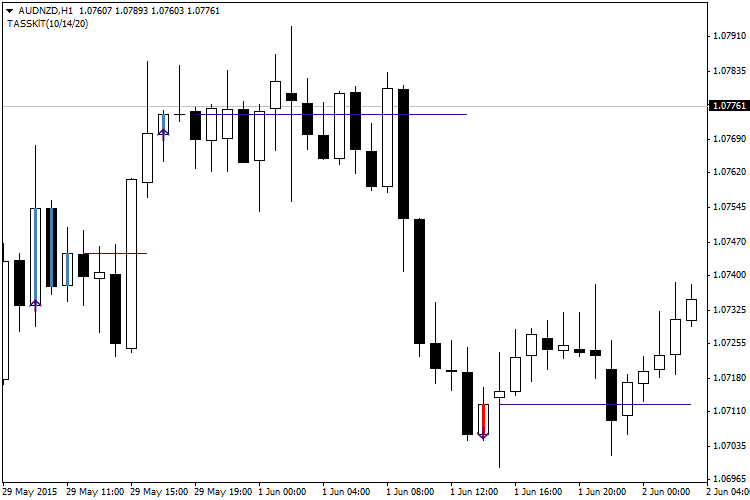
Easy Trend Visualizer — a simple visualizer of trends. This indicator does exactly what its name says. It shows where the trend starts and ends and where the trend is absent at all.
It is based on standard ADX (Average Direction Movement Index) indicators and works quite fast. Easy Trend Visualizer is displayed in the main chart window.
Input Parameters:
- ADXperiod1 (default = 10) — period of the first ADX indicator.
- ADXperiod2 (default = 14) — period of the second ADX indicator.
- ADXperiod3 (default = 20) — period of the third ADX indicator.
- UseAlert (default = false) — if true, generates signals when starting to plot the horizontal line.
Recommendations:
- Unfortunately, this indicator redraws on the current bar, so it can not be used to enter the position at the current bar. The previous bars are not redrawn and can be used as signals for entry. Although this is a fairly accurate indicator, it also generates a lot of false signals, but with the help of moderate levels of stop loss it is possible to avoid serious losses. It is also important to exit the position immediately after the trend ends.
Tradotto dal russo da MetaQuotes Ltd.
Codice originale https://www.mql5.com/ru/code/13182
Dots
The indicator shows current trend direction by placing colored dots on the main chart.
WRB
The indicator detects and marks the WRB (Wide Range Bars) or candlesticks with Wide Range Bodies.
GainLossInfo
Shows the current gain and loss for the candlesticks on the chart.
 HAN
HAN
The Heiken Ashi Naive Expert Advisor is based on the Heiken Ashi candle chart system and uses the standard indicator of the same name.