Patternist
- Indicateurs
- Version: 2.0
- Mise à jour: 27 novembre 2022
- Activations: 5

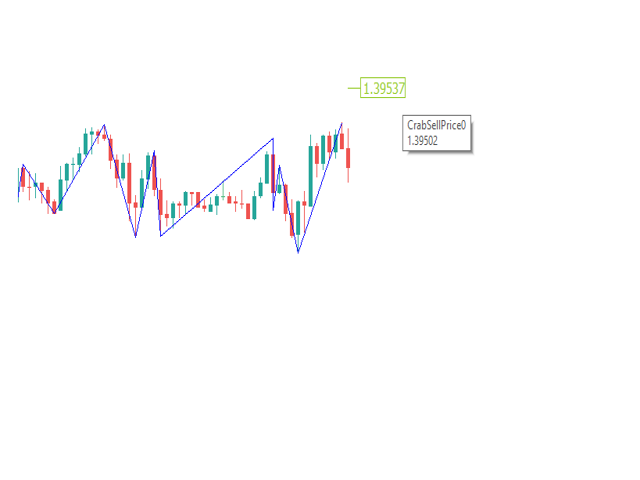
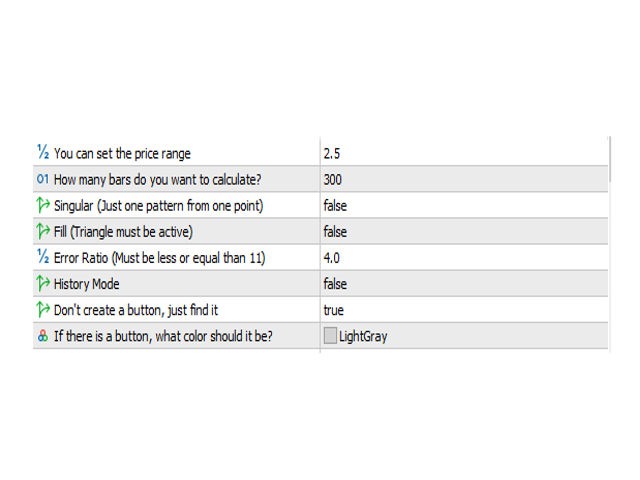
* Zigzag corrigé et accéléré. (Vous pouvez changer la plage)
* Le zigzag est mis à jour à chaque nouvelle bougie/barre.
* Si vous le souhaitez, en activant le bouton, uniquement lorsque vous cliquez sur le bouton, il recherche un motif. Si vous le faites automatiquement, il recherche chaque fois que le graphique est actualisé.
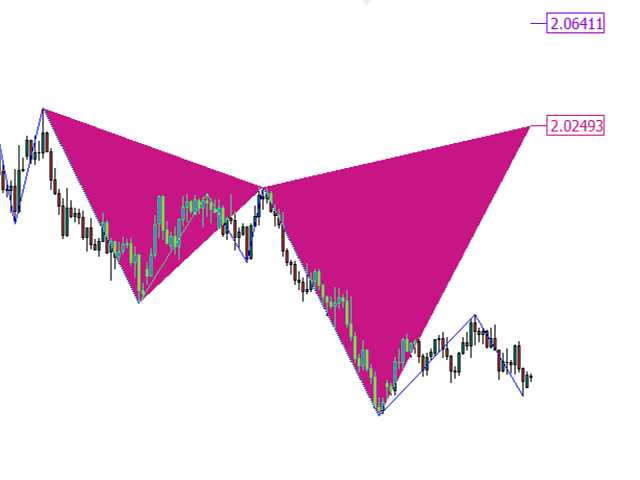
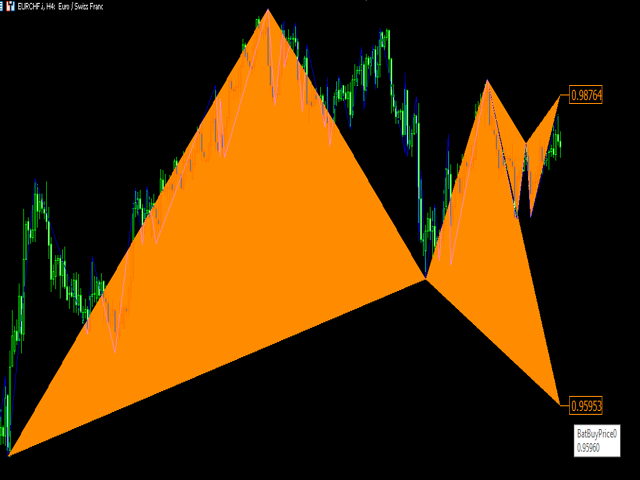
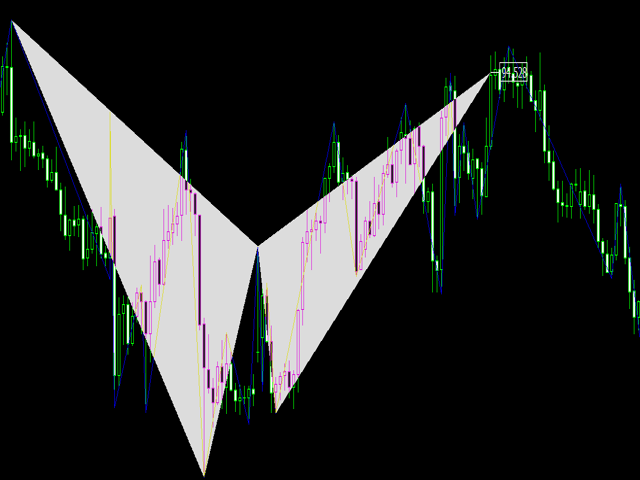
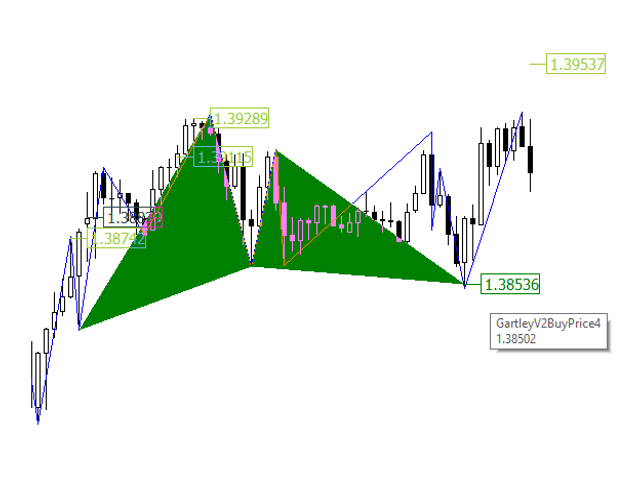
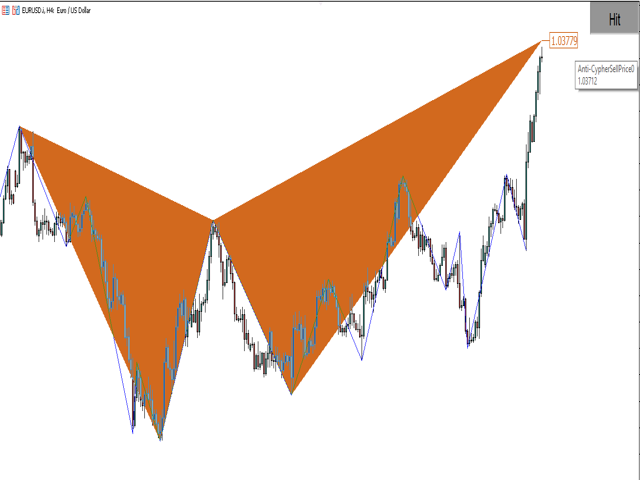
* 17 modèles harmoniques fréquemment utilisés et un modèle spécial que vous pouvez définir vos propres proportions.
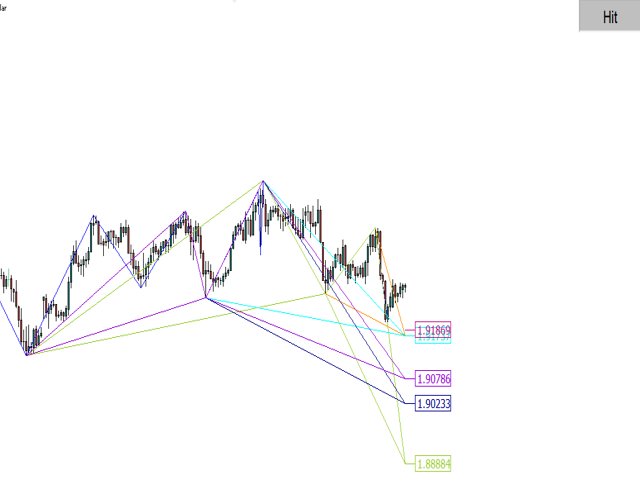
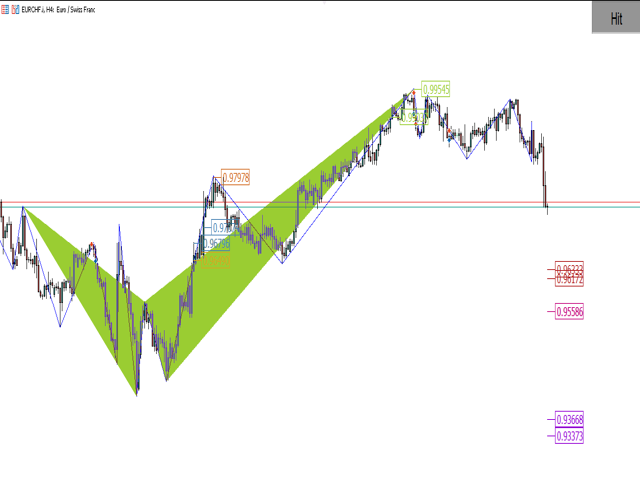
* Vous pouvez garder le graphique simple avec l'affichage des prix. Vous pouvez faire une représentation en triangle si vous le souhaitez.
* Vous pouvez revoir les performances passées avec le "Mode Historique".
* Ne repeint pas.
* Si les règles du modèle ne sont pas valides, le modèle est supprimé. Si le prix atteint le niveau spécifié, il est possible d'acheter/vendre.
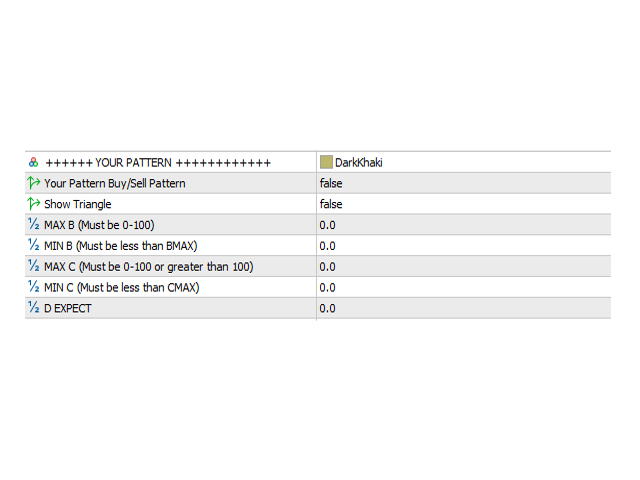
* Remarque : Vous pouvez définir tous les autres modèles sur "faux" et définir vos propres proportions. Vous pouvez tester votre propre modèle avec le mode historique. Si vous êtes satisfait du résultat, vous pouvez l'enregistrer en tant que modèle.
* Motifs:
* Modèle Custon (vos ratios spéciaux)
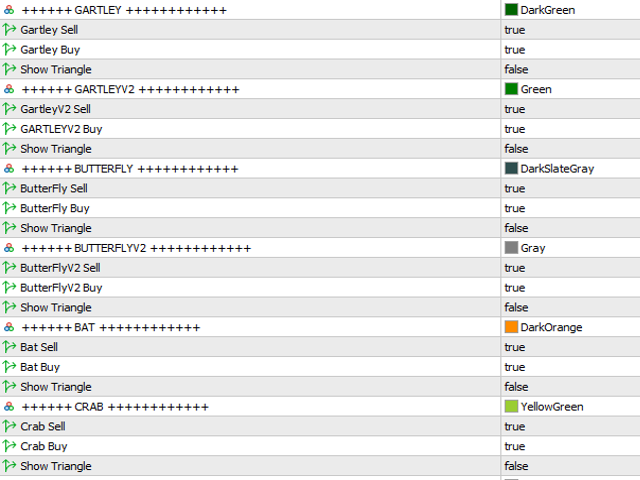
*Gartley
* GarleyV2
* Papillon
* PapillonV2
* chauve souris
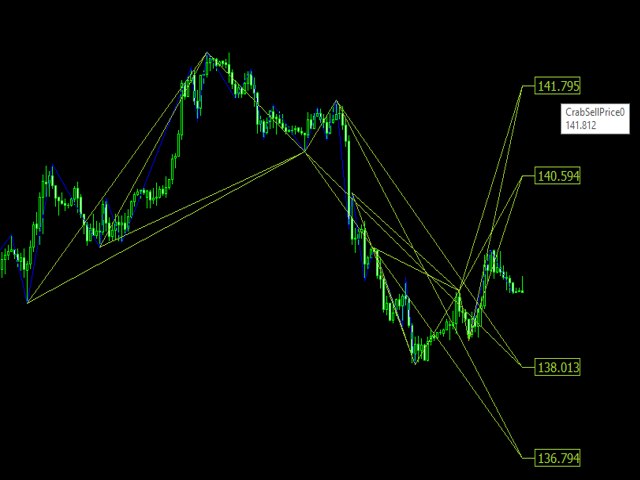
* Crabe
* Crabe profond
* chiffre
* Requin
* Nen Star
* Anti-papillon
* Anti-Chauve-souris
* Anti-crabe
* Anti-chiffrement
* Anti Gartley
* Anti-requin
* Anti-NenStar