TradeArray Scalping
- Indicateurs
-
Wartono
 No body knows. No Big Boy. BUY-SELL is only the wave. Everything will be back to nature.
 - Version: 1.0
- Activations: 10
Un indicateur de trading professionnel avec des options en partie double. De précieuses lignes de canal lisses sur la fenêtre séparée, des lignes de tendance sur la fenêtre principale et des flèches de fenêtre et d'entrée séparées. Bon pour le trading de scalping dans les délais les plus courts. Même cela peut également fonctionner et fournir des signaux dans des délais plus longs pour des périodes de négociation à plus long terme.
RÉGLAGES DES INDICATEURS :
1. Mode signal. Il existe 2 options : Par défaut et Compact. S'il est par défaut, il fournira 3 codes fléchés différents sur la fenêtre principale. Cette option est bonne pour les traders expérimentés qui souhaitent obtenir plus d'opportunités d'entrée. Les lignes de tendance courtes et les flèches sur le graphique sont les indices des zones commerciales. Vous pouvez combiner vos expériences telles que les modèles de graphique ou les niveaux de fibo. Sinon sélectionnez Signal Mode : Compact et suivez les alertes. Compact signifie la combinaison de ces 3 flèches avec une configuration appropriée.
2. Période de tendance. Il s'agit de la période de la tendance principale dans la fenêtre principale et de la tendance dans la fenêtre séparée.
3. Méthode de tendance. Sélectionnez la méthode de tendance ici. Ce sont les pondérations simple, exponentielle, lissée et linéaire. Double-cliquez pour les sélectionner.
4. Prix appliqué tendance. Double-cliquez ici pour sélectionner le prix appliqué de la tendance.
5. Filtre de tendance. Une valeur inférieure sera plus lissée et vice versa
6. Période de canal. Il s'agit de la période de la ligne de canal dans la fenêtre séparée.
7. Méthode de ligne de canal. C'est la méthode de la ligne de canal. (Goldenrod Line)
8. Méthode de canal. Méthode du canal ( Dot et SlateGray Lines)
9. Filtre de canal. Le Filtre de canal. Une valeur inférieure sera plus lissée et vice versa.
10. Déviation de canal. La déviation du canal.
11. Utilisez les barres maximales. Barres totales maximales pour que l'indicateur affiche les tampons sur le graphique. Si vrai, définissez la valeur ci-dessous, sinon l'indicateur affichera des tampons sur toutes les barres. Cela peut ralentir le mt4 au cas où vous l'attacheriez à plusieurs cartes.
12. Barres maximales. Définissez les barres totales comme mentionné au point 11 ci-dessus.
13. Alertes de canal supérieur/inférieur de croisement de ligne. Si vrai, il enverra des alertes chaque fois que les lignes traversent le canal.
14. Alerte contextuelle. Si vrai, cela affichera des alertes sur le graphique.
15. Alerte de notification mobile. Si vrai, il enverra des alertes à mt4 mobile. La configuration d'une alerte mobile est nécessaire.
16. Alerte par e-mail. Si vrai, il enverra des alertes par e-mail. N'oubliez pas de configurer correctement l'e-mail.
COMMENT COMMERCER
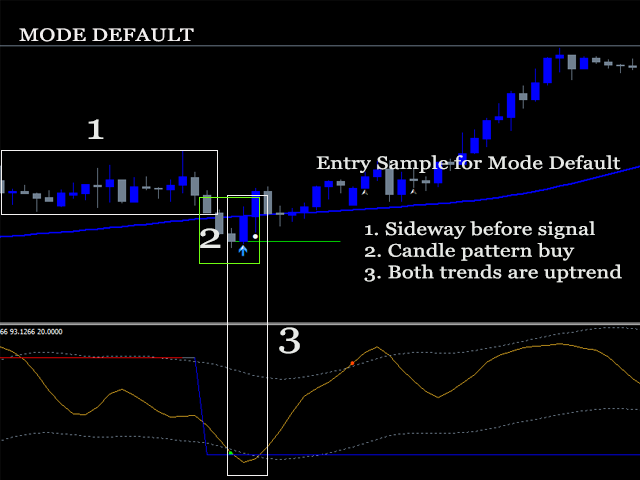
Modes par défaut :
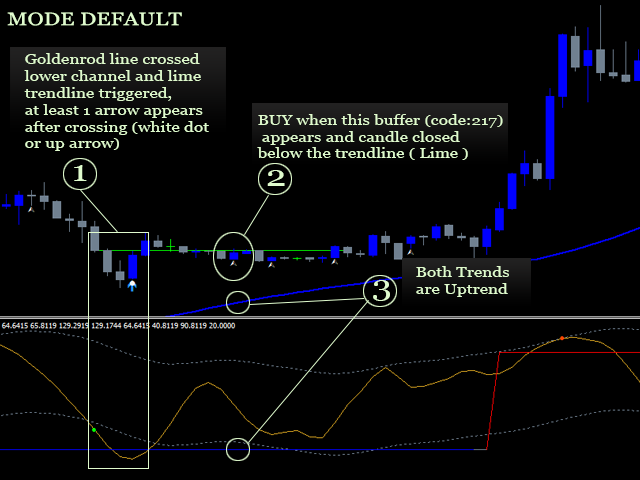
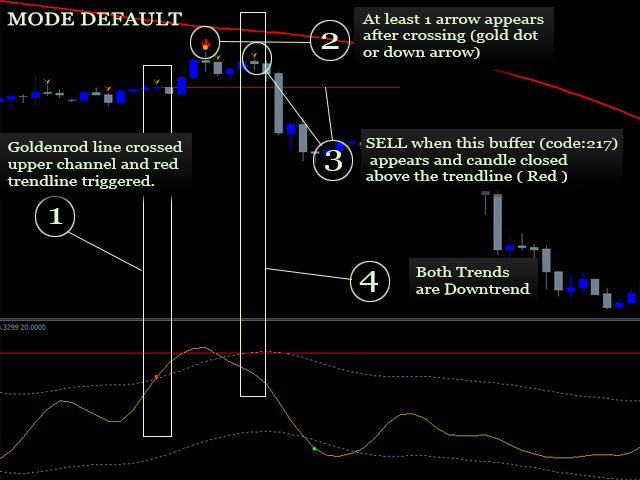
L'indicateur tracera des lignes de tendance courtes sur la fenêtre principale lorsque la ligne Goldenrod dans la fenêtre séparée croise les canaux inférieurs/supérieurs (rouge = surachat et citron vert = survente). Attendre que les flèches apparaissent à ce moment (point ou flèche haut/bas). Veuillez vous assurer que la tendance de la fenêtre séparée et la tendance de la fenêtre principale sont dans la même direction (rouge = tendance baissière et bleu = tendance haussière). Vérifiez les modèles de bougies plus élevés ou les principaux modèles de graphique ou les niveaux fibo, puis ouvrez la position si la flèche 217 est déclenchée et la bougie fermée en dessous de la ligne de tendance de la chaux pour l'achat ou la bougie fermée au-dessus de la ligne de tendance rouge pour la vente. Voir l'image pour plus de détails.
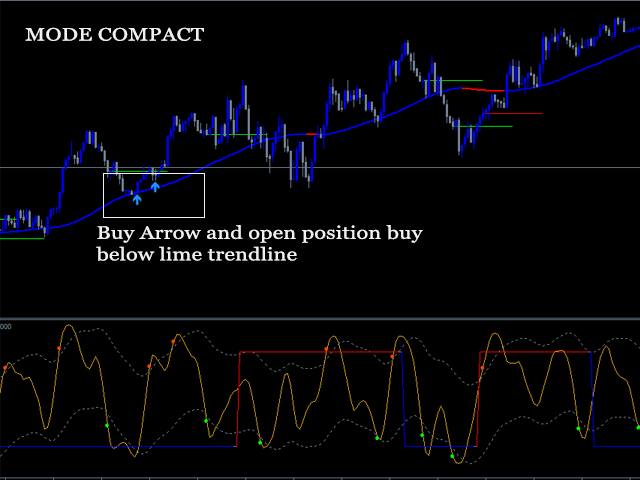
Mode compact :
Définissez simplement le Mode Signal = Compact, et suivez les alertes.
SUGGESTIONS:
1. La session Asie/Europe est le meilleur moment pour trader.
2. Évitez de négocier dans les événements d'actualité très élevés ou 2 à 3 heures avant la clôture du marché ou autour de l'écart de bougie extrême.
3. Continuer la tendance ou le marché latéralement (petites bougies) après le changement de tendance est la meilleure condition d'entrée.
Note: The description above is translated by google. There might be a translation error. Please contact us in english if you have any questions related with indicator.