POscillator Alert

The most sensitive indicator you've ever seen! And now with Alerts

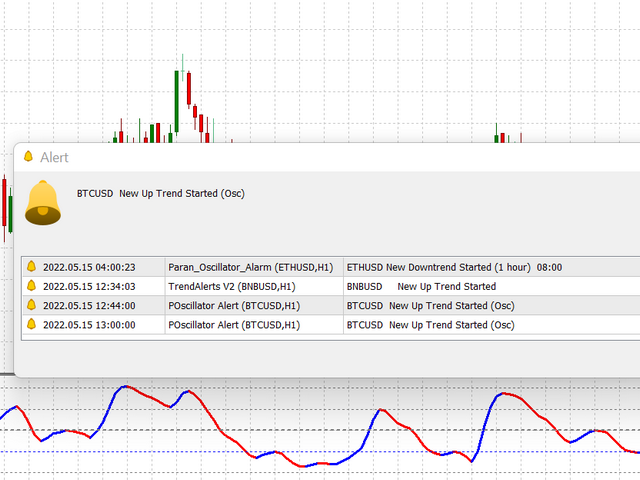
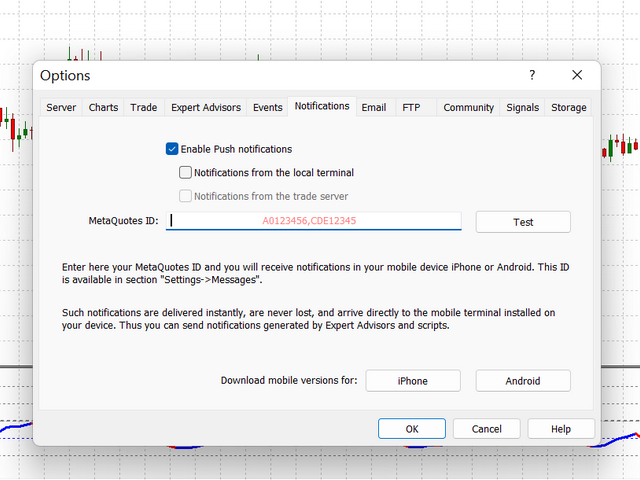
POscillator Alert is a sensitive indicator that finds each trend direction change in every timeframe and then notifies you with the necessary alarms. It's a new version of the POscillator Indicator, with the addition of its alarm sending capability. The Indicator can send multiple alerts: email, mobile phone notification, alert window and alert sound. All of these different alarms are optional and you can choose the ones you wish to use. Now the indicator works for you! Without needing to stare and wait at the monitor, you can simply get alerted (especially from your phone) to notify you of the start of a new trend.

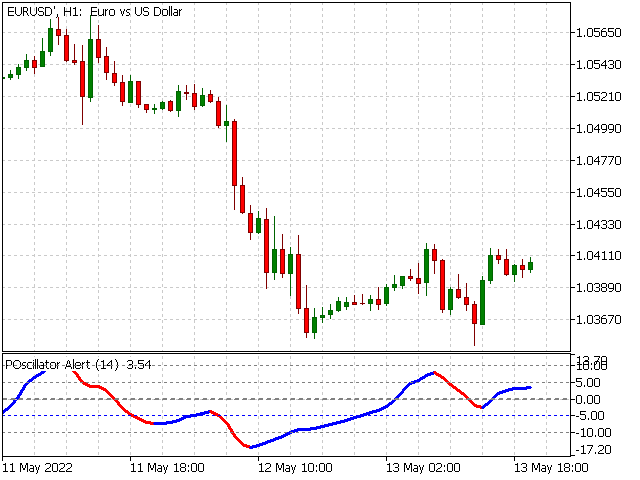
POscillator Alert Indicator emulates price variations and shows up or down trends. At first, the indicator passes the price data through some filters to eliminate sharp and fast changes that make ripples and unnecessary noises. The procedure makes two price functions by using high-frequency and low-frequency filters separately. Then it adds them together to create a smoothed price curve. The final stage of the indicator converts this smoothed curve to an oscillator by calculating its standard variable and multiplies to 5 to make it oscillate around -10 to 10.

The indicator has two different colors for uptrend and downtrend. Therefore, all trends are distinguished from each other. Each trend begins with a color change and continues until the next color change based on the selected timeframe. Every time there is a change of trends, an alert is sent to you (via the manner you selected).

It mainly oscillates between -10 to +10.  The indicator value of -10 shows overbought, and +10 shows oversold conditions. When the indicator crosses one of these lines, we expect a trend change and we can open a limit order and wait to reach the limit price.

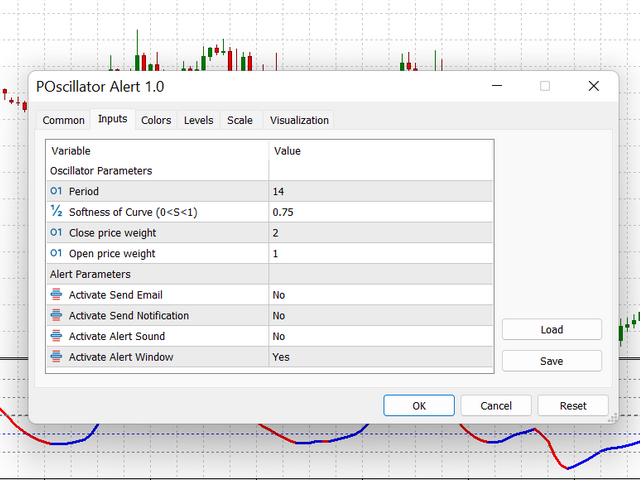
There are two group of input parameters: Oscillator parameters consists of period, Softness, closeX and openX, and Alert  parameters. With a higher value of Softness, the indicator ignores small price changes and low trends. Therefore, the indicator stays at its state longer as an uptrend or downtrend. Open and Close weight factors are used to change price curve form based on the priority of the Open or Close price.

Less Softness, more sensitivity! For softness greater than 0.4, you may have one bar lag. Check the lag first.

No matter what timeframe you choose, it works at M5 as well as H1 or H12.

Attention: You should enable notifications in MetaTrader to receive Email and Mobile Notifications from this indicator. To do so go to Tools menu, select Options, choose Email and add a checkmark to Enable notifications and fill the boxes. Also copy your MetaTrader ID from your mobile phone and paste it to PC version of MetaTrader:

Tools/Options/Email
Tools/Options/Notifications


Input Parameters:

Oscillator Parameters

Period
Number of bars for calculation
Softness
Softness of Indicator 1<S<10
closeX
Close price weight
openX
Open price weight


Alert Parameters

AlertEmail
Activate Send Email
AlertNotf Activate Send Notification
AlertSound Activate Alert Sound
AlertWindow Activate Alert Window


Produits recommandés
DominoSync DoubleSix
Andres Felipe Carvajal Rodriguez
DominoSync DoubleSix : Un Indicateur Avancé pour des Signaux de Trading Fiables DominoSync DoubleSix est un indicateur avancé qui aide les traders à identifier des signaux d'entrée plus fiables en analysant plusieurs temporalités et en filtrant les bougies à faible volume ou à la fourchette atypique. Les signaux d'entrée sont affichés dans l' histogramme de l'indicateur , ce qui permet une analyse plus claire et moins intrusive sur le graphique des prix. Ce Qui Rend DominoSync DoubleSix Unique A
Zones d’offre/demande : zones observables où le prix s’est approché à plusieurs reprises par le passé. Utilitaire multifonctionnel :  66+ fonctionnalités , incluant cet indicateur  |   Contactez-moi  pour toute question  |  Version MT4 L’indicateur montre où le prix pourrait potentiellement s’inverser à nouveau. Généralement, plus le prix a été rejeté à un niveau, plus ce niveau est significatif. Dans les paramètres d’entrée   vous pouvez ajuster : Activer ou désactiver les zones faibles ; Affi
Trends Shift
Maryna Shulzhenko
Trend Shift is a very interesting trend indicator. The Trend Shift indicator helps you identify either a new or existing trend. One of the advantages of the indicator is that it quickly adjusts and reacts to various chart changes. Of course, this depends on the settings. The larger it is, the smoother the wave the trend line will be. The shorter the period, the more market noise will be taken into account when creating the indicator. The goal that was pursued during its creation is to obtain si
Heiken Ashi Smoothed Strategy is a very simple but powerful system to get forex market trend direction. This indicator is actually 2 indicators in 1 pack, Heiken Ashi and Heiken Ashi Smoothed Moving Average both included. Because HA (Heiken Ashi) and HAS (Heiken Ashi Smoothed) are calculated in the same one system event with necessary buffers and loop only, so it is the FAST, OPTIMIZED and EFFICIENT HA having the combined indicator of MetaTrader 5. You can choose to display HA and HAS in the sam
Volume Profile V6
Andrey Kolesnik
4.67 (3)
Indicateur de profil de volume de marché + oscillateur intelligent. Fonctionne sur pratiquement tous les instruments — paires de devises, actions, futures, crypto-monnaies, sur volumes réels et sur ticks. Il est possible de configurer la définition automatique de la plage de construction du profil (par exemple, pour une semaine ou un mois, etc.), ou de définir la plage manuellement en déplaçant les limites (deux lignes verticales : rouge et bleue). L'affichage se fait sous forme d'histogramme. L
Clever Parabolic RSI Un oscillateur intelligent combinant Parabolic SAR et RSI pour des signaux de marché précis Cet oscillateur fusionne la puissance de deux indicateurs techniques populaires — Parabolic SAR et RSI — pour créer un système intelligent qui affiche clairement l’ état du marché , la force de la tendance et fournit des signaux d’achat ou de vente fiables . Fonctionnement : Un point carré vert indique le début d’une tendance haussière Un point carré rouge signale le débu
ESS Enguifing Strategy Signals
William Oswaldo Mayorga Urduy
SIGNAUX STRATÉGIQUES ENGUIFANTS DU SSE Cet indicateur détecte les bougies de type enveloppe auxquelles un filtre est appliqué, ce filtre est composé de 3 stratégies ensemble, avec lesquelles il est possible d'identifier la plus grande efficacité possible dans les paramètres mesurables. Les signaux sont indiqués par des flèches vers le haut et vers le bas pour chacune des directions, et vous pouvez également activer ou désactiver les alertes, les e-mails et les messages push vers le mobile. I
Buy Sell Smart
Syamsurizal Dimjati
BUY and SELL smart The BUY and SELL Smart Indicator is a next-generation trading tool engineered for precision scalpers, intraday strategists, and professional analysts who demand both speed and clarity in market visualization. It seamlessly integrates smart candle-based analytics, adaptive ATR logic, and real-time economic event awareness — giving you a fully synchronized view of market volatility and momentum. Through an elegant and optimized interface, FlashScalp delivers   instant signal fee
HMA Trend Professional MT5
Pavel Zamoshnikov
4.25 (4)
Improved version of the free HMA Trend indicator (for MetaTrader 4) with statistical analysis. HMA Trend is a trend indicator based on the Hull Moving Average (HMA) with two periods. HMA with a slow period identifies the trend, while HMA with a fast period determines the short-term movements and signals in the trend direction. The main differences from the free version: Ability to predict the probability of a trend reversal using analysis of history data. Plotting statistical charts for analyzi
Indicateur Crypto_Forex « Histogramme de correction de tendance » pour MT5. - L'histogramme de correction de tendance peut être de 2 couleurs : rouge pour une tendance baissière et bleu pour une tendance haussière. - 7 colonnes d'histogramme consécutives de la même couleur signifient le début d'une nouvelle tendance. - L'indicateur d'histogramme de correction de tendance est conçu dans le but principal de minimiser les pertes et de maximiser les profits. - Il a le paramètre "Période", responsab
The Accumulation and Distribution indicator is a volume-based indicator that was essentially designed to measure underlying supply and demand. This is accomplished by trying to determine whether traders are actually accumulating (buying) or distributing (selling). This is accomplished by plotting a cumulative total of the money flow volume for each period. This indicator can reveal divergences between volume flow and actual price to primarily affirm a current trend or to anticipate a future reve
Ekom Spike Detector Pro
Tangu Cedrick Ndam
5 (2)
Ekom   Spike Detector Pro Take your trading to the next level with the Ekom Boom and Crash Spike Detector Indicator Pro, designed for serious traders who demand more. This advanced version provides: Key Features: Accurate Spike Detection:  Identify high-probability spike patterns in real-time using price action Clear Visual Signals: Displays clear buy and sell arrows on the chart for easy decision-making Alert options :        MT5 Alert/Notification to receive alerts on your mobile when signal
French Cet indicateur agit comme un assistant d'analyse graphique avancé pour les traders qui aiment trader les figures graphiques (Chart Patterns). Il est conçu pour réduire la charge de l'analyse visuelle et augmenter la précision de la prise de profit. Caractéristiques principales de cet indicateur du point de vue de l'utilisation pratique : 1. Détection automatique des figures (Automated Pattern Detection) Gain de temps et réduction des biais : Vous n'avez pas besoin de tracer manuellement d
FXC iMACD-DivergencE MT5 Indicator This is an advanced MACD indicator that finds trend-turn divergences on the current symbol. The indicator detects divergence between the MACD and the price movements as a strong trend-turn pattern. Main features: Advanced divergence settings Price based on Close, Open or High/Low prices Give Buy/Sell open signals PUSH notifications E-mail sending Pop-up alert Customizeable Information panel Input parameters: MACD Fast-EMA: The Fast-EMA variable of the MACD indi
Normalized Volume99% of indicators are based on price analysis. This indicator is based on volume. Volume is overlooked piece of information in most trading systems. And this is a big mistake since volume gives important information about market participants. Normalized Volume is an indicator that can be used to confirm reversal points. The indicator code volume with colors indicating high, normal and low volume. You could enhance dramatically your trading system using volume analysis.  Inputs
TRI Visualizer
Yoshimi Mon 三 Ura
TRI Visualizer MT5 – Thermodynamic Market Analysis Overview The TRI (Thermal Range Indicator) Visualizer Enhanced is a rare market analysis indicator that goes beyond conventional technical analysis, applying principles of thermodynamics from physics. It interprets market price fluctuations as “thermodynamic energy,” enabling the highly accurate detection of subtle market changes that are often overlooked. Innovative Mechanisms 1. Dual Calculation Engines Classic TRI Mode Formula: |Close
Smart Money Flow Indicator – Professional SMC Analysis Tool The Smart Money Flow Indicator is designed for traders who want to apply institutional-grade market analysis directly in MetaTrader. It automatically detects key Smart Money Concept (SMC) patterns and levels, helping you identify high-probability trading opportunities with clarity and precision. Features: Automatic Fair Value Gap detection Order Block identification (bullish and bearish) Break of Structure signals Multi-timeframe suppor
Weis Wave Scouter
Jean Carlos Martins Roso
Découvrez la puissance de l'analyse avancée du volume avec le Weis Wave Scouter, un indicateur révolutionnaire pour MetaTrader 5 combinant les principes éprouvés de la méthode Wyckoff et de l'analyse VSA (Volume Spread Analysis). Conçu pour les traders recherchant précision et profondeur, cet indicateur fournit une lecture tactique du marché via l'analyse des vagues de volume cumulatif, aidant à identifier les points clés de retournement et de continuation de tendance. Le Weis Wave Scouter propo
This indicator shows the ratio of the number of buyers'/sellers' orders for the Russian FORTS futures market. Now, you can receive this information in real time in your МetaТrader 5 terminal. This allows you to develop brand new trading strategies or improve the existing ones. The data on the ratio of the orders number is received from the database (text CSV or binary one at user's discretion). Thus, upon completion of a trading session and disabling the terminal (or PC), the data is saved and u
AI Daily Trend
Niccyril Chirindo
AI Trading Dashboard - Retracement Signal Indicator for BOOM & CRASH Plaese Leave  Review OVERVIEW Technical analysis indicator for BOOM, CRASH synthetic indices. Monitors daily trends and identifies retracement entry points based on configurable parameters. KEY FEATURES Signal Generation • BUY signals on BOOM indices during uptrend pullbacks • SELL signals on CRASH  indices during downtrend bounces • Adjustable retracement threshold (default: 10 pips, can set to 20-30+ pips) • Signal cooldow
Be notified of every color change of Heiken Ashi (HA) candles. The indicator will trigger past and new signals every time that HA candles change their colors. ( Note : this tool is based on the code of Heiken Ashi indicator developed by MetaQuotes Software Corp.) Features The signals are triggered at closing of last bar/opening of a new bar; Any kind of alerts can be enabled: Dialog Box, Email message, SMS notifications for smartphones and tablets, and Sound alerts; By default, up arrows are pl
Visual Silver Turn Indicator
AL MOOSAWI ABDULLAH JAFFER BAQER
Empower Your Trading with the Visual Silver Turn Indicator! The Visual Silver Turn Indicator is designed to identify pivotal market turning points with precision. By analyzing price action dynamics and trend shifts, this indicator provides traders with an intuitive tool to locate potential reversal zones and opportunities. Perfect for traders looking to gain insights into market behavior, the Visual Silver Turn Indicator is an essential addition to your trading arsenal. Logic Behind the Strateg
KT Volume Profile MT5
KEENBASE SOFTWARE SOLUTIONS
KT Volume Profile affiche les données d'accumulation de volume sous forme d'histogramme sur l'axe Y, ce qui permet d'analyser l'activité de trading selon les périodes et les niveaux de prix. Point de Contrôle (POC) dans un Profil de Volume Le POC représente le niveau de prix avec le volume échangé le plus élevé dans l'ensemble du profil. Il est souvent utilisé comme niveau de support/résistance ou comme point de test avant un mouvement directionnel. Fonctionnalités Très facile à utiliser. Glis
PipFinite Binary Options PRO MT5
Karlo Wilson Vendiola
4.29 (14)
This LEGIT Indicator Can Accurately Predict the Outcome of One Bar. Imagine adding more filters to further increase your probability! Unlike other products, Binary Options PRO can analyze past signals giving you the statistical edge. How Increase Your Probability Information revealed here www.mql5.com/en/blogs/post/727038 NOTE: The selection of a Good Broker is important for the overall success in trading Binary Options. Benefits You Get Unique algorithm that anticipates price weakness. Gene
Crash 900 Precision Spike Detector The Crash 900 Precision Spike Detector is your ultimate tool for trading the Crash 900 market with precision and confidence. Equipped with advanced features, this indicator helps you identify potential sell opportunities and reversals, making it an essential tool for traders aiming to capture spikes with minimal effort. Key Features: Non-Repainting Signals: Accurate, non-repainting signals that you can trust for reliable trading decisions. Audible Alerts: Stay
AureX Indicator
Hassan Abdullah Hassan Al Balushi
AureX Indicator AureX Indicator is a technical analysis tool for MetaTrader 5. It is based on a momentum‑style oscillator that measures price accelerates and decelerates. The indicator is designed to: calculate a smoothed internal momentum curve from price data highlight regular, hidden and exaggerated divergence between price and the oscillator mark areas where price movement and internal momentum are not aligned AureX is intended to support your own market analysis and trading plan. It does no
POC Delta Order Blocks is a rule-based order block and volume-delta indicator designed to help traders clearly understand where real trading activity happened and how price reacts around those zones . Instead of drawing generic candle-based blocks, this indicator uses a Point of Control (POC) approach to identify the most actively traded price level between a swing high/low and a confirmed Break of Structure (BOS). The order block is then anchored to the earliest valid candle that interacted wit
Avoid false signals with three cycles + filters — a powerful market-context panel with mobile notifications . A major reason many traders lose is poor “market context” — entering against the trend, or taking unnecessary trades inside ranges. Flat Stochastic Cycle is a professional MT5-only indicator that simultaneously monitors three stochastic time horizons (short / mid / long) and adds strong MACD and ADX filters , so it shows only the highest-probability points via arrow signals and a dashboa
Bar Size Pro
Makarii Gubaydullin
Calcule la variation de prix sur chaque timeframe : barres flottantes ou dernières barres fermées. Utilitaire multifonctionnel : 66+ fonctionnalités, incluant cet outil  |   Contactez-moi  si vous avez des questions  |    Version MT4 Vous pouvez sélectionner le   décalage   de la barre calculée : Barres flottantes (actuelles); Dernières barres fermées (précédentes); Le type de valeur de prix   peut être sélectionné avec le commutateur bleu en haut : Pips; Points de marché; Valeur en pourcentage
This indicator presents an alternative approach to identify Market Structure. The logic used is derived from learning material created by   DaveTeaches (on X) Upgrade v1.10: + add option to put protected high/low value to buffer (figure 11, 12) + add  Retracements  value to buffer when Show Retracements When quantifying Market Structure, it is common to use fractal highs and lows to identify "significant" swing pivots. When price closes through these pivots, we may identify a Market Structure S
Les acheteurs de ce produit ont également acheté
SuperScalp Pro
Van Minh Nguyen
4.57 (21)
SuperScalp Pro – Système avancé d’indicateur de scalping multi-filtres SuperScalp Pro est un indicateur de scalping avancé qui combine le Supertrend classique avec plusieurs filtres de confirmation intelligents afin d’identifier les opportunités de trading. Il fonctionne efficacement sur plusieurs unités de temps, de M1 à H4, avec des performances optimisées sur XAUUSD, BTCUSD et les principales paires Forex. L’indicateur fournit des signaux d’achat et de vente clairs, ainsi que des niveaux d’en
Divergence Bomber
Ihor Otkydach
4.9 (86)
Chaque acheteur de cet indicateur reçoit également gratuitement : L’outil exclusif « Bomber Utility », qui accompagne automatiquement chaque opération de trading, fixe les niveaux de Stop Loss et de Take Profit, et clôture les positions selon les règles de la stratégie Des fichiers de configuration (set files) pour adapter l’indicateur à différents actifs Des set files pour configurer le Bomber Utility selon différents modes : « Risque Minimum », « Risque Équilibré » et « Stratégie d’Attente » U
Entry In The Zone and SMC Multi Timeframe is a real-time 2-in-1 market analysis tool that combines market structure analysis and a No Repaint BUY / SELL signal system into a single indicator, built on Smart Money Concepts (SMC) — a widely adopted framework used by professional traders to understand market structure. This indicator helps you see the market more clearly, make decisions based on structure rather than guesswork, and focus on high-probability zones where price is more likely to react
Azimuth Pro
Ottaviano De Cicco
5 (6)
Azimuth Pro V2: Synthetic Fractal Structure and Confirmed Entries for MT5 Overview Azimuth Pro is a multi-level swing structure indicator by Merkava Labs . Four nested swing layers, swing-anchored VWAP, ABC pattern detection, three-timeframe structural filtering, and closed-bar confirmed entries — one chart, one workflow from micro-swings to macro-cycles. This is not a blind signal product. It is a structure-first workflow for traders who care about location, context, and timing. V2 Launch Offe
Quantum TrendPulse
Bogdan Ion Puscasu
5 (23)
Présentation de   Quantum TrendPulse   , l'outil de trading ultime qui combine la puissance de   SuperTrend   ,   RSI   et   Stochastic   dans un seul indicateur complet pour maximiser votre potentiel de trading. Conçu pour les traders qui recherchent précision et efficacité, cet indicateur vous aide à identifier les tendances du marché, les changements de dynamique et les points d'entrée et de sortie optimaux en toute confiance. Caractéristiques principales : Intégration SuperTrend :   suivez f
Power Candles MT5
Daniel Stein
4.75 (8)
Power Candles – Signaux d’entrée basés sur la force pour tous les marchés Power Candles intègre l’analyse de force éprouvée de Stein Investments directement dans le graphique des prix. Au lieu de réagir uniquement au prix, chaque bougie est colorée en fonction de la force réelle du marché, ce qui permet d’identifier instantanément les phases de momentum, l’accélération de la force et les transitions de tendance propres. Une logique unique pour tous les marchés Power Candles fonctionne automatiqu
Gann Made Easy   est un système de trading Forex professionnel et facile à utiliser qui est basé sur les meilleurs principes de trading en utilisant la théorie de mr. WD Gann. L'indicateur fournit des signaux d'ACHAT et de VENTE précis, y compris les niveaux Stop Loss et Take Profit. Vous pouvez échanger même en déplacement en utilisant les notifications PUSH. VEUILLEZ ME CONTACTER APRÈS L'ACHAT POUR RECEVOIR GRATUITEMENT DES INSTRUCTIONS DE TRADING ET D'EXCELLENTS INDICATEURS SUPPLÉMENTAIRES! V
OmniSync Projection
Antonio-alin Teculescu
5 (1)
Chronos Fractal Engine is an innovative price projection indicator for MetaTrader 5, designed to transform your technical analysis by intelligently identifying and projecting historical price patterns. Built upon an advanced correlation algorithm and the fractal principles of the market, this powerful tool visualizes potential future price movements, giving you a unique edge in your trading decisions. What is Chronos Fractal Engine? At its core, the Chronos Fractal Engine employs a sophisticat
Si vous achetez cet indicateur, vous recevrez mon Gestionnaire de Trading Professionnel + EA  GRATUITEMENT. Tout d'abord, il convient de souligner que ce système de trading est un indicateur non repeint, non redessiné et non retardé, ce qui le rend idéal pour le trading manuel et automatisé. Cours en ligne, manuel et téléchargement de préréglages. Le "Système de Trading Smart Trend MT5" est une solution de trading complète conçue pour les traders débutants et expérimentés. Il combine plus de 10
Présentation       Quantum Breakout PRO   , l'indicateur révolutionnaire MQL5 qui transforme la façon dont vous négociez les zones d'évasion ! Développé par une équipe de traders expérimentés avec une expérience commerciale de plus de 13 ans,       Évasion quantique PRO       est conçu pour propulser votre parcours commercial vers de nouveaux sommets grâce à sa stratégie de zone de discussion innovante et dynamique. Quantum Breakout Indicator vous donnera des flèches de signalisation sur les z
Grabber System MT5
Ihor Otkydach
4.83 (23)
Je vous présente un excellent indicateur technique : Grabber, qui fonctionne comme une stratégie de trading "tout-en-un", prête à l'emploi. En un seul code sont intégrés des outils puissants d'analyse technique du marché, des signaux de trading (flèches), des fonctions d'alerte et des notifications push. Chaque acheteur de cet indicateur reçoit également gratuitement : L'utilitaire Grabber : pour la gestion automatique des ordres ouverts Un guide vidéo étape par étape : pour apprendre à installe
FX Trend MT5 NG
Daniel Stein
5 (4)
FX Trend NG : La Nouvelle Génération d’Intelligence de Tendance Multi-Marchés Vue d’ensemble FX Trend NG est un outil professionnel d’analyse de tendance multi-timeframe et de surveillance des marchés. Il vous permet de comprendre la structure complète du marché en quelques secondes. Au lieu de naviguer entre de nombreux graphiques, vous identifiez immédiatement quels instruments sont en tendance, où le momentum s’affaiblit et où plusieurs unités de temps sont alignées. Offre de Lancement – Ob
Commençons par être honnêtes. Aucun indicateur ne vous rendra rentable à lui seul. Si quelqu’un vous dit le contraire, il vous vend un rêve. Tout indicateur qui affiche des flèches parfaites d’achat/vente peut être rendu impeccable — il suffit de zoomer sur la bonne partie de l’historique et de capturer uniquement les trades gagnants. Nous ne faisons pas cela.  SMC Intraday Formula est un outil. Il lit la structure du marché pour vous, identifie les zones de prix à la probabilité la plus élevée
Voyez quelle strategie fonctionne reellement sur votre symbole - avant de risquer de l'argent reel. Power Bar detecte les barres de prix extremes sur n'importe quel symbole et n'importe quel timeframe, puis backteste instantanement 3 strategies de trading differentes pour que vous puissiez comparer les taux de reussite, les facteurs de profit et les P&L cote a cote. Le tout dans un seul panneau interactif. Pas de suppositions. Pas de suroptimisation. Juste des donnees. Qu'est-ce qui rend Power
CGE Trading Suite
Carl Gustav Johan Ekstrom
5 (2)
Institutional-Grade Analytics for MT5 C GE Trading Suite delivers the analytical edge typically reserved for professional trading desks. The platform integrates a full suite of analytical tools into one seamless workflow: dynamic grid mapping, liquidity behavior analysis, ECM, trend lines, MIDAS, trade cycles, and directional channel projections. Together, these provide a unified view of market structure and momentum. Directional clarity is further enhanced by the capital flow index, which meas
Atomic Analyst MT5
Issam Kassas
3.94 (31)
Tout d'abord, il convient de souligner que cet indicateur de trading n'est ni repainting, ni redrawing et ne présente aucun délai, ce qui le rend idéal à la fois pour le trading manuel et automatisé. Manuel de l'utilisateur : réglages, entrées et stratégie. L'Analyste Atomique est un indicateur d'action sur les prix PA qui utilise la force et le momentum du prix pour trouver un meilleur avantage sur le marché. Équipé de filtres avancés qui aident à éliminer les bruits et les faux signaux, et à
Trend Screener Pro MT5
STE S.S.COMPANY
4.85 (104)
Indicateur de tendance, solution unique révolutionnaire pour le trading et le filtrage des tendances avec toutes les fonctionnalités de tendance importantes intégrées dans un seul outil ! Il s'agit d'un indicateur multi-période et multi-devises 100 % non repeint qui peut être utilisé sur tous les symboles/instruments : forex, matières premières, crypto-monnaies, indices et actions. Trend Screener est un indicateur de suivi de tendance efficace qui fournit des signaux de tendance fléchés avec des
FX Power MT5 NG
Daniel Stein
5 (31)
FX Power : Analysez la force des devises pour des décisions de trading plus intelligentes Aperçu FX Power est l'outil essentiel pour comprendre la force réelle des principales devises et de l'or, quelles que soient les conditions du marché. En identifiant les devises fortes à acheter et les faibles à vendre, FX Power simplifie vos décisions de trading et révèle des opportunités à forte probabilité. Que vous suiviez les tendances ou anticipiez les retournements à l'aide de valeurs extrêmes de D
Btmm state engine pro
Garry James Goodchild
5 (4)
BTMM State Engine Pro is a MetaTrader 5 indicator for traders who use the Beat The Market Maker approach: Asian session context, kill zone timing, level progression, peak formation detection, and a multi-pair scanner from a single chart. It combines cycle state logic with a built-in scanner dashboard so you do not need the same tool on many charts at once. What it does Draws the Asian session range; session times can follow broker server offset or be set in inputs. Tracks level progression (L
Crystal Heikin Ashi Signals
Muhammad Jawad Shabir
5 (2)
Crystal Heikin Ashi Signals - Professional Trend & Signal Detection Indicator Advanced Heikin Ashi Visualization with Intelligent Signal System for Manual & Automated Trading Final Price: $149 ---------> Price goes up $10 after every 10 sales . Limited slots available — act fast . Overview Crystal Heikin Ashi Signals is a professional-grade MetaTrader 5 indicator that combines pure Heikin Ashi candle visualization with an advanced momentum-shift detection system. Designed for both manual traders
Berma Bands
Muhammad Elbermawi
5 (8)
L'indicateur Berma Bands (BB) est un outil précieux pour les traders qui cherchent à identifier et à capitaliser sur les tendances du marché. En analysant la relation entre le prix et les BB, les traders peuvent déterminer si un marché est dans une phase de tendance ou de range. Visitez le [ Berma Home Blog ] pour en savoir plus. Les bandes de Berma sont composées de trois lignes distinctes : la bande de Berma supérieure, la bande de Berma moyenne et la bande de Berma inférieure. Ces lignes sont
Meridian Pro
Ottaviano De Cicco
5 (1)
Meridian Pro: Professional Multi-Timeframe Trend Matrix for MT5 Overview Meridian Pro is a multi-timeframe trend matrix by Merkava Labs that compresses directional state, strength, momentum condition and matrix agreement into one compact panel. One adaptive engine, applied consistently from M1 to W1. No per-symbol tuning. No indicator stacking. One structured readout across every asset and every timeframe. Launch Offer — Get Meridian Pro for USD 99 (introductory). Regular price: USD 149. 1. Why
Bill Williams Advanced
Siarhei Vashchylka
5 (11)
Bill Williams Advanced is designed for automatic chart analysis using Bill Williams' "Profitunity" system. The indicator analyzes four timeframes at once. Manual (Be sure to read before purchasing) Advantages 1. Analyzes the chart using Bill Williams' "Profitunity" system. Signals are displayed in a table in the corner of the screen and on the price chart. 2. Finds all known AO and AC signals, as well as zone signals. Equipped with a trend filter based on the Alligator. 3. Finds "Divergence Bar
Auto Optimized Parabolic RSI : Moteur de Momentum 3D Avancé La plupart des indicateurs pour les particuliers échouent car ils s'appuient sur des paramètres statiques qui se brisent dès que la volatilité du marché change. L'Auto Optimized Parabolic RSI résout le problème de l'« obsolescence des indicateurs » en recalculant continuellement son propre avantage mathématique, apportant une adaptation quantitative de niveau institutionnel directement sur votre terminal MT5. L'Avantage Principal : Opti
Market Structure Order Block Dashboard MT5 est un indicateur MT5 conçu pour les traders qui veulent lire la structure de marché et les principales zones de réaction du prix directement sur le graphique. Il combine BOS, ChoCH, Order Blocks, Fair Value Gaps (FVG), Liquidité, Kill Zones, Volume Profile, et un dashboard compact pour une analyse rapide. Cet indicateur s’adresse aux traders qui utilisent la structure de marché, les concepts ICT et Smart Money comme cadre de décision. Il peut aider à r
ARICoins
Temirlan Kdyrkhan
ARICoin is a powerful trading companion designed to generate high-probability entry signals with dynamic TP/SL/DP levels based on volatility. Built-in performance tracking shows win/loss stats, PP1/PP2 hits, and success rates all updated live. Key Features: Buy/Sell signals with adaptive volatility bands Real-time TP/SL/DP levels based on ATR Built-in MA Filter with optional ATR/StdDev volatility Performance stats panel (Success, Profit/Loss, PP1/PP2) Alerts via popup, sound, push, or email Cust
ARIPoint
Temirlan Kdyrkhan
ARIPoint is a powerful trading companion designed to generate high-probability entry signals with dynamic TP/SL/DP levels based on volatility. Built-in performance tracking shows win/loss stats, PP1/PP2 hits, and success rates all updated live. Key Features: Buy/Sell signals with adaptive volatility bands Real-time TP/SL/DP levels based on ATR Built-in MA Filter with optional ATR/StdDev volatility Performance stats panel (Success, Profit/Loss, PP1/PP2) Alerts via popup, sound, push, or email Cu
SignalTech MT5 is a trading system for EURUSD, USDCHF, USDJPY, AUDUSD, NZDUSD, EURJPY, AUDJPY, NZDJPY, CADJPY H2 and H3 Timeframe.  It can generate signals with Buy/Sell Arrows and Pop-Up/Sound Alerts. Each signal has clear Entry and Stop Loss levels, which should be automatically flagged on the chart, as well as potential Targets 1, 2, and 3. The Entry and TP levels are fixed after the trade is taken. The exit level is dynamic. If there are signs of a potential short-term trend reversal, the
Smart Stop Indicator – Précision intelligente du stop-loss directement sur votre graphique Présentation Smart Stop Indicator est la solution idéale pour les traders qui souhaitent placer leur stop-loss de manière claire et méthodique, sans deviner ni suivre leur intuition. Cet outil combine la logique classique de price action (succession de plus hauts et de plus bas) avec une reconnaissance moderne des cassures pour identifier le prochain niveau de stop réellement logique. Que le marché soit
Market Structure Patterns
Samuel Manoel De Souza
4.47 (19)
Disponible pour   MT4   et   MT5 . Rejoignez le canal Market Structure Patterns pour télécharger des documents d'étude et/ou des informations supplémentaires. Articles connexes : Market Structure Patterns - Introdução Beyond Fancy Order Blocks: Using True Volumetric Analysis with Market Structure Patterns & Timeless Charts Market Structure Patterns – Complete SMC Indicator Guide (Concepts + Settings) Market Structure Patterns   est un indicateur basé sur les   Smart Money Concepts   qui affich
Plus de l'auteur
The most sensitive indicator you've ever seen . . . POscillator is a sensitive indicator to find each trend direction change in every timeframe. It shows price variations and reveals up or down trends. POscillator makes a price curve based on frequency filters. The procedure makes two price functions by using high-frequency and low-frequency filters separately. Then it adds them together to create a smoothed price curve. The final stage of the indicator converts this smoothed curve to an oscil
FREE
New Trend Alerts finds new trends at the changing bar very quickly. If the trend has enough power and a quality up/down angle, then the indicator sends multiple alarms to alert you: via email, mobile notification, alert window and alert sound. All of these different alarms are optional, and you can choose which ones you would like to use. The indicator calculates the derivative of the price chart to reveal the slope of price curve and its sign changes. Red bars indicate a positive sign or uptre
Filtrer:
Aucun avis
Répondre à l'avis