Supply Demand areas
- Indicateurs
-
Makarii Gubaydullin
 Assistant de Trading Multifonction
MT5: https://www.mql5.com/fr/market/product/71145 - Version: 1.20
- Mise à jour: 7 mars 2023
- Activations: 5
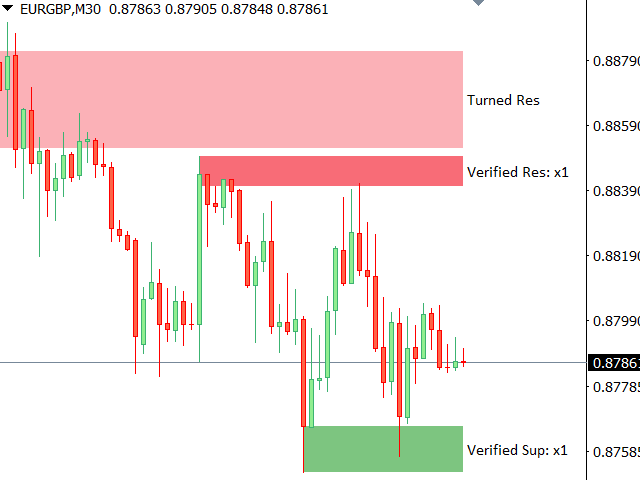
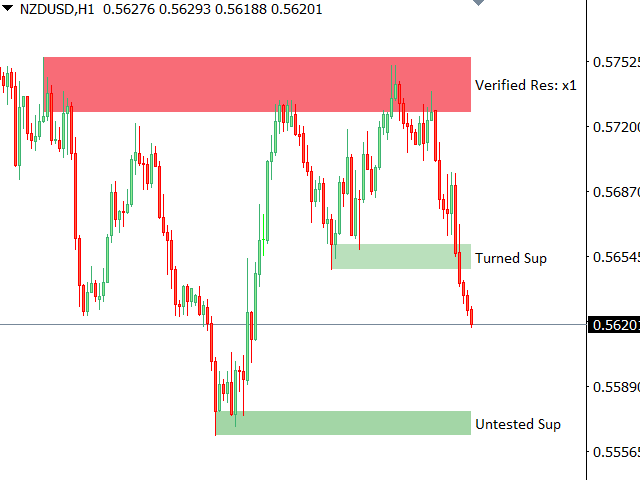
Zones d’offre/demande : zones observables où le prix s’est approché à plusieurs reprises par le passé.
Utilitaire multifonctionnel : 66+ fonctionnalités, incluant cet indicateur | Contactez-moi pour toute question | Version MT4
L’indicateur montre où le prix pourrait potentiellement s’inverser à nouveau.
Généralement, plus le prix a été rejeté à un niveau, plus ce niveau est significatif.
Dans les paramètres d’entrée vous pouvez ajuster :
- Activer ou désactiver les zones faibles ;
- Afficher ou masquer la description de la zone ;
- Taille de la police ;
- Définir la couleur de base : séparément pour le support et la résistance :
la couleur sélectionnée sera moins intense pour les zones faibles, ce qui vous aidera à analyser visuellement le graphique ; - Intervalle de temps pour calculer les zones ;
Les zones d'offre et de demande sont des zones clés sur un graphique de prix où des achats (demande) ou des ventes (offre) significatifs se sont produits auparavant. Ces zones aident les traders à anticiper d'éventuels renversements ou continuations des mouvements de prix. Le trading basé sur l'offre et la demande fonctionne mieux lorsqu'il est combiné à d'autres outils comme les lignes de tendance, les moyennes mobiles ou l'analyse du flux d'ordres.
Comment identifier les zones d'offre et de demande :
Zones de demande (Pression acheteuse)
-
Formation : Un fort mouvement haussier après une baisse.
-
Comment les marquer :
-
Une forte hausse des prix (base).
-
La base avant la hausse est la zone de demande.
-
Un rectangle de la mèche la plus basse à la zone de consolidation.
-
Zones d'offre (Pression vendeuse)
-
Formation : Un fort mouvement baissier après une tendance haussière.
-
Comment les marquer :
-
Une forte baisse après une hausse.
-
La base avant la baisse est la zone d'offre.
-
Un rectangle de la mèche la plus haute à la zone de consolidation.
-
Règles clés :
- Les zones doivent avoir un mouvement fort et rapide les quittant.
- Plus le mouvement initial est fort, plus la zone est significative.
- Les zones fraîches (non testées) sont plus fiables.
Comment trader les zones d'offre et de demande :
A) Trader les rebonds (Trades de renversement)
-
Entrée en zone de demande : Acheter près de la zone avec un stop-loss en dessous.
-
Entrée en zone d'offre : Vendre près de la zone avec un stop-loss au-dessus.
-
Take Profit : Objectifs sur les précédents plus hauts/plus bas ou ratio risque/récompense (ex. 1:2 ou 1:3).
B) Trader les breakouts (Trades de continuation)
-
Si le prix casse une zone de demande, elle peut devenir une zone d'offre (et vice versa).
-
Entrer en vente sur cassure confirmée sous la demande ou en achat au-dessus de l'offre.
Renforcer vos zones :
-
Confluence de timeframe : Les zones sur des timeframes plus élevés (Quotidien, H4) sont plus fortes.
-
Multiples tests : Les zones qui résistent à plusieurs tests s'affaiblissent.
-
Confirmation de volume : Un volume élevé dans la zone augmente sa validité.