Heikin Ashi MACD
- Indicateurs
-
Wojciech Daniel Knoff
 Hello everyone, I plan trades by combining market structure analysis with trend-reversal signals. I prioritize risk-managed entries, clear invalidation points, and consistent money management.
 - Version: 2.0
- Mise à jour: 24 mai 2022
Check out my TRADE PLANNER MT5 – strongly recommended to anticipate account scenarios before risking any money.
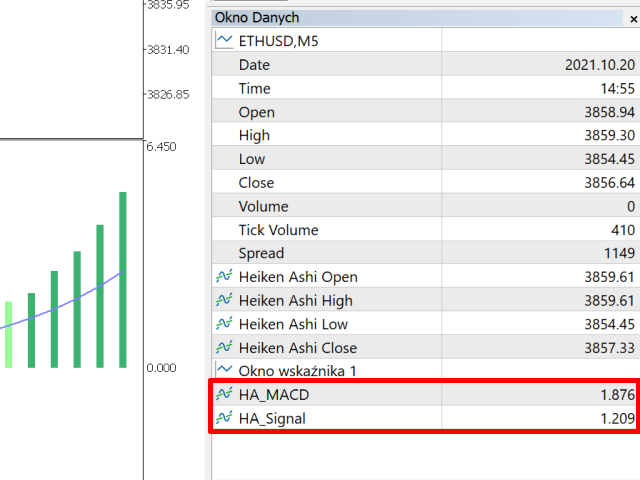
This is the moving average convergence divergence (MACD) indicator based on Heikin Ashi calculations. Here you find multi-colored histogram which corresponds to bull (green) / bear(red) trend. Dark and light colors describes weakness/strenght of price trend in time.
Also you can switch calculations between normal and Heikin Ashi price type.
Note:
Buffers numbers for iCustom: 0-MACD, 2-Signal line


Excelente!!! convinado con MACD funciona de maravilla!!!