IPDA and PD Ranges MT4
- Indicateurs
-
Thank-god Avwerosuoghene Odukudu
 "A speculator must concern himself with making money out of the market and not insisting that the tape must agree with him"
 - Version: 4.1
- Activations: 5
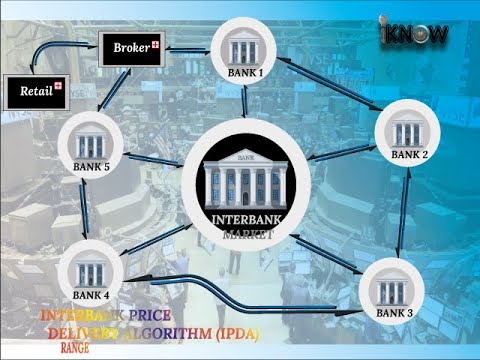
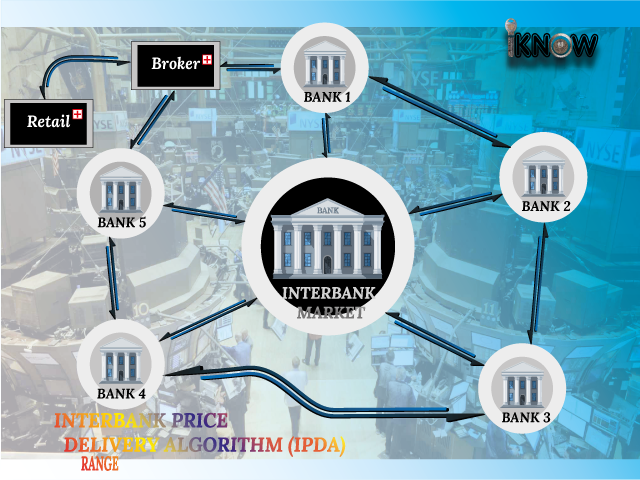
Liquidity and trades in the FX market take place in a decentralized manner as banks, brokers and electronic communication networks (ECNs) interact with one another to set prices. In FX, and ECN is a trading platform or electronic broker that hosts bids and offers and transmit them to users worldwide.
ECN broadcasts a price around the world as various participants leave orders to buy and sell. Banks provide streaming prices based on what the ECNs are showing, and retail FX platforms stream retail traders a price based on the bank streams.
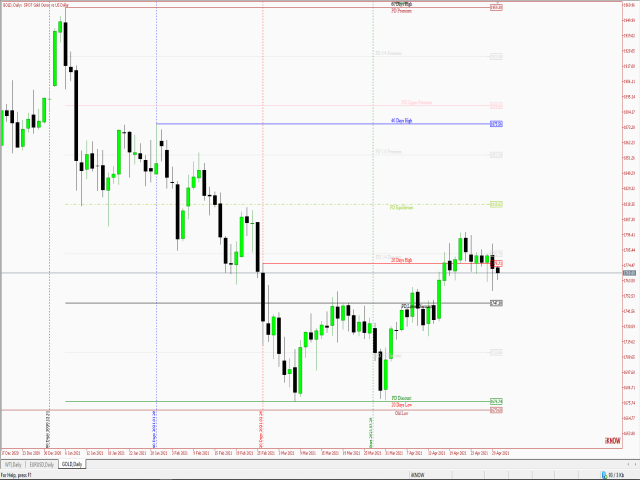
Premium Discount (PD) RangeIf an items has a generally accepted price, from 0 to the Fair value, it would be considered cheap, hence that defines the Discount Range, from fair value to highest price that can be paid above is Premium amount for the commodity.
User Guide (How to Use)1) Adjusting the Start
Click on the “Start” line, once it is highlighted, drag to the preferred point on the chart.
Note: it can also be adjusted from the properties menu of the indicator.
2) Adjusting the Terminus
The “terminus” is the end point on the chart where the right label are to be placed. It can be adjusted from the chart by clicking on and dragging any of the following Price tag:
| Price Tag |
|---|
|
3) Adjusting the PD Range
Clicking on either the “PD Discount” or “PD Premium” Lines, drag to the new point where you want these lines to be placed on the chart.
Note: You could drag the point on the left (Point opposite the price label), of the fore mentioned to get your desired result.
4) Working with either PD Range or IPDA Range alone
In the Properties menu, you could decide to show or hide any of the above, which would remove it from the chart in view, with the exception of the start Line, which is always present in all mode.
Miscellaneous- Change the Colour the lines by changing the colour in the properties window:
| Short Code | Meaning |
|---|---|
| St | Start |
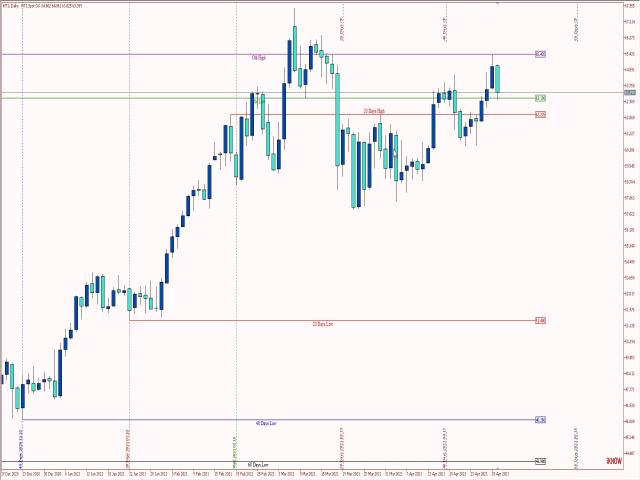
| T2 | 20 Days |
| F4 | 40 Days |
| S6 | 60 Days |
| Pre | PD Premium |
| Equ | PD Equilibrium |
| Upre | PD Upper Premium |
| Ldis | PD Lower Discount |
| OH | Old High |
| OL | Old Low |
| OHB | Old High Below (Current Price) |
| OLA | Old Low Above (Current Price) |
If a line colour is not set or an incorrect value is entered, the default colour would be used be used instead.
- Chart Caption
The caption uses the Chart foreground colour in its display.
Hiding in plain sight the answers so many seek