Delta AG
- Indicateurs
- Version: 1.3
- Mise à jour: 4 janvier 2022
- Activations: 5

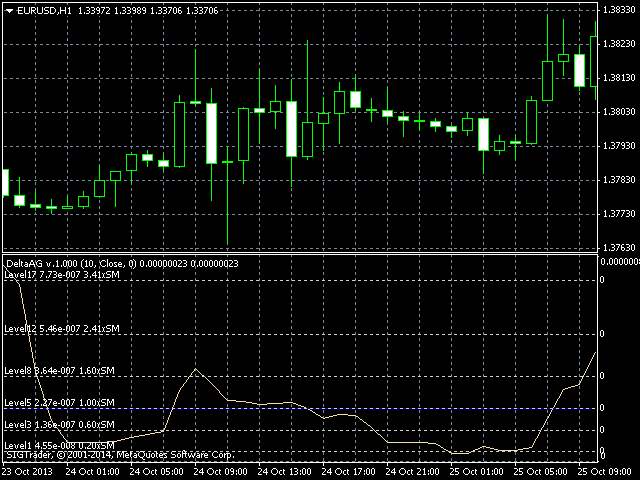
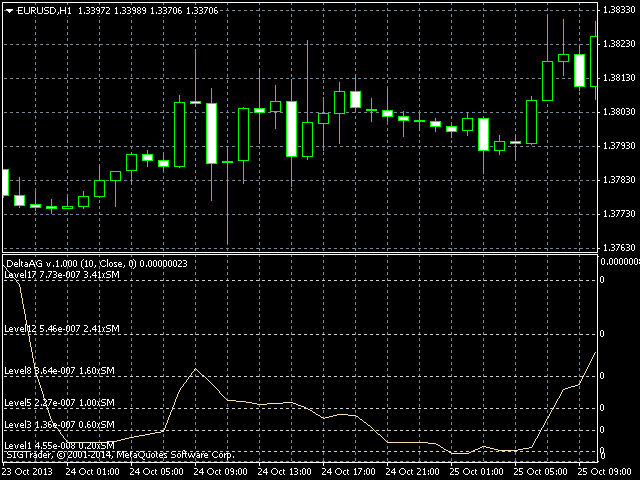
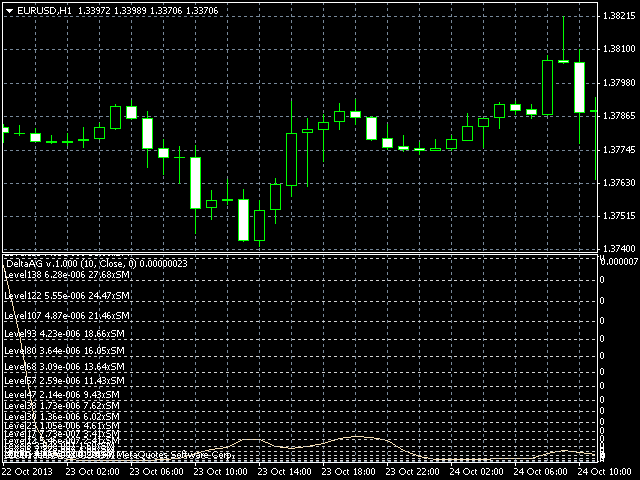
The difference between the arithmetic and geometric means at the specified range. Since the greater is the difference between the values, the greater the resulting figure is, actually the indicator shows volatility fluctuations.
The arithmetic mean of a certain number of values is the sum of the values divided by their number.
The geometric mean is the root of the power of the number of values extracted from the product of these values.
If all values are equal, the arithmetic mean and the geometric mean are equal. The greater is the difference between the values , the average of which is calculated, the greater the difference between the arithmetic and geometric means is.
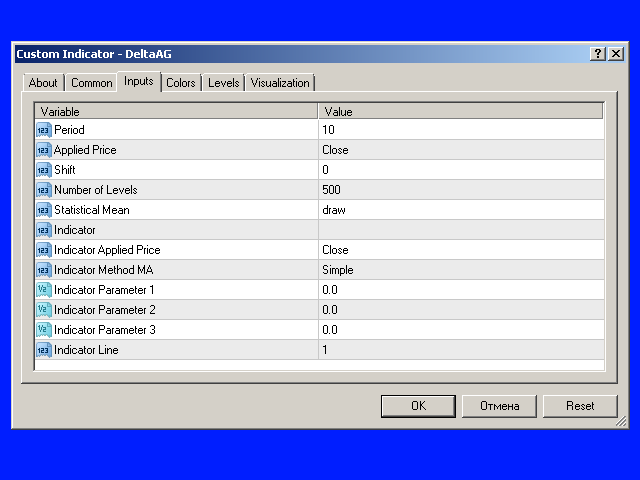
Input Parameters
The indicator has the following input parameters:
- Period - a positive number greater than one, it shows the number of candlesticks used for calculations. If you enter one or zero, there will be no error, but the indicator will not be drawn.
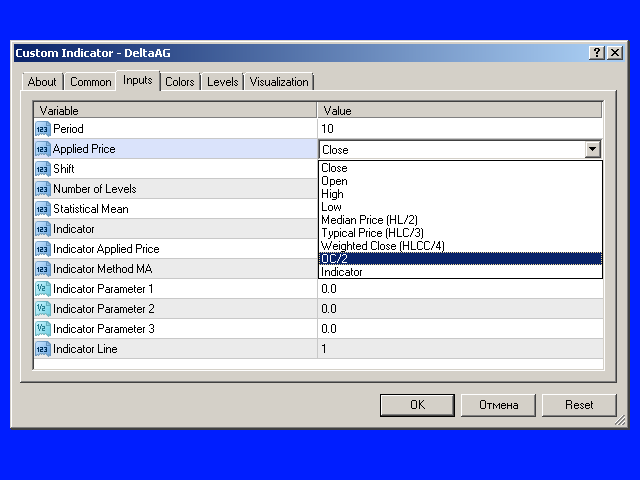
Applied Price - an extended "Apply to:" set meaning data used for the indicator calculation:
- Close - Close prices;
- Open - Open prices;
- High - High prices;
- Low - Low prices;
- Median Price (HL/2) - average of high and low prices, (high+low)/2;
- Typical Price (HLC/3) - average of high, low and close prices, (high+low+close)/3;
- Weighted Close (HLCC/4) - average of high, low and double value close prices, (high+low+close+close)/4;
- OC/2 - arithmetic means of Open and Close prices (open+close)/2 (not available in the free version);
- Indicator - based on indicator values (the list of indicators is below) (not available in the free version).
Shift - shift or offset.
Number of Levels - number of levels. MetaTrader 4 can show maximum 32 levels. In order to actually break this limit without breaking it formally, the indicator is searching for its own maximum in history, assigns its value to the highest level and divides the distance between the zero value and the highest level by the specified number of ranges. After that, based on a special algorithm, the indicator selects 32 levels to display so that the distance between them uniformly increases to the maximum.
The lines of the levels are implemented in the style of a grid of the main chart. The following information is shown left above each level:, its number, numeric value and its proportion of the average value in the form of #.##xSM (not available in the free version). To provide correct search of maximum in the history, it is recommended to download history before installing the indicator.
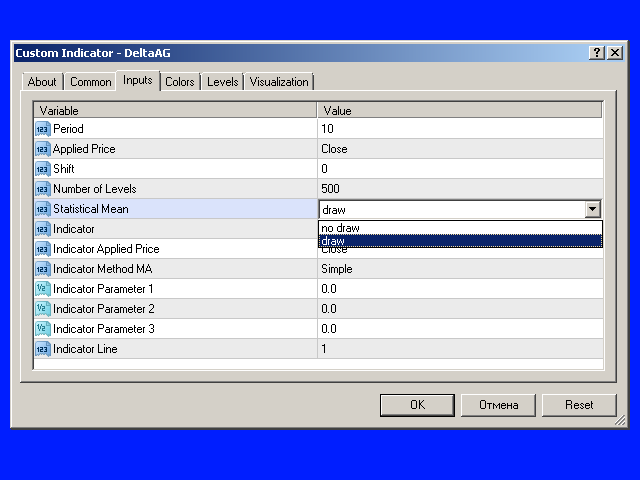
Statistical Mean - an option for displaying the average value as a separate indicator line (not available in the free version):
- no draw - do not show;
- draw - show.
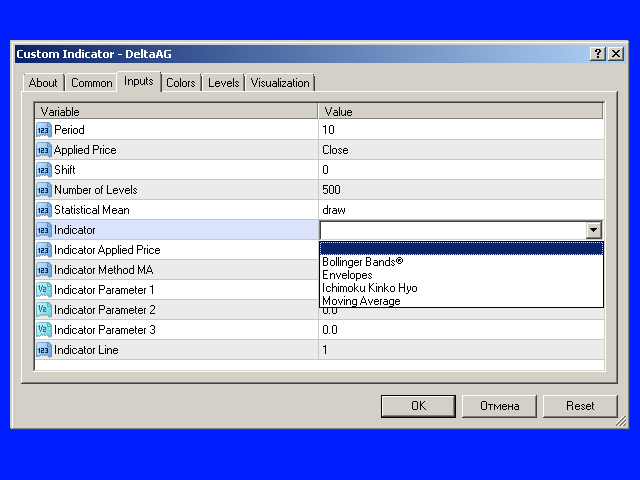
Indicator - select an indicator, the data of which will be used for calculating Delta AG (not available in the free version):
- Bollinger Bands®;
- Envelopes;
- Ichimoku Kinko Hyo;
- Moving Average.
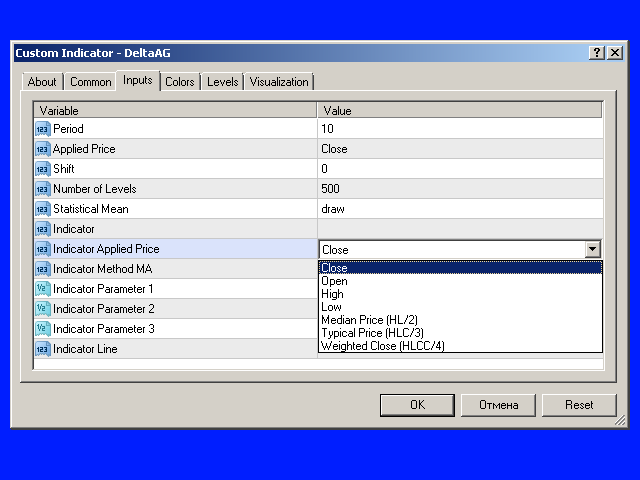
Indicator Applied Price - if the parameter "Apply to:" is used in the inputs of the indicator used for the calculation of Delta AG, the value from this field is used for this parameter (not available in the free version):
- Close - Close prices;
- Open - Open prices;
- High - High prices;
- Low - Low prices;
- Median Price (HL/2) - average of high and low prices, (high+low)/2;
- Typical Price (HLC/3) - average of high, low and close prices, (high+low+close)/3;
- Weighted Close (HLCC/4) - average of high, low and double value close prices, (high+low+close+close)/4.
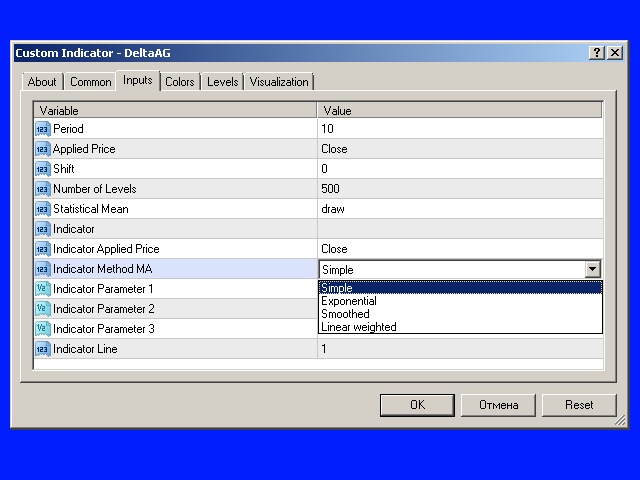
Indicator Method MA - if the parameter "MA Method:" is used in the inputs of the indicator used for the calculation of Delta AG, the value from this field is used for this parameter (not available in the free version):
- Simple - simple averaging;
- Exponential - exponential averaging;
- Smoothed - smoothed averaging;
- Linear weighted - linear weighted averaging.
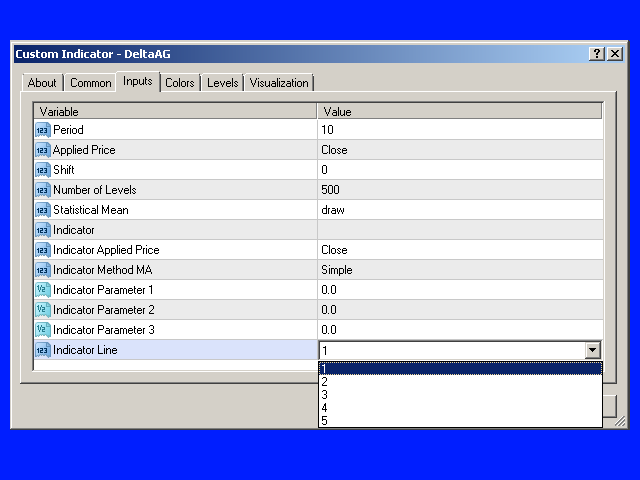
Indicator Parameter 1 - the first input parameter of the indicator, using which Delta AG will be calculated, not including fields "Apply to:" and "MA Method:" (See the table of indicator input parameters) (not available in the free version).
Indicator Parameter 2 - the second input parameter of the indicator, using which Delta AG will be calculated, not including fields "Apply to:" and "MA Method:" (See the table of indicator input parameters) (not available in the free version).
Indicator Parameter 3 - the third input parameter of the indicator, using which Delta AG will be calculated, not including fields "Apply to:" and "MA Method:" (See the table of indicator input parameters) (not available in the free version).
Indicator Line - the number of the indicator line used for the calculation of Delta AG (See the table of indicator lines) (not available in the free version).
Attention! If in Applied Price Indicator was selected, and in the Indicator field no indicator was selected, this will lead to a fatal error and the indicator will be removed from the chart.
The Table of Indicator Input Parameters
| Indicator Applied Price | Indicator Method MA | Indicator Parameter 1 | Indicator Parameter 2 | Indicator Parameter 3 | |
| Bollinger Bands® | Apply to: | not used | Period | Deviations | Shift |
| Envelopes | Apply to: | MA Method | Period | Shift | Deviation |
| Ichimoku Kinko Hyo | not used | not used | Tenkan-sen | Kijun-sen | Senkou Span B |
| Moving Average | Apply to: | MA Method | Period | Shift | not used |
If incorrect data are specified, the nearest possible values will be used. The main data are shown in the indicator name which appears as a tooltip when you hover your mouse cursor over the indicator line on a chart.
A Table of Indicator Lines
| 1 | 2 | 3 | 60 | 5 | |
| Bollinger Bands® | Main | Upper | Lower | not used | not used |
| Envelopes | Upper | Lower | not used | not used | not used |
| Ichimoku Kinko Hyo | Tenkan-sen | Kijun-sen | Senkou Span A | Senkou Span B | Chinkou Span |
| Moving Average | IGNORED | IGNORED | IGNORED | IGNORED | IGNORED |
If you select a line that does not exist for the selected indicator, the last possible line will be used. The name of the line applied is shown in the indicator name which appears as a tooltip when you hover your mouse cursor over the indicator line on a chart.
Free version
The free version of the indicator Delta AG Free provides basic functions.