Auto Trend Liner Displaying chart patterns
- Indicateurs
- Version: 1.20
- Mise à jour: 17 mai 2020
- Activations: 5

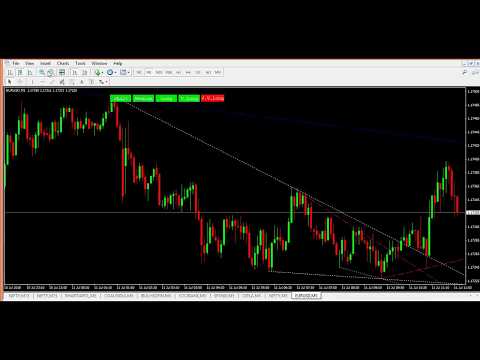
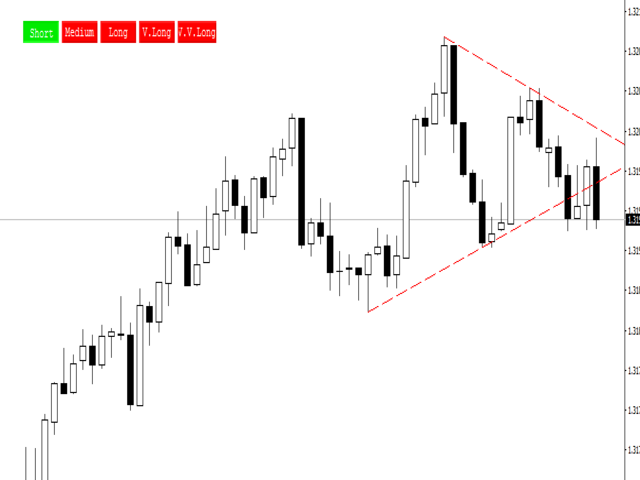
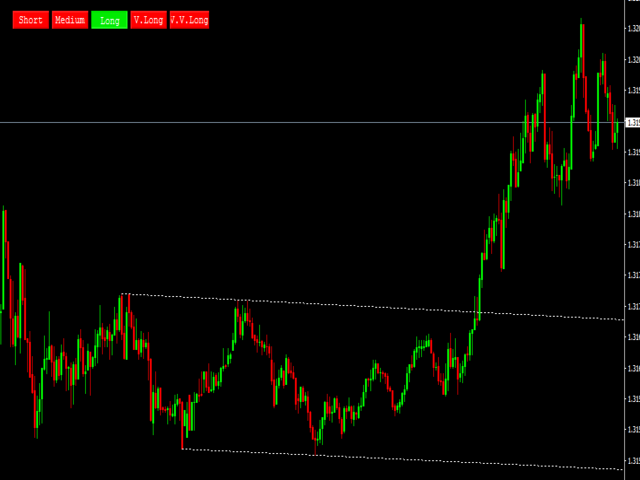
The Indicator automatically draws trend lines ( Support & Resistance Lines) when attached to any opened chart with any time frame.
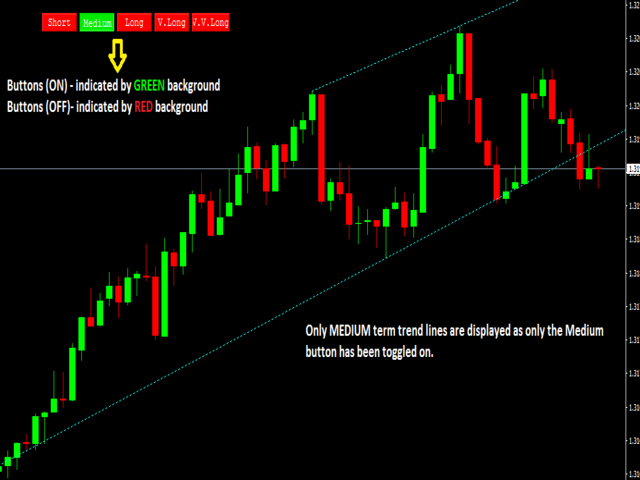
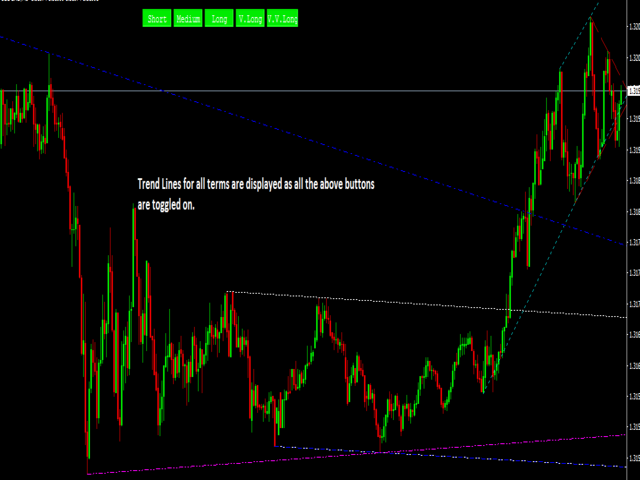
Button controls with on(green)/off(red) are provided to display the Support & Resistance lines of short, medium, long, very long, v.v.long trends.
For ex: to display only short, long term trend lines, make sure that the short and long buttons are in green color and the remaining 3 buttons in red color.
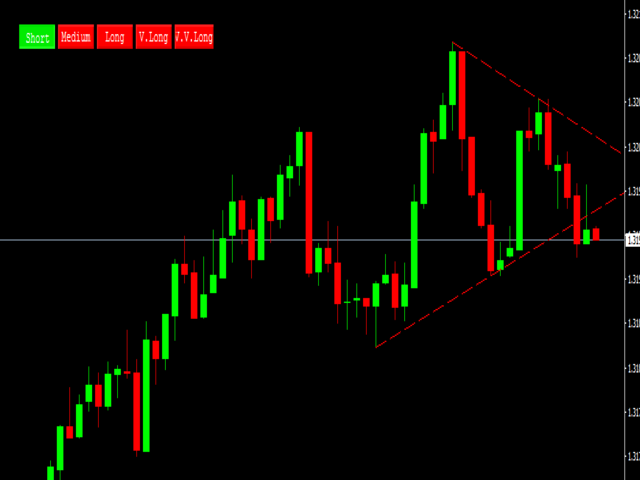


only short trend lines appear. how to make the medium long lines also appear