YTG cci

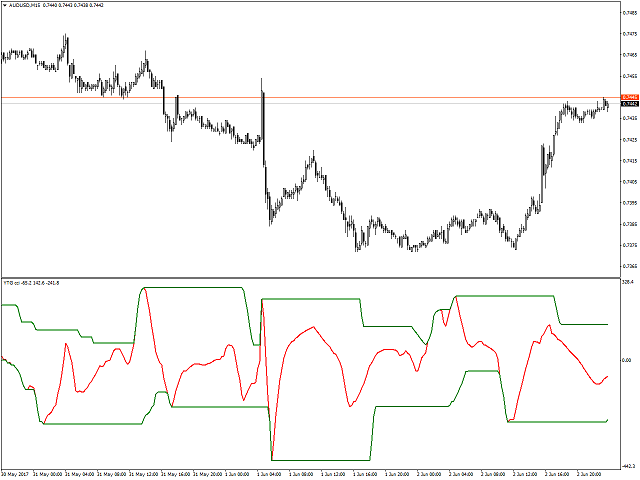
This is the oscillator with dynamic levels based on CCI indicator.

Settings:

  • CciPeriod - averaging period for the indicator calculation.
  • Price - applied price.
  • AvgPeriod - averaging period for calculating the indicator smoothing.
  • AvgMethod - averaging method for calculating the indicator smoothing.
  • MinMaxPeriod - dynamic levels calculation period.
  • _levelUp - upper level.
  • _levelDown - lower level.
Produits recommandés
"Auto FIBO Pro" Crypto_Forex indicator - est un excellent outil auxiliaire dans le trading ! - L'indicateur calcule et place automatiquement sur le graphique les niveaux de Fibo et les lignes de tendance locales (couleur rouge). - Les niveaux de Fibonacci indiquent les zones clés où le prix peut s'inverser. - Les niveaux les plus importants sont 23,6 %, 38,2 %, 50 % et 61,8 %. - Vous pouvez l'utiliser pour le scalping inversé ou pour le trading en grille de zones. - Il existe également de nomb
[ZhiBiCCI] indicators are suitable for all cycle use, and are also suitable for all market varieties. [ZhiBiCCI] Green solid line is a reversal of bullish divergence. The green dotted line is a classic bullish divergence. [ZhiBiCCI] The solid line to the red is a reverse bearish divergence. The red dotted line is a classical bearish divergence. [ZhiBiCCI] can be set in the parameters (Alert, Send mail, Send notification), set to (true) to send instant signals to the alarm window, email, insta
The indicator detects and displays Shark harmonic pattern (see the screenshot). The pattern is plotted by the extreme values of the ZigZag indicator (included in the resources, no need to install). After detecting the pattern, the indicator notifies of that by a pop-up window, a mobile notification and an email. The indicator highlights the process of the pattern formation and not just the complete pattern. In the former case, it is displayed in the contour triangles. After the pattern is comple
The   Trendlines Oscillator   helps traders identify trends and momentum based on the normalized distances between the current price and the most recently detected bullish and bearish trend lines. The indicator features bullish and bearish momentum, a signal line with crossings, and multiple smoothing options. USAGE The   Trendlines Oscillator   works by systematically: Identifying pivot highs and lows. Connecting pivots to form bullish (support) and bearish (resistance) trendlines. Measuring
L'indicateur construit les cotations actuelles, qui peuvent être comparées aux cotations historiques et, sur cette base, faire une prévision de l'évolution des prix. L'indicateur dispose d'un champ de texte pour une navigation rapide jusqu'à la date souhaitée. Option : Symbole - sélection du symbole que l'indicateur affichera ; SymbolPeriod - sélection de la période à partir de laquelle l'indicateur prendra des données ; IndicatorColor - couleur de l'indicateur ; HorisontalShift - décalage
Trend Ray
Andriy Sydoruk
The indicator shows the potential trend direction by cyclical-wave dependence. Thus, all the rays of the intersection will be optimal rays, in the direction of which the price is expected to move, taking into account the indicator period. Rays can be used as a direction for potential market movement. But we must not forget that the approach must be comprehensive, the indicator signals require additional information to enter the market.
This indicator is the undisputed leader among the indicators. And for this statement there is a good reason. The indicator builds a very high quality channel in which it generates signals to enter! What is the ideal strategy for the trader, since the trader always hesitates when choosing a strategy for the job. That is, this indicator will allow you to solve the dilemma of choosing a job by trend or to the channel, since it combines these two basic concepts. Working with the indicator is very
Indicador Taurus All4
Fabio Oliveira Magalhaes
Taurus All4 Taurus All4 is a high-performance indicator, it will tell you the strength of the trend, and you will be able to observe the strength of the candle. Our indicator has more than 4 trend confirmations. It is very simple and easy to use. Confirmation Modes Candle Trend Confirmations: When the candle switches to light green the trend is high. When the candle switches to light red the trend is reverting down. When the candle changes to dark red the trend is low. Trendline Trend Confirm
Infinity Trend Pro
Yaroslav Varankin
1 (1)
This is a trend indicator without redrawing Developed instead of the binary options strategy (by the color of the Martingale candlestick) Also works well in forex trading When to open trades (binary options) A signal will appear in the place with a candle signaling the current candle It is recommended to open a deal for one candle of the current timeframe M1 and M5 When a blue dot appears, open a deal up When a red dot appears, open a trade down. How to open trades on Forex. When a signal is rec
Super Reversal Pattern
Parfait Mujinga Ndalika
Super Reversal Pattern Indicator Unlock the power of advanced pattern recognition with our Super Reversal Pattern Indicator. Designed for traders seeking precision and reliability, this indicator identifies one of the most effective reversal patterns in technical analysis, offering a significant edge in your trading strategy. Key Features: Non-Repainting Accuracy: Enjoy the confidence of non-repainting technology. Once a Super Reversal Pattern is detected, it remains static, providing consiste
VR Cub
Vladimir Pastushak
VR Cub est un indicateur permettant d'obtenir des points d'entrée de haute qualité. L'indicateur a été développé pour faciliter les calculs mathématiques et simplifier la recherche de points d'entrée dans un poste. La stratégie de trading pour laquelle l'indicateur a été rédigé prouve son efficacité depuis de nombreuses années. La simplicité de la stratégie de trading est son grand avantage, qui permet même aux traders débutants de négocier avec succès avec elle. VR Cub calcule les points d'ouve
Price Magnet — Price Density and Attraction Levels Indicator Price Magnet is a professional analytical tool designed to identify key support and resistance levels based on statistical Price Density. The indicator analyzes a specified historical period and detects price levels where the market spent the most time. These zones act as “magnets,” attracting price action or forming a structural base for potential reversals. Unlike traditional Volume Profile tools, Price Magnet focuses on price-time d
PABT Pattern Indicator - it's classical system one of the signal patterns. Indicator logic - the Hi & Lo of the bar is fully within the range of the preceding bar, look to trade them as pullback in trend. In the way if indicator found PABT pattern it's drawing two lines and arrow what showing trend way.  - First line - it's entry point and drawing at: 1. On the high of signal bar or on middle of the signal bar (depending from indicator mode) for buy; 2. On the low of signal bar or on middle of t
Crypto_Forex Indicator HTF Ichimoku pour MT4. - L'indicateur Ichimoku est l'un des indicateurs de tendance les plus puissants. HTF signifie - Higher Time Frame. - Cet indicateur est excellent pour les traders de tendance ainsi que pour la combinaison avec les entrées Price Action. - L'indicateur HTF Ichimoku vous permet d'attacher Ichimoku d'une période plus élevée à votre graphique actuel. - Tendance à la hausse - ligne rouge au-dessus de la bleue (et les deux lignes sont au-dessus du nuage)
Trend PA
Mikhail Nazarenko
5 (3)
The Trend PA indicator uses   Price Action   and its own filtering algorithm to determine the trend. This approach helps to accurately determine entry points and the current trend on any timeframe. The indicator uses its own algorithm for analyzing price changes and Price Action. Which gives you the advantage of recognizing, without delay, a new nascent trend with fewer false positives. Trend filtering conditions can be selected in the settings individually for your trading style. The indicator
Trend Oscillator - est un indicateur Crypto_Forex personnalisé avancé, un outil de trading efficace ! - Une nouvelle méthode de calcul avancée est utilisée - 20 options pour le paramètre « Prix pour le calcul ». - L'oscillateur le plus fluide jamais développé. - Couleur verte pour les tendances à la hausse, couleur rouge pour les tendances à la baisse. - Valeurs de survente : inférieures à 5, Valeurs de surachat : supérieures à 95. - Il existe de nombreuses possibilités de mettre à niveau même
Rainbow Price Visualizer v1.21 See where the market really breathes. Turns your MT4 chart into an ultra-precise heatmap that highlights price zones favored by big players. Why it matters 300 price levels at 0.2‑pip resolution — microscopic detail. 8 visual themes (Rainbow, Fire, Ocean…) for instant readibility. Smart opacity: low noise fades, real zones pop. Lightweight rendering with automatic cleanup. Fully customizable: saturation, opacity, resolution, history depth. Bands project into the f
The indicator displays the data of the Stochastic oscillator from a higher timeframe on the chart. The main and signal lines are displayed in a separate window. The stepped response is not smoothed. The indicator is useful for practicing "manual" forex trading strategies, which use the data from several screens with different timeframes of a single symbol. The indicator uses the settings that are identical to the standard ones, and a drop-down list for selecting the timeframe. Indicator Paramet
The indicator allows you to trade binary options. The recommended time frame is М1 and the expiration time is 1,2,3 minutes. The indicator suitable for auto and manual trading. A possible signal is specified as a arrows above/under a candle. You should wait until the candle closes! Arrows are not re-painted Trade sessions: TOKYO section (Half-end) Currency pairs: USD/JPY Working time frame: M1 Expiration time: 1,2,3 minutes. The indicator also shows good results when using the martingale strateg
FREE
HMA Trend Professional MT4
Pavel Zamoshnikov
4.57 (7)
Improved version of the free HMA Trend indicator (for MetaTrader 4) with statistical analysis. HMA Trend is a trend indicator based on the Hull Moving Average (HMA) with two periods. HMA with a slow period identifies the trend, while HMA with a fast period determines the short-term movements and signals in the trend direction. The main differences from the free version: Ability to predict the probability of a trend reversal using analysis of history data. Plotting statistical charts for analyzi
DSS Candles AM
Andrii Matviievskyi
5 (1)
This indicator colors the price chart candles according to the data of the DSS Oscillator AM indicator. DSS Oscillator AM is the author's implementation of the Double Smoothed Stochastic oscillator developed by William Blau and Walter Bressert. The calculation of values ​​is largely similar to the calculation of the classic stochastic oscillator. The indicator takes into account the location of the current price relative to local highs/lows. The signal about the change in the direction of price
FREE
Forex Gump
Andrey Kozak
2.4 (5)
Forex Gump is a fully finished semi-automatic trading system. In the form of arrows, signals are displayed on the screen for opening and closing deals. All you need is to follow the instructions of the indicator. When the indicator shows a blue arrow, you need to open a buy order. When the indicator shows a red arrow, you need to open a sell order. Close orders when the indicator draws a yellow cross. In order to get the most effective result, we recommend using the timeframes H1, H4, D1. There
ADX Pointer
Dominik Mandok
ADX Pointer is an indicator which is based on "Average Directional Index" and draws three numbers in chart window depending on the value of ADX. In ADX Pointer you can set "ADX_Period" which is of course period of Average Directional Index and you can also set 3 levels. When ADX value exceed first level ("ADX_Level1") in chart window appears number "1", when ADX exceed second level ("ADX_Level2") appears "2" and when ADX exceed third level ("ADX_Level3") appears "3". Simple. ADX Pointer works on
MACDivergence MTF
Pavel Zamoshnikov
4.29 (7)
Advanced ideas of the popular MACD indicator: It detects and displays classic and reverse divergences (three methods of detecting divergences). It uses different color to highlight an uptrend and a downtrend. Two methods of determining a trend: а) MACD crosses the 0 level (classic signal); б) MACD crosses its own average (early signal). This is a multi-timeframe indicator: it can display MACD data from other timeframes. Two methods of drawing: classic histogram and line. It generates sound and v
The Th3Eng PipFinite indicator is based on a very excellent analysis of the right trend direction with perfect custom algorithms. It show the true direction and the best point to start trading. With StopLoss point and Three Take Profit points. Also it show the right pivot of the price and small points to order to replace the dynamic support and resistance channel, Which surrounds the price. And Finally it draws a very helpful Box on the left side on the chart includes (take profits and Stop loss
The indicator detects and displays 3 Drives harmonic pattern (see the screenshot). The pattern is plotted by the extreme values of the ZigZag indicator (included in the resources, no need to install). After detecting the pattern, the indicator notifies of that by a pop-up window, a mobile notification and an email. The indicator highlights the process of the pattern formation and not just the complete pattern. In the former case, it is displayed in the contour triangles. After the pattern is com
MACD Divergence
Sergey Deev
2.5 (2)
The indicator detects divergence signals - the divergences between the price peaks and the MACD oscillator values. The signals are displayed as arrows in the additional window and are maintained by the messages in a pop-up window, e-mails and push-notifications. The conditions which formed the signal are displayed by lines on the chart and in the indicator window. Indicator Parameters MacdFast - fast MACD line period MacdSlow - slow MACD line period MacdSignal - MACD signal line period MacdPric
EZZ Zig Zag MT4
Paulo Rocha
5 (1)
EZZ Elite Zig Zag is an indicator for the MetaTrader 4 terminal. This indicator traces the peak of the trend based on the market reversal, thus showing various opportunities in the financial market. EZZ Elite Zig Zag is a visual tool, intuitive, and easy to understand and use.  Test it Yourself by Downloading it for Free. Author Paulo Rocha all rights reserved
Your Good Friends — this is not just an indicator, but your reliable trading assistant, designed for traders who value simplicity, clarity, and stability. It combines the best classic methods of technical analysis — support and resistance levels, reversal signals, visual cues — and presents them in the clearest, most user-friendly format possible. Suitable for both beginners and experienced traders — especially those who want to eliminate chaos, reduce stress, and trade based on clear signals.
This indicator is based on the Bollinger Bands on one or more timeframes and on any Currency Cross Pair. The indicator generates an alert message when it detects a buy or sell signal. It also draws a vertical bar on the price chart: green for buy or red for sell, white if flat. Alert messages and Vertical bars for BUY or SELL, are generated when the Bollinger Bands is consistent for all chosen timeframes else a FLAT signal is generated. In addition, the Multi TimeFrames Bollinger Bands Signals i
Les acheteurs de ce produit ont également acheté
Gann Made Easy
Oleg Rodin
4.83 (162)
Gann Made Easy est un système de trading Forex professionnel et facile à utiliser qui est basé sur les meilleurs principes de trading en utilisant la théorie de mr. WD Gann. L'indicateur fournit des signaux d'ACHAT et de VENTE précis, y compris les niveaux Stop Loss et Take Profit. Vous pouvez échanger même en déplacement en utilisant les notifications PUSH. VEUILLEZ ME CONTACTER APRÈS L'ACHAT POUR RECEVOIR GRATUITEMENT DES INSTRUCTIONS DE TRADING ET D'EXCELLENTS INDICATEURS SUPPLÉMENTAIRES! Vou
Scalper Inside PRO
Alexey Minkov
4.74 (69)
Scalper Inside PRO – Since 2020. An exclusive indicator that utilizes an innovative algorithm to swiftly and accurately determine the market trend. The indicator automatically calculates opening, closing, and profit levels, providing detailed trading statistics. With these features, you can choose the most appropriate trading instrument for the current market conditions. Additionally, you can easily integrate your own arrow indicators into Scalper Inside Pro to quickly evaluate their statistics
Le système PRO Renko est un système de trading très précis spécialement conçu pour le trading de graphiques RENKO. Il s'agit d'un système universel qui peut être appliqué à divers instruments de négociation. Le système neutralise efficacement ce qu'on appelle le bruit du marché en vous donnant accès à des signaux d'inversion précis. L'indicateur est très facile à utiliser et n'a qu'un seul paramètre responsable de la génération du signal. Vous pouvez facilement adapter l'outil à n'importe que
Market Makers
Mohamed Hassan
5 (3)
After purchase, contact me privately to receive 1 month of free testing with EA Forex Proton! This advanced MT4 trading robot automatically executes signals from any MT4 indicator, including Market Makers. The latest version also includes AI integration, allowing each trade signal to be analyzed using Artificial Intelligence. Live Signal with EA Forex Proton: Click here Market Makers is a powerful price action trading system designed to identify high-probability Buy and Sell opportunities based
Advanced Supply Demand
Bernhard Schweigert
4.91 (299)
Offre spéciale : 40 % de réduction La solution idéale pour les traders débutants comme experts ! Cet indicateur est un outil de trading unique, performant et abordable grâce à l’intégration de nombreuses fonctionnalités exclusives et d’une nouvelle formule. Cette mise à jour vous permet d’afficher des zones sur deux unités de temps. Vous pourrez ainsi visualiser non seulement une unité de temps supérieure, mais aussi l’unité de temps du graphique, ainsi que l’unité de temps supérieure : des z
M1 Sniper
Oleg Rodin
5 (22)
M1 SNIPER est un système d'indicateurs de trading facile à utiliser. Il s'agit d'un indicateur à flèche conçu pour l'unité de temps M1. Cet indicateur peut être utilisé seul pour le scalping sur l'unité de temps M1 ou intégré à votre système de trading existant. Bien que conçu spécifiquement pour le trading sur l'unité de temps M1, ce système peut également être utilisé avec d'autres unités de temps. Initialement, j'avais conçu cette méthode pour le trading du XAUUSD et du BTCUSD. Cependant, je
Signal GoldRush Trend Arrow L'indicateur GoldRush Trend Arrow Signal fournit une analyse précise et en temps réel des tendances, spécialement conçue pour les scalpers à haute vitesse et à court terme sur la paire XAU/USD. Conçu spécialement pour les intervalles de temps d'une minute, cet outil affiche des flèches directionnelles indiquant clairement les points d'entrée, ce qui permet aux scalpers de naviguer en toute confiance dans des conditions de marché volatiles. L'indicateur se compose
NAM Divergences
NAM TECH GROUP, CORP.
5 (1)
MT4 Multi-timeframe Divergence and Overbougt/Oversold detection indicator. Features - Fully customizable on chart control panel, provides complete interaction. - Hide and show control panel wherever you want. - Real time information about non-capitalized divergences. - Real time information about overbougt / oversold situations. - Real time information about regular divergences. - Real time information about hidden divergences. - Oscillators available for divergences detection: AO, RSI, CCI, MA
Auto Optimized Parabolic RSI : Moteur de Momentum 3D Avancé La plupart des indicateurs pour les particuliers échouent car ils s'appuient sur des paramètres statiques qui se brisent dès que la volatilité du marché change. L'Auto Optimized Parabolic RSI résout le problème de l'« obsolescence des indicateurs » en recalculant continuellement son propre avantage mathématique, apportant une adaptation quantitative de niveau institutionnel directement sur votre terminal MT5. L'Avantage Principal : Opti
Apollo SR Master est un indicateur de support/résistance doté de fonctionnalités spéciales qui simplifient et fiabilisent le trading basé sur les zones de support/résistance. Cet indicateur calcule ces zones en temps réel, sans aucun décalage, en détectant les sommets et les creux locaux des prix. Pour confirmer la nouvelle zone de support/résistance, il affiche un signal spécifique indiquant que cette zone peut être prise en compte et utilisée comme un véritable signal d'achat ou de vente. Dans
L'indicateur « Dynamic Scalper System » est conçu pour la méthode de scalping, permettant de trader au sein des vagues de tendance. Testé sur les principales paires de devises et l'or, il est compatible avec d'autres instruments de trading. Fournit des signaux pour l'ouverture de positions à court terme le long de la tendance, avec un support supplémentaire pour les fluctuations de prix. Principe de l'indicateur : De grandes flèches déterminent la direction de la tendance. Un algorithme de gén
ACTUELLEMENT 40% DE RÉDUCTION La meilleure solution pour tout débutant ou trader expert ! Cet indicateur est un outil de trading unique, de haute qualité et abordable car nous avons incorporé un certain nombre de caractéristiques exclusives et une nouvelle formule. Avec seulement UN graphique, vous pouvez lire la force de la devise pour 28 paires Forex ! Imaginez comment votre trading va s'améliorer parce que vous êtes capable de repérer le point de déclenchement exact d'une nouvelle tendance
Ultimate Sniper Dashboard
Hispraise Chinedum Abraham
4.82 (22)
Prix réduit à 299 $ ! Les prix peuvent augmenter à l'avenir ! Lisez la description ci-dessous ! Meilleur système d'entrée pour le tableau de bord Ultimate Sniper : NIVEAUX DYNAMIQUES ULTIMES. (Veuillez consulter mes produits) L'Ultimate Sniper Dashboard fonctionne UNIQUEMENT sur les marchés en direct en raison des limites des tests multidevises de MT4. Voici l'Ultimate-Sniper Dashboard ! Notre meilleur produit qui contient à la fois HA-Sniper, MA-Sniper et de nombreux modes spéciaux. L'Ultima
Currency Strength Wizard est un indicateur très puissant qui vous offre une solution tout-en-un pour un trading réussi. L'indicateur calcule la puissance de telle ou telle paire de devises en utilisant les données de toutes les devises sur plusieurs périodes. Ces données sont représentées sous la forme d'un indice de devise facile à utiliser et de lignes électriques de devise que vous pouvez utiliser pour voir la puissance de telle ou telle devise. Tout ce dont vous avez besoin est d'attacher l'
Atomic Analyst
Issam Kassas
5 (5)
Tout d'abord, il convient de souligner que cet indicateur de trading n'est ni repainting, ni redrawing et ne présente aucun délai, ce qui le rend idéal à la fois pour le trading manuel et automatisé. Manuel de l'utilisateur : réglages, entrées et stratégie. L'Analyste Atomique est un indicateur d'action sur les prix PA qui utilise la force et le momentum du prix pour trouver un meilleur avantage sur le marché. Équipé de filtres avancés qui aident à éliminer les bruits et les faux signaux, et à
Trend Screener
STE S.S.COMPANY
4.79 (95)
Indicateur de tendance, solution unique révolutionnaire pour le trading et le filtrage des tendances avec toutes les fonctionnalités de tendance importantes intégrées dans un seul outil ! Il s'agit d'un indicateur multi-période et multi-devises 100 % non repeint qui peut être utilisé sur tous les symboles/instruments : forex, matières premières, crypto-monnaies, indices et actions. OFFRE À DURÉE LIMITÉE : L'indicateur Support and Resistance Screener est disponible pour seulement 65 $ et à vie. (
Dynamic Forex28 Navigator
Bernhard Schweigert
4.43 (7)
Dynamic Forex28 Navigator - L'outil de trading Forex de nouvelle génération. ACTUELLEMENT 49 % DE RÉDUCTION. Dynamic Forex28 Navigator est l'évolution de nos indicateurs populaires de longue date, combinant la puissance de trois en un : Advanced Currency Strength28 Indicator (695 avis) + Advanced Currency IMPULSE avec ALERT (520 avis) + CS28 Combo Signals (Bonus). Détails sur l'indicateur https://www.mql5.com/en/blogs/post/758844 Qu'offre l'indicateur de force de nouvelle génération ? Tout
ACTUELLEMENT 40% DE RÉDUCTION ! ! La meilleure solution pour tout débutant ou Expert Trader ! Cet indicateur est un outil de trading unique, de haute qualité et abordable car nous avons incorporé un certain nombre de caractéristiques exclusives et une formule secrète. Avec seulement UN graphique, il donne des alertes pour les 28 paires de devises. Imaginez comment votre trading s'améliorera parce que vous serez capable de repérer le point de déclenchement exact d'une nouvelle tendance ou d'un
Supply and Demand Dashboard PRO
Bernhard Schweigert
4.8 (20)
Actuellement 40% de réduction ! Ce tableau de bord est un logiciel très puissant qui fonctionne sur plusieurs symboles et jusqu'à 9 horizons temporels. Il est basé sur notre indicateur principal (Best reviews : Advanced Supply Demand ).   Le tableau de bord donne une excellente vue d'ensemble. Il montre :  Les valeurs d'offre et de demande filtrées, y compris l'évaluation de la force de la zone, Les distances en pips vers/et dans les zones, Il met en évidence les zones imbriquées, Il donne 4
TPSpro RFI Levels
Roman Podpora
4.86 (28)
INSTRUCTIONS RUS  /  INSTRUCTIONS   ENG  /  Version MT5 Fonctions principales : Affiche les zones actives des vendeurs et des acheteurs ! L'indicateur affiche tous les niveaux/zones de première impulsion corrects pour les achats et les ventes. Lorsque ces niveaux/zones sont activés, là où commence la recherche de points d'entrée, ils changent de couleur et se remplissent de certaines couleurs. Des flèches apparaissent également pour une perception plus intuitive de la situation. LOGIC AI - Affi
FX Volume
Daniel Stein
4.63 (38)
FX Volume : Découvrez le Sentiment du Marché tel que perçu par un Courtier Présentation Rapide Vous souhaitez faire passer votre approche de trading au niveau supérieur ? FX Volume vous fournit, en temps réel, des informations sur la manière dont les traders particuliers et les courtiers sont positionnés—bien avant la publication de rapports retardés comme le COT. Que vous visiez des gains réguliers ou recherchiez simplement un avantage plus solide sur les marchés, FX Volume vous aide à repére
Super Signal – Skyblade Edition Système de signaux de tendance professionnel sans repaint / sans latence, avec un taux de réussite exceptionnel | Pour MT4 / MT5 Il fonctionne mieux sur des unités de temps inférieures, comme 1 minute, 5 minutes et 15 minutes. Caractéristiques principales : Super Signal – Skyblade Edition est un système de signaux intelligent conçu spécifiquement pour le trading de tendance. Il utilise une logique de filtrage multicouche pour détecter uniquement les mouvements d
KT Alpha Hunter Arrows MT4
KEENBASE SOFTWARE SOLUTIONS
La plupart des indicateurs à flèches vous donnent un signal, puis vous laissent gérer tout le reste seul. KT Alpha Hunter Arrows vous fournit un plan de trading complet. Chaque flèche de signal s’affiche avec un plan déjà tracé : ligne d’entrée, stop loss, quatre niveaux de take profit et un verdict d’edge en temps réel indiquant si ce symbole et cette unité de temps méritent d’être tradés maintenant. Le package inclut un Trade Manager EA qui prend en charge l’exécution après votre entrée, afin
Documentation for connecting Metatrader 4 with Python with a simple drag and drop EA.   A full end-to-end solution ,fully tested ,fast and efficient! The Pytrader ecosystem consists of a python script and a MT4 EA. (  MT5  version ) Further for the licensing an indicator is used.  The communication between the python script and the EA is based on sockets. EA is the  Server   and the python script the  Client .  It is always query(function / python script) and output(data / server). The EA doe
- Real price is 80$ - 50% Discount (It is 39$ now) - just for 2 purchases. Contact me for instruction, add group and any questions! - Non-repaint - I just sell my products in Elif Kaya profile, any other websites are stolen old versions, So no any new updates or support. - Lifetime update free Related product:   Bitcoin Expert Introduction The breakout and retest strategy is traded support and resistance levels. it involves price breaking through a previous level.  The break and retest strateg
Arrêtez de deviner. Commencez à trader avec un avantage statistique. Les indices boursiers ne se négocient pas comme le forex. Ils ont des sessions définies, des gaps overnight et suivent des modèles statistiques prévisibles. Cet indicateur vous fournit les données de probabilité dont vous avez besoin pour trader des indices comme le DAX, S&P 500 et Dow Jones avec confiance. Ce qui le rend différent La plupart des indicateurs vous montrent ce qui s'est passé. Celui-ci vous montre ce qui va proba
Route Lines Prices - est un indicateur conçu pour identifier les directions des prix. Son interface simple intègre plusieurs algorithmes de calcul du comportement des prix et de leur direction future. Ces algorithmes incluent le calcul de la volatilité et le lissage des prix en fonction des unités de temps utilisées. L'indicateur possède un unique paramètre permettant de modifier la valeur « Calculating price values ». La valeur par défaut de 1 assure un calcul automatique équilibré, utilisabl
Volatility Trend System - un système de trading qui donne des signaux pour les entrées. Le système de volatilité donne des signaux linéaires et ponctuels dans le sens de la tendance, ainsi que des signaux pour en sortir, sans redessiner ni retarder. L'indicateur de tendance surveille la direction de la tendance à moyen terme, montre la direction et son changement. L'indicateur de signal est basé sur les changements de volatilité et montre les entrées sur le marché. L'indicateur est équipé de pl
Trend indicator AI
Ramil Minniakhmetov
4.54 (84)
L'indicateur Trend Ai est un excellent outil qui améliorera l'analyse du marché d'un trader en combinant l'identification des tendances avec des points d'entrée exploitables et des alertes d'inversion. Cet indicateur permet aux utilisateurs de naviguer dans les complexités du marché forex avec confiance et précision Au-delà des signaux primaires, l'indicateur Trend Ai identifie les points d'entrée secondaires qui surviennent lors des retraits ou des retracements, permettant aux traders de capit
Trend Sniper Super Indicator is one of the best indicator which can provide you will perfect signals for short term and long term trades. This indicator is suitable for both scalping and swing trading strategies. The indicator is over 85% accurate. It uses terminal Message Alerts, Emails and Push notifications to your mobile device to inform you about the new trading opportunities and it will calculate the take profit and stop loss level for you. All you will need to do is to place a trade. Subs
Plus de l'auteur
Line Profit
Iurii Tokman
5 (4)
Line Profit   Indicator of the visual line of profit in the deposit currency. Works only if there are open positions in the market for the symbol on which the indicator is installed. You can move the line with the mouse or enable automatic tracking of the Bid price. Description of indicator settings: colotLine - line color WidthLine - line width colotText - text color FontSize - the height of the text Anchor - an anchor method for text FollowBid - follow the Bid price
FREE
ChannelRSI5
Iurii Tokman
5 (5)
ChannelRSI5   The Relative Strength Index (RSI) indicator with dynamic levels of overbought and oversold zones. Dynamic levels change and adjust to the current changes in the indicator and prices, and represent a kind of channel. Indicator settings period_RSI - Averaging period for calculating the RSI index. applied_RSI - The applied price. It can be any of the price constants: PRICE_CLOSE - Closing price, PRICE_OPEN - Opening price, PRICE_HIGH - Maximum price for the period, PRICE_LOW - Minimum
FREE
Crazy Scalper
Iurii Tokman
3.5 (4)
The Crazy Scalper trading robot does not use any indicators. It utilizes a scalping system, which trades in two directions simultaneously (buys and sells). Two opposite positions cannot bring profit at the same time, one of them will be losing. If there is a losing position, a lock is used. If the locking position fails and price reverses to the opposite, teh robot moves it to breakeven using the averaging system and pending orders. Settings TakeProfit = 3; - the take profit in points; Lock_Lev
StopLevel   The meter controls the STOPLEVEL level. When the level changes, it signals with an alert. STOPLEVEL - the   minimum offset in points from the current closing price for placing Stop orders, or the minimum allowable stop loss / take profit level in points. A zero value of STOPLEVEL means either the absence of a restriction on the minimum distance for stop loss / take profit, or the fact that the trading server uses external mechanisms for dynamic level control that cannot be transmitte
FREE
MovingInWL
Iurii Tokman
MovingInWL   The Expert Advisor is designed to move the stop of open positions to no loss when they reach a certain predetermined profit level. Description of the advisor settings: MagicNumber - order identifier LevelProfit - The level of profit in points that the position must reach in order for its stop to be moved to the level without loss. LevelWLoss - The level without loss in points, to which the stop position will be transferred after its profit reaches the   LevelProfit   level in points
FREE
Indicateur d'Ombres : Libérez la Puissance Cachée de Chaque Bougie ! Fatigué de l'analyse superficielle de l'action des prix ? Souhaitez-vous une compréhension plus profonde de la force des acheteurs et des vendeurs à chaque échelle de temps ? Nous vous présentons l' Indicateur d'Ombres – votre outil indispensable pour visualiser et analyser la dynamique cachée du marché ! Cet indicateur puissant transforme la bataille invisible entre les haussiers et les baissiers, reflétée dans la taille des o
FREE
Comb
Iurii Tokman
The indicator displays a grid in the form of a "honeycomb" or regular hexagon. An alternative to the standard grid of the terminal. Description of the indicator settings: color_comb - grid color width - width, for example: 22 for a screen resolution of 1920*1080, 15 for a screen resolution of 1366*768, etc. height - height, for example: 6 for a screen resolution of 1920*1080, 4 for a screen resolution of 1366*768, etc.
FREE
Robo T
Iurii Tokman
Robo T Expert Advisor is a non-indicator trading system. Expert Advisor settings: Level_ord - distance from the current price for placing initial pending Buy Stop and Sell Stop orders, the default value is 22. Lot_1 - initial lot for buy series, the default value is 0.1. Lot_2 - initial lot for sell series, the default value is 0.1. TakeProfit - profit level, the default value is 30. TSProfitOnly - only profit is trailed. If disabled, trailing is also performed in the negative stop-loss area. Th
Hammering
Iurii Tokman
Hammering is an automated trading system which works on any currency pair. Multi-currency and single-currency trading is performed. Making decisions the EA uses signals of the Slope Direction Line indicator. Settings. Profit_Percent_AccountEquity = 0.4; - profit as percentage of free margin Fix_AccountEquity = 0; - fixed level of free margin FIX_PROFIT = 1000; - fixed level of profit period = 55; - indicator period. FilterNumber = 2; - indicator filter. ma_method = 3; - indicator averaging metho
Robo Grid FX
Iurii Tokman
ROBO GRID FX is a grid Expert Advisor. It is developed for intraday trading in the active market and on fast currency pairs. This is a grid EA with a closed-loop averaging system. The closed-loop averaging system represents a stable strategy of moving to breakeven in case of the deposit drawdown on fast and aggressive currency pairs. The EA places a grid of pending orders in both directions and locks it on the breakthrough of a quote fluctuation in the channel of 40-60 points in case of an unrpo
Pyramid MA
Iurii Tokman
5 (1)
Pyramid MA - Characteristics of the EA: uses Moving Averages (MA) indicator. Changes order grid when a trend reverses. Exponent of order volume increase by the main trading grid against averaging positions. Works on pending BUYSTOP and SELLSTOP orders. Uses a system of averaging losses which controls a balance of open trades and moves it to breakeven. Sound alert about open and completed trades. You can easily create your own trading strategy on the basis of PYRAMID MA. Expert Advisor settings:
Boom
Iurii Tokman
The Expert Advisor is based on the indicator analysis. Trading decisions are made using Moving Average values. Indicators can be configured by external variables: TF = 0 - select a working timeframe. It can be one of the chart periods. 0 means the current chart period. 1 - 1 minute. 5 - 5 minutes. 15 - 15 minutes. 30 - 30 minutes. 60 - 1 hour. 240 - 4 hours. 1440 - 1 day. 10 080 - 1 week. 43 200 - 1 month. shift = 0 - index of obtained value from the indicator buffer (shifting back by specified
Forex Jumper
Iurii Tokman
1 (1)
Forex Jumper is an Expert Advisor for trading EURJPY. Candlestick pattern analysis is used for generating trading signals. The EA uses BUYSTOP and SELLSTOP pending orders. Settings: Lot = 0 - manual setup of the opened orders' volume Risk = 13 - MM risk percentage, the parameter works if Lot = 0 MagicNumber = 208 - ID of EA orders and positions, magic number TP = 20 - virtual profit level in points if there is a single unidirectional open position on the market TP2 = 20 - virtual profit level in
Bands Jazz
Iurii Tokman
Bands Jazz EA is based on the analysis of the Bollinger Bands indicator. The EA algorithm is simple - it uses Stop Loss, Take Profit and Trailing Stop. Settings TimeBeginHour —trading start hour. Values 0 to 24. TimeBeginMinute —trading start minute. Values 0 to 60. TimeEndHour —trading end hour. Values 0 to 24. TimeEndMinute —trading end minute. Values 0 to 60. period —averaging period for Bollinger Bands calculations. deviation —number of standard deviations from the main line for Bollinger B
Smart YTG
Iurii Tokman
4.6 (5)
Smart YTG has been developed for trading GBPUSD on the H1 chart. This is a trend following system and works well during trending price behavior using STOP orders. It detects trend by analyzing the Price Channel indicator which is built straight into the Expert Advisor, therefore you do not need to additionally install any indicator. On the flat areas where the market is undecided, and further movement of the market is being determined, a breakeven function is activated, and if there are open pos
Eureka Lock
Iurii Tokman
The Eureka Lock Expert Advisor detects flat price movement intervals relative to the specified settings. Trading is performed by BUY STOP and SELL STOP pending orders from the borders of the defined flat. Instead of limiting the losses, a loss-making position is locked by an increased volume. A virtual profit level is used as well. Settings: TF_flet = 15 - timeframe a flat is detected at Bars_flet = 25 - amount of bars for a flat detection extern int Size_flet = 30 - distance limit between the
The product shows general information in a single chart window. It is convenient when you trade many symbols simultaneously. The indicator shows the total number of positions and pending orders. The following info is displayed for opened positions: symbol, amount of opened buy orders for this symbol and their total profit in deposit currency, amount of opened sell orders and their total profit, total profit of opened buy and sell orders. The following info is displayed for pending orders: symbol
Moving Average. Calculation method: average value of all prices used for determining a bar. Description of External Settings of the EA: MA_period - period of averaging for calculation of the indicator. Recommended values: 5, 13, 21, 34. ma_method - averaging method. It can have any values ​​of the Moving Average method (Moving Average). 0 - (SMA) Simple Moving Average. 1 - (EMA) Exponential Moving Average. SMMA 2 - (SMMA) Smoothed Moving Average. LWMA 3 - (LWMA) Linear weighed Moving Average.
Description of the Settings: MA_period_fast - The period of averaging for calculation of fast Moving Average. MA_period_slow - The period of averaging for calculation of slow Moving Average. price - price used. It can be any of the price constants. 0 - (CLOSE) Close price. 1 - (OPEN) Open price. 2 - (HIGH) The maximum price. 3 - (LOW) The minimum price. 4 - (MEDIAN) The average price, (high+low)/2. 5 - (TYPICAL) Typical price, (high+low+close)/3. 6 - (WEIGHTED) Weighed close price, (high+low+clo
The Piramida Grid EA analyzes the values of the Slope Direction Line indicator for determining position entry. The grid of orders changes once the market reverses. Works on pending BUYSTOP and SELLSTOP orders. Uses a system of averaging losses which controls a balance of open trades and moves it to breakeven. Automatic detection of 4 and 5 decimal places. Expert Advisor Setup: period = 32; - period for the Slope Direction Line indicator FilterNumber = 2; - Slope Direction Line filter setup ma_m
The Martin Pristine trading robot analyzes the signals of the Price Channel Central indicator for trading decisions. No need to additionally attach the indicator to a chart, it's built into the Expert Advisor. After each losing trade, the lot is multiplied by 2. This Expert Advisor can detect 4 and 5-digit quotes automatically. Only one position can be open in the market at the same time. Expert Advisor settings: TF = 15; - select the chart timeframe for Price Channel Central Bars_Count = 100;
The Future Price indicator shows the probable variants of a future price movement based on the searching for matches in the quotes history. The indicator works in two modes: the first iterates over and displays the specified number of variants, the second - the indicator displays one specified variant. Settings Static_VARIANTS = 0; - display a specific variant; if = 0, iterates over all variants TOTAL_VARIANTS = 20; - the number of variants in the set, not greater than 30 is recommended Time_Se
Reanimator
Iurii Tokman
This is a semi-automatic trading robot. Buttons are used to open/close positions. Further position tracking is performed automatically by virtual profit level. Loss-making positions are averaged by increased/decreased lots. The buttons do not work in the strategy tester meaning that you can check the EA only on demo and real accounts. Special settings OPEN_BUY and OPEN_SELL can be used to test the EA in the strategy tester. Settings MagicNumber - identifier of the EA's orders. The robot works o
The indicator determines flat areas of the price movement according to the specified parameters. Settings: FletPips - limit in points for determining the flat FletBars - limit in number of bars for determining the flat CountBars - number of bars in history for the analysis of price movement. 0 - all bars in history are analyzed colir - color of the price section determined as flat Dop - additional drawing of price labels Alerts - display a dialog box with custom data Text - custom text for notif
Bar Boss
Iurii Tokman
5 (1)
The Expert Advisor uses the FletBoxPush indicator for market analysis and for determining trading signals. The indicator is built into the Expert Advisor, there is no need to additionally run it on a chart. The EA trades breakouts of certain levels determined as flat borders. The EA uses Stop Loss. Description of EA Parameters TimeFrames chart period required for the indicator colour - the color of the price zone defined as flat, a setting for the indicator Rectangle - show price zones defined
BarKhan
Iurii Tokman
The BarKhan indicator is calculated as sum of differences of three digital moving averages. The calculation formula is as follows: the difference of digital moving averages 1 and 2 is added to the difference of digital moving averages 2 and 3 Description of the indicator settings: MA_Period1 - the period of the first digital moving average MA_Period2 - the period of the second digital moving average MA_Period3 - the period of the third digital moving average
Octet
Iurii Tokman
Multi-currency indicator, analyzes 56 currency pairs simultaneously. It is important that all currency pairs are selected in the market watch with their history data downloaded. The indicator shows a rise or fall of a certain currency against the other 7 currencies as a total in the form of a line. The indicator values are expressed as a percentage. Description of the indicator settings Type_Calculation - three options for calculating the percentage of the currency rise or fall Prefix - used wh
Multi-currency indicator, analyzes 56 currency pairs simultaneously: AUD EUR GBP NZD CAD CHF JPY USD AUD SUMM EURAUD GBPAUD AUDNZD AUDCAD AUDCHF AUDJPY AUDUSD EUR EURAUD SUMM EURGBP EURNZD EURCAD EURCHF EURJPY EURUSD GBP GBPAUD EURGBP SUMM GBPNZD GBPCAD GBPCHF GBPJPY GBPUSD NZD AUDNZD EURNZD GBPNZD SUMM NZDCAD NZDCHF NZDJPY NZDUSD CAD AUDCAD EURCAD GBPCAD NZDCAD SUMM CADCHF CADJPY USDCAD CHF AUDCHF EURCHF GBPCHF NZDCHF CADCHF SUMM CHFJPY USDCHF JPY AUDJPY EURJPY GBPJPY NZDJPY CADJPY CHFJPY SUMM
Firm
Iurii Tokman
The Expert Advisor does not use indicator, it is always in the market. The logic of the EA is based on the analysis of the previously opened orders present in the market. Expert Advisor settings: StopLoss_Percent - loss level in percent TakeProfit - profit level in points Risk - setting for automatic calculation of order volumes for the EA, works if LOT =0 LOT - fixed volume of orders Slippage - maximum allowed price slippage MagicNumber - magic number for EA's orders Show_Information - enable o
Grid Flat
Iurii Tokman
The Expert Advisor places a grid of orders with the specified step. Orders have the take profit level set at the distance of grid step, as well as the total stop loss level for all order of the same type. Trading is performed only within the time interval specified in the settings. Once the time ends, all pending orders are deleted and all open positions are force-closed. It is not recommended to use the EA as a fully automated trading system for continuous trading, only for working in certain m
Filtrer:
xarax
313
xarax 2017.10.13 12:16 
 

L'utilisateur n'a laissé aucun commentaire sur la note

sanychkizim
338
sanychkizim 2017.06.21 07:26 
 

L'utilisateur n'a laissé aucun commentaire sur la note

Répondre à l'avis